Correlation between Radiologic and Pathologic Dimensions of Adrenal Masses ... that adrenocortical carcinomas are generally large at diagnosis and.
World J. Surg. 28, 494–497, 2004 DOI: 10.1007/s00268-004-7292-9
WORLD Journal of
SURGERY © 2004 by the Socie´te´ Internationale de Chirurgie
Correlation between Radiologic and Pathologic Dimensions of Adrenal Masses Rafael Fajardo, M.D.,1 Jorge Montalvo, M.D.,1 David Vela´zquez, M.D.,1 Jorge Arch, M.D.,1 Paulina Bezaury, M.D.,2 Rosa Gamino, S.W.,1 Miguel F. Herrera, M.D., Ph.D.1 1 Department of Surgery, Instituto Nacional de Ciencias Me´dicas y Nutricio ´n Salvador Zubira´n, Vasco de Quiroga 15, Tlalpan 14000, Mexico City, Mexico 2 Department of Radiology, Instituto Nacional de Ciencias Me´dicas y Nutricio ´n Salvador Zubira´n, Vasco de Quiroga 15, Tlalpan 14000, Mexico City, Mexico
Published Online: April 19, 2004
Abstract. The size of adrenal tumors has been shown to be a good predictor of malignancy. There is still some controversy about the concordance between radiologic and real pathologic measurements. The aim of this study is to determine the correlation between direct and corrected radiologic computed tomography scan dimensions and the measurements of the resected specimen. A total of 41 adrenal tumors were included. Direct and corrected measurements of the largest diameter were contrasted with the pathologic dimensions. The Linos formula was used for the corrected measurements. Proper statistics were used considering a two-tailed significance level of 0.05. The intraclass correlations using direct and corrected measurements were 0.89 [95% confidence interval (95%CI) 0.81–0.94, p = 0.00001) and 0.90 (95%CI 0.82–0.95, p = 0.00001), respectively. The bivariate analysis using Pearson´s correlation between two-dimensional group variables showed r = 0.82 (p < 0.0001) when direct and pathologic measurements were compared and r = 0.83 (p < 0.0001) when the corrected values were compared with the real dimensions. In this study, we demonstrate good correlation between radiologic and pathologic measurements of adrenal tumors. The Linos formula turned out to be significantly more accurate than direct radiologic measurements when means of the groups were compared, whereas when individual correlations were determined the two were similar. The Linos formula and radiologic measurements can be used to determine the proper management of adrenal incidentalomas in individual patients.
Adrenal incidentalomas are adrenal tumors discovered serendipitously by noninvasive abdominal imaging techniques performed in the absence of symptoms or clinical findings suggestive of adrenal disease [1–3]. They are most commonly found by computed tomography (CT), and adrenal lesions as small as 0.5 cm can be detected using this technique [2–4]. The evaluation of adrenal incidentalomas includes laboratory tests to evaluate hormone activity and imaging studies to rule out malignancy [2–4]. All functioning tumors and tumors suggestive of malignancy are candidates for surgical exploration; but considering that adrenocortical carcinomas are generally large at diagnosis and present with invasion to the surrounding structures, a cutoff size of
Correspondence to: Miguel F. Herrera, M.D., Ph.D., e-mail: herreram@ quetzal.innsz.mx
4 to 6 cm has been suggested to remove nonsuspicious incidentalomas, with 4 cm the size most commonly used. This cutoff value has been selected based on the size of benign and malignant tumors in large series, the fact that nonfunctioning malignant tumors < 4 cm have been rarely described, and the result of receiver operating characteristic (ROC) curves [5–7]. Moreover, incidentally found adrenal masses are usually small, nonfunctioning, and benign. The most common lesion is adrenocortical adenoma [1, 8, 9]. Lesions between 4 and 6 cm that are hormonally inactive and exhibit a benign imaging appearance can be monitored according to the recent consensus for the management of these lesions [10]. Size, on the other hand, has not been considered of any value when adrenal metastases are suspected [11]. Because surgical indications in many patients are based on tumor size, the correlation between the radiologic and real measurements is of paramount importance. It has been recognized that CT scanning underestimates the size of adrenal tumors by 20% to 47% [8, 11–14]. Linos [8], in a study comparing CT and histology reports, proposed a mathematical calculation to correct the tumor size determined by radiology. The aim of this study was to assess the correlation between radiologic and pathologic measurements of adrenal tumors using direct CT scan measurements and the corrected values obtained by the Linos formula.
Methods A series of 41 consecutive patients with adrenal tumors who underwent adrenalectomy at our institution were included in the study. Preoperative CT scanning was performed using a Somatom Plus helicoidal scanner (Siemens, fourth generation). The anteroposterior, lateral, and cephalocaudal measurements were reported in the official reading of the scans for each patient. All tumors were resected and measured by a pathologist who was blind to the CT measurements. Corrected CT values were obtained using the Linos formula (Histologic size (cm) = 0.85 + [(1.09)(CT major size in cm)] [8].
Fajardo et al.: Correlation of Adrenal Dimensions
495
Table 1. Differential diagnosis for adrenal incidentalomas (adrenalomas). Histopathologic diagnosis
No.
Adrenal cyst Cortical adenomas Simple cortical adenomas Adenoma with myelolipoma Pheochromocytoma Simple pheochromocytoma Pheochromocytoma with ganglioneuroma Adrenocortical carcinoma Simple carcinoma With extensive necrosis and vascular permeation Total
Frequency (%)
1
2.44
18 1
43.90 2.44
18 1
43.90 2.44
1 1 41
2.44 2.44 100
Table 2. Level of estimation of adrenal tumor size by direct radiologic measurements and the Linos formula. 1 cm Difference
0.5 cm Difference
Estimation level
Direct (no.)
Linos (no.)
Direct (no.)
Linos (no.)
Overestimated Correct Underestimated Total
1 (2%) 22 (54%) 18 (44%) 41 (100%)
10 (24%) 23 (56%) 8 (20%) 41 (100%)
4 (9.8%) 14 (34.1%) 23 (56.1%) 41 (100%)
18 (43.9%) 12 (29.3%) 11 (26.8%) 41 (100%)
Comparisons were made using the CT scan measurements, the corrected values (by the Linos formula), and the pathology measurements. All comparisons were performed using the largest tumor diameter. Student’s t-test, single-measure intraclass correlation for absolute agreement, and the kappa test were used for bivariate parametric statistics; and for the bivariate nonparametric analysis, Pearson’s, Kendall’s, and Spearman´s correlations for linearity were used. The single-measure intraclass correlation index was used because it can compare two tied dimensions (between two measurement methods or times) by individual item but not consider sample parameters such as the mean and standard deviation; therefore it could be more precise among individual differences. A pretest two-tailed significance level of 0.05 and 95% confidence intervals were established.
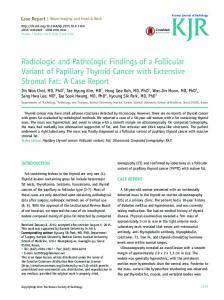
Fig. 1. Mean diameters and 95% confidence interval (95%CI) comparisons for three measurements between groups.
Fig. 2. Correlation between two distributions of measurements (pathology versus radiology) and (pathology versus Linos formula). Note that both correlations are similar when the linear adjustment is fitted.
Results Of the 41 patients, 34 were women and 7 were men with a mean age at surgery of 38 ± 14 years (range 18–71 years). In 21 cases the tumor was localized on the right adrenal (51.2%) and in 20 on the left (48.8%). The final diagnoses of the tumors are shown in Table 1. On pathologic examination the mean largest diameter for the total group was found to be 5.4 ± 3.0 cm (range 1.4–14.5 cm); the same dimension found by radiology was 4.2 ± 2.4 cm (range 1.0– 12.2 cm). The mean Linos corrected value of the largest diameter was 5.4 ± 2.6 cm (range 1.94–14.15 cm). Considering 1.0 cm and 0.5 cm differences in size as significant, direct radiologic measurements and the Linos formula arrived at different estimations of tumor size when compared with the real diameters. These results are shown in Table 2. The Linos adjustment had a tendency to overestimate tumor size. Simple bivariate analysis comparing arithmetic means with their 95% confidence intervals demonstrated a more accurate apprecia-
tion of the size using the Linos formula (Fig. 1). When the pathology size was compared with the radiologic direct measurement using the paired t-test, differences in size were statistically significant (p < 0.0001). In contrast, when the pathologic size was compared with the Linos adjustment, there were no statistically significant differences (t = 0.029, p = 0.97). Using the bivariate Pearson’s correlation and Spearman’s rho (Fig. 2), both direct and corrected (Linos) measurements showed similar degrees of linear correlation (r = 0.8 and 0.7, respectively) with statistical significant differences with the pathologic size (p < 0.0001). Kendall’s analysis showed similar results. Using the single measure intraclass correlation coefficient to compare the pathologic size with the direct radiographic diameter in each patient (tied measurements), the correlation index was 0.89 (95%CI 0.8–0.94; p = 0.00001). A comparison between the pathologic size and the Linos formula result revealed the index to be 0.90 (95%CI 0.82–0.95; p = 0.00001).
496
World J. Surg. Vol. 28, No. 5, May 2004
Table 3. Prevalence of adrenal incidentalomas on image and autopsy studies. Study
Year
Total patients
Frequency (%)
Glazer [15] Abecassis [11] Belldegrun [16] Ross [17] Herrera [6] Caplan [18] Xiao [19] Young [20] Mantero [5] Grumbach [10]
1982 1985 1986 1990 1991 1994 1998 2000 2000 2003
2,200 1,459 12,000 13,593 61,054 1,779 14,621 79,915 > 1,000 NIH consensus
0.7 1.3 0.7 2.0 0.5 1.5 1.5 0.9 1–5 0.1–4.3
NIH: National Institutes of Health. The prevalences are general, although it is well known that this prevalence is directly related to age.
Discussion Based on the results of various clinical series, adrenal tumors are discovered incidentally on 0.35% to 5.00% of abdominal CT scans obtained for different reasons (Table 3). Once an adrenal tumor is found and hormone hypersecretion is ruled out, we must decide between surgical excision and close observation [10]. Imaging phenotype and mass size are the two major predictors of malignancy [8, 10, 17, 21, 22]. Some radiologic characteristics may help in the differential diagnosis between benign and malignant adrenal tumors (Table 4). However, considering that most adrenal incidentalomas have a nonspecific appearance using imaging techniques, decisions are based mainly on the diagnostic likelihood of each specific tumor. Moreover, the imaging phenotype is not accurate in many cases, often varying with the visual interpretation [1, 5, 8, 15, 20]. In the absence of imaging characteristics suggestive of malignancy, tumor size has shown the closest correlation to malignancy [1, 7, 22, 25]. The number of asymptomatic nonfunctioning tumors < 3 cm that are malignant is low compared to the high prevalence of malignancy in tumors > 6 cm [3, 7, 8, 15, 21, 26]. Computed tomography scanning is the method most commonly used to evaluate adrenal incidentalomas. However, some investigators have highlighted problems in the exactitude of this method that may affect clinical judgment [5, 12, 25–28]. Discrepancies in the measurement may arise from two aspects: the accuracy of the procedure itself and the way measurements are performed. For most CT scans the anteroposterior and lateral axes are measured, and the cephalocaudal axis is taken into account less frequently. To improve these discrepancies, measurements must be taken considering all three axes [11, 12, 29]. Mantero and Arnaldi [5] found good correlation between radiologic size [CT or magnetic resonance imaging (MRI)] and the size measured at pathologic examination (r = 0.92, p < 0.0001), with higher accuracy of MRI for lesions < 3 cm [5, 11, 28–30]. In contrast, Linos and Jossart found that the adrenal mass size determined by radiology using CT scans was usually inferior to the size reported by pathology. The underestimation in their study ranged from 20% to 47% and was consistent in all groups [8, 23, 25, 30]. The present study was conducted to evaluate the accuracy of CT measurement of adrenal tumors. It is true that the ideal population for the study would include only adrenal incidentalomas. However, considering that not all adrenal incidentalomas are conducive to
Table 4. Differential diagnosis of imaging phenotypes by CT scanning: benign versus malignant masses.a Radiologic morphology
Benign
Malignant
Size Shape Margins Texture Density (without contrast)
Small (< 4 cm) Round to oval Smooth Homogeneous < 10 Hounsfield units
MR imaging (compared with liver) Necrosis/hemorrhage Growth
Isointense
Large (> 5 cm) Irregular Unclear or blurred Heterogeneous > 10 Hounsfield units Hyperintense
Rare Very slow
Common Usually rapid
CT: computed tomography; MRI: magnetic resonance imaging. Data are from Mantero and Arnaldi [5], Grumbach et al. [10], Caoili et al. [22], Young [20], Ng and Libertino [23], and Thompson and Young [24]. a
surgical excision and that adrenal incidentaloma is a clinical presentation rather than a pathologic entity (and that all tumors analyzed in the study could present as adrenal incidentalomas), we decided to include a representative group of cortical and medullar adrenal masses. One of the included tumors clinically presented as an incidentaloma. To avoid underestimating any of the axes, all three axes were routinely measured on all CT scans; moreover, considering that decisions are usually based on the largest diameter, the largest diameter was chosen for our evaluations. On the bivariate analysis, the direct measurement and the corrected value using the Linos formula were similar. However, when the overestimation and underestimation of real dimensions were taken into account, the Linos correction resulted in fewer underestimated values. Overestimation would lead to an increase in the number of patients selected for surgical treatment; and underestimation would deprive patients with adrenal cortical carcinomas proper medical attention. Therefore for the purpose of this particular pathology and considering that the risk of laparoscopic adrenalectomy is negligible in most patients, we favor overestimation of tumor size. Based on the analysis of this small series, we can see that CT scanning tends to underestimate the real dimension of adrenal tumors. However, for predicting the real pathologic size of the tumor the two methods—direct and corrected measurements using the Linos formula—provided similar results in 83.1% of the patients. Conclusions Based on our data, we concluded that when we compare the mean tumor size of a population the Linos adjustment is better than direct radiologic measurements for estimating the real size of an adrenal mass. Further analysis showed that the use of the singlemeasure intraclass correlation coefficient (rl) which is the most reliable test for determining differences between tied measures in an individual patient, showed similar results. We believe that a direct measurement or the Linos adjustment can be used when an individual patient is being evaluated. We also recognize that the general overestimation of the Linos formula can be advantageous, as it can minimize the number of false-negative results when evaluating adrenal tumors. Re´sume´. Il est de´montre´ que la taille des tumeurs de la surre´nale est un facteur pre´dicteur de la malignite´. Il existe cependant des controverses en
Fajardo et al.: Correlation of Adrenal Dimensions
ce qui concerne la concordance entre la taille estime´e par la radiologie et celle obtenue a ` l’examen anatomopathologique. Le but de cette ´etude a ´ete´ de de´terminer la corre´lation entre les dimensions obtenues par l’examen radiologique (tomodensitome´trie) et celles mesure´es sur la pie`ce re´se´que´e. Au total, 41 tumeurs de la surre´nale ont ´ete´ inclues. On a tenu compte des mesures directes et corrige´es du plus grand diame`tre, compare´es aux donne´es de l’examen de la pie`ce. La formule de Linos a ´ete´ utilise´e pour la mesure corrige´e. Les tests statistiques ´etaient bilate´raux : la limite de la signification a ´ete´ de 0.05. La corre´lation intraclasse en utilisant les mesures directes et corrige´es ont ´ete´, respectivement, de 0.89 (CI950.81– 0.94, p = 0.00001) et de 0.90 (CI950.82–0.95, p = 0.00001). L’analyse bivarie´e utilisant la corre´lation de Pearson entre les groupes de variables a ` deux dimensions a montre´ un r = 0.82 (p < 0.0001) lorsqu’on a compare´ les dimensions directes et pathologiques et un r = 0.83 (p < 0.0001) lorsque les valeurs corrige´es ont ´ete´ compare´es aux dimensions re´elles. Dans cette ´etude, nous avons mis en ´evidence une corre´lation entre les dimensions radiologiques et anatomopathologiques des tumeurs de la glande surre´nale. On a trouve´ que la formule de Linos a ´ete´ significativement plus pre´cise que les mesures radiologiques lorsqu’un on a compare´ les valeurs moyennes des groupes, mais lorsqu’on a de´termine´ les valeurs individuelles, les deux ´etaient similaires. La formule de Linos et les mesures individuelles peuvent ˆetre utilise´es pour de´cider de la meilleure prise en charge des incidentalomes de la surre´nale chez un patient donne´. Resumen. El taman ˜ o de los tumores de las ca ´psulas suprarrenales constituye un factor prono´stico por lo que a la malignidad de los mismos se refiere. Se discute si existe una concordancia entre el taman ˜ o radiolo´gico y el real, detectado en el especimen anatomopatolo´gico. El objetivo de este estudio es determinar si existe correlacio´n entre las dimensiones reales del especimen resecado y las medicaciones radiolo ´gicas (CT) realizadas tanto directamente como con la correccio´n adecuada. Se estudiaron 41 tumores de ca ´psula suprarrenal. El dia ´metro mayor medido tanto directamente como con la adecuada correccio ´n en la imagen obtenida mediante tomografı´a axial computerizada (CT) se comparo´ con el obtenido en el especimen anatomopatolo ´gico. La fo´rmula de Linos fue utilizada para la correccio´n de las medidas obtenidas. Se empleo ´ un me´todo estadı´stico apropiado para que la significacio ´n estadı´stica entre los dos brazos del estudio fuera 0.05. La correlacio´n entre las mediciones directas fue de 0.89 (CI950.81–0.94, p = 0.00001) y entre las corregidas de 0.90 (CI950.85–0.95, p = 0.00001). En un ana ´lisis bivariante utilizando la correlacio ´n de Pearson entre dos grupos de dimensiones variables se obtuvo una r = 0.82 (p < 0.0001) cuando se compararon el taman ˜ o medido directamente en la imagen del CT (TAC) y el registrado en la pieza anatomopatolo ´gica; cuando, se compararon los valores corregidos y las dimensiones reales, obtuvimos una r = 0.83 (p < 0.0001). Este estudio demuestra que existe en los tumores de las ca ´psulas suprarrenales una exacta correlacio´n entre las medidas radiolo´gicas y las de la pieza anatomopatolo´gica. La utilizacio´n de la fo ´rmula correctora de Linos proporciona una significacio´n ma ´s exacta, que la medicio´n radiolo ´gica directa cuando se comparan los valores medios entre los grupos, pero cuando se efectu ´a una medicio´n individual la correlacio´n fue similar. Las mediciones radiogra ´ficas, corregidas o no, mediante la fo´rmula de Linos, pueden utilizarse para decidir el tratamiento ma ´s adecuado en pacientes con incidentalomas de las ca ´psulas suprarrenales.
References
497
6.
7.
8.
9.
10.
11.
12.
13. 14.
15.
16. 17. 18. 19. 20.
21. 22. 23. 24. 25. 26.
1. Udelsman R, Fishman E. Radiology of the adrenal. Endocrinol. Metab. Clin. North Am. 2000;29:27–42 2. Kievit J, Haak H. Diagnosis and treatment of adrenal incidentaloma: a cost-effectiveness analysis. Endocrinol. Metab. Clin. North Am. 2000; 29:69–90 3. Staren ED, Prinz RA. Selection of patients with adrenal incidentalomas for operation. Surg. Clin. North Am. 1995;75:499–509 4. Siren J, Tervahartiala P, Sivula A, et al. Natural course of adrenal incidentalomas: seven-year follow-up study. World J. Surg. 2000;24:579– 582 5. Mantero F, Arnaldi G. Management approaches to adrenal inciden-
27. 28. 29. 30.
talomas: a view from Acona. Italy. Endocrinol. Metab. Clin. North Am. 2000;29:107–120 Herrera MF, Grant CS, van Heerden JA, et al. Incidentally discovered adrenal tumors: an institutional perspective. Surgery 1991;110:1014– 1021 Kasperlik-Zeluska AA, Roslonowska E, Slowinska-Srzednicka J, et al. Incidentally discovered adrenal mass (incidentaloma): investigation and management of 208 patients. Clin. Endocrinol. (Oxf). 1997;46:29– 37 Linos DA. Management approaches to adrenal incidentalomas (adrenalomas): a view from Athens. Greece. Endocrinol. Metab. Clin. North Am. 2000;29:141–158 Bailey RH, Aron DC. The diagnostic dilemma of incidentalomas: working through uncertainty. Endocrinol. Metab. Clin. North Am. 2000;29:91–105 Grumbach MM, Biller BMK, Braunstein GD, et al. Management of the clinically inapparent adrenal mass (“incidentaloma”): NIH conference. Ann. Intern. Med. 2003;138:424–429 Abecassis M, McLoughlin MF, Langer B, et al. Serendipitous adrenal masses: prevalence, significance and management. Am. J. Surg. 1985; 149:783–788 Linos DA, Stylopoulos N. How accurate is computed tomography in predicting the real size of adrenal tumors? A retrospective study. Arch. Surg. 1997;132:740–743 Linos DA, Stylopoulos N, Raptis SA. Adrenaloma: a call for more aggressive management. World J. Surg. 1996;20:788–793 Cerfolio RJ, Vaughan ED, Brennan TG, et al. Accuracy of computed tomography in predicting adrenal tumor size. Surgery 1993;176:307– 309 Glazer HS, Weyman PJ, Sagel SS, et al. Nonfunctioning adrenal masses: incidental discovery on computed tomography. Am. J. Radiol. 1982;139:81–85 Belldegrun A, Hussain S, Seltzer S, et al. Incidentally discovered mass of the adrenal gland. Surg. Gynecol. Obstet. 1986;163:203–208 Ross NS, Aron DC. Hormonal evaluation of the patient with an incidentally discovered adrenal mass. N. Engl. J. Med. 1990;323:1401–1406 Caplan RH, Strutt PJ, Wickus GG. Subclinical hormone secretion by incidentally discovered adrenal masses. Arch. Surg. 1994;129:291–296 Xiao XR, Ye LY, Shi LX, et al. Diagnosis and treatment of adrenal tumours: a review of 35 yearsa´ experience. Br. J. Urol. 1998;82:199–205 Young WF. Management approaches to adrenal incidentalomas: a view from Rochester. Minnesota. Endocrinol. Metab. Clin. North Am. 2000;29:159–185 Lee JE, Evans DE, Hickey RC, et al. Unknown primary cancer presenting as an adrenal mass: frequency and implications for diagnostic evaluation of adrenal incidentalomas. Surgery 1998;124:1115–1122 Caoili M, Korbkin E, Francis I, et al. Adrenal masses: characterization with combined unenhanced and delayed enhanced CT. Radiology 2002;222:629–633 Ng L, Libertino JM. Adrenocortical carcinoma: diagnosis, evaluation and treatment. J. Urol. 2003;169:5–11 Thompson GB, Young WF. Adrenal incidentaloma. Curr. Opin. Oncol. 2003;15:84–90 Jossart GH, Burpee SE, Gagner M. Surgery of the adrenal glands. Endocrinol. Metab. Clin. North Am. 2000;29:57–68 Schteingart DE. Management approaches to adrenal incidentalomas: a view from Ann Arbor. Michigan. Endocrinol. Metab. Clin. North Am. 2000;29:127–140 Barzon L, Boscaro M. Diagnosis and management of adrenal incidentalomas. J. Urol. 2000;163:398–407 Doppman JL, Reinig JW, Dwyer AJ, et al. Differentiation of adrenal masses by magnetic resonance imaging. Surgery 1987;102:1018–1026 Graham DJ, McHenry CR. The adrenal incidentaloma: guidelines for evaluation and recommendations for management. Surg. Oncol. Clin. N. Am. 1998;7:749–764 Favia G, Lumachi F, Basso S, et al. Management of incidentally discovered adrenal masses and risk of malignancy. Surgery 2000;128:918–924