Genome Informatics 11: 313–314 (2000)
313
Correlation between Sequence Conservation of 5’ UTR and Codon Usage Bias Hiroaki Sakai1,2
Yusuke Ohkuma1,3
Chiaki Imamura1,4
[email protected]
[email protected]
[email protected]
Akira
Shinagawa5
[email protected]
Piero
Carninci5
[email protected]
Yoshifumi
Fukunishi5
[email protected] 1 2 3 4 5
Masayoshi
Itoh5
[email protected]
Hideaki
Konno5
[email protected]
Yoshihide
Hayashizaki5
[email protected]
Kazuhiro Shibata5
[email protected]
Jun Kawai5
[email protected]
Masaru Tomita1,3
[email protected]
Laboratory for Bioinformatics Graduate School of Media and Governance Department of Environmental Information Department of Policy Management Keio University, 5322 Endo, Fujisawa, 252-8500, Japan Genome Exploration Research Group, Genomic Sciences Center (GSC) RIKEN (The Institute of Physical and Chemical Research) 1-7-22 Suehiro-cho, Tsurumi-ku, Yokohama, 230-0045, Japan
Keywords: codon usage bias, Kozak’s consensus sequence, translation efficiency
1
Introduction
Codons encoding the same amino acid are used often with biased frequency, and such codon usage bias is generally believed to be due to the selection for efficient translation [1]. We have previously shown that there is a correlation between the synonymous codon usage bias and the extent of the conservation of Shine-Dargalno sequence (SD sequence) in prokaryote genomes [3]. In this study, we conducted a similar analysis for Mus musculus, using the cDNA library data recently generated by RIKEN. In eukaryotes, there is no SD-like motif sequence, but the sequence pattern around the start codon, GCC(A/G)CCatgG, is well known as Kozak’s consensus sequence in vertebrates [2]. In order to analyze the correlation between synonymous codon usage bias and the extent of conservation in 5’ untranslated region (5’UTR), we first systematically computed the ‘codon adaptation index (CAI)’ values of all genes in the Mus musculus cDNA library data, and then analyzed their correlation with the 5’UTR conservation.
2
Methods
The CAI is an index to evaluate synonymous codon usage bias according to the codon usage of highly expressed genes. We followed the method of Sharp [5]. To evaluate the extent of 5’UTR conservation, we computed the ‘relative entropy’ values in each nucleotide position of Kozak’s consensus sequence. ’Relative entropy’ is one of the indices to understand the sequence patterns in the nucleotide positions. We followed the method of Schneider [4].
3
Results
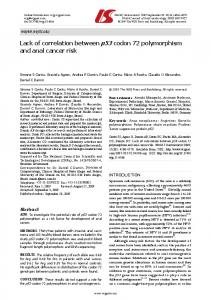
Figure 1 shows the correlation between the synonymous codon usage bias and relative entropy of three nucleotide positions (−3, −1 and 4 relative to the start codon). At the nucleotide position −1 and
314
Sakai et al.
−3, the significant correlation is observed, indicating that genes with higher CAI values have highly conserved nucleotides than genes with lower CAI values. We also analyzed the base compositions at each position (Figure 2), and found that the frequencies of specific nucleotides are higher for the genes with higher CAI values: purine nucleotides at position −3, C residue at position −1, and G residue at position 4, which is consistent with the base composition of Kozak’s consensus sequence. These results indicate that there exists a clear correlation between synonymous codon usage bias (CAI values) and Kozak consensus conservation (relative entropy values) in the M. musculus genome, presumably because highly expressed genes need to adopt both efficient codon usage and efficient translation initiation. Position -3 bp
Relative entropy x 10-3
Position -1 bp
Relative entropy x 10-3 450.00
450.00
400.00
400.00
400.00
350.00
350.00
350.00
300.00
300.00
300.00
250.00
250.00
250.00
200.00
200.00
200.00
150.00
150.00
150.00
100.00
100.00
100.00
50.00
50.00
50.00
0.00
0.00
0.00
ranking of genes 0
10
20
Position 4 bp
Relative entropy x 10-3
450.00
ranking of genes
30
0
10
20
ranking of genes
30
0
10
20
30
Figure 1: Relative entropy of three nucleotide positions (−3, −1 and 4 relative to the start codon). The X axis represents the ranking of CAI values of genes. Position -3 bp
frequency x 10-3
adenine thymine guanine cytosine
650.00 600.00
Position -1 bp
frequency x 10-3
adenine thymine guanine cytosine
650.00 600.00 550.00
550.00
500.00
500.00
500.00
450.00
450.00
450.00
400.00
400.00
400.00
350.00
350.00
350.00
300.00
300.00
300.00
250.00
250.00
250.00
200.00
200.00
200.00
150.00
150.00
150.00
100.00
100.00
100.00
50.00
50.00
50.00
0.00
0.00
ranking of gene 0
10
20
30
adenine thymine guanine cytosine
600.00
550.00
0.00
Position 4 bp
frequency x 10-3 650.00
ranking of gene 0
10
20
30
ranking of gene 0
10
20
30
Figure 2: Frequencies of four bases at the three nucleotide positions (−3, −1 and 4). The X axis represents the ranking of CAI values of genes.
References [1] Gouy, M. and Gautier, C., Codon usage in bacteria: correlation with gene expressivity, Nucleic Acids Res., 10:7055–7074, 1982. [2] Kozak, M., An analysis of 5’-noncoding sequences from 699 vertebrate messenger RNA, Nucleic Acids Res., 15:8125–8148. [3] Sakai, H. et al., Correlation between Shine-Dalgarno sequence conservation and codon usage of bacterial genes, J. Mol. Evol., in press. [4] Schneider, T. et al., Information content of binding sites on nucleotide sequences, J. Mol. Biol., 188:415–431. [5] Sharp, P.M. and Li W.H., The codon adaptation index –a measure of directional synonymous codon usage bias and its potential applications, Nucleic Acids Res., 15:1281–1295, 1987.