Journal of Computational Intelligence in Bioinformatics ISSN 0973-385X Volume 5, Number 2 (2012) pp. © Research India Publications http://www.ripublication.com/jcib.htm
Correlation between the Mutated Colour Tunings and Carbon Distributions in Luciferase Bioluminescence 1*
Nsimama, P.D., 1Mamboya, A.F. 1Amri, E. and 2Rajasekaran, E. 1
Department of Science and Laboratory Technology, Dar Es Salaam Institute of Technology, P.O. Box 2958, Dar Es Salaam-Tanzania. 2 Department of Bioinformatics, School of Health Science and Biotechnology, Karunya University, Karunya Nagar, Coimbatore – 641 114, Tamil Nadu-India *Corresponding Author E-mail:
[email protected],
[email protected]
Abstract This work reports on the changes of the emission properties of luciferase brought by mutations and its relation to the carbon distribution in the protein. The shifting of the emission peaks brought by point mutations; S286N, I288A, and I288V of the Japanese firefly luciferase and their corresponding carbon distributions are discussed. The decay rate changes of the bacteria luciferase through E175G mutation and its relation to the carbon distribution is reported. The carbon content peak positions of the Japanese firefly luciferase mutants (S286, I288A and I288V) tend to shift to the left of 0.3145 when the emission peaks shift to yellow and red regions. Similarly, the left shifting of the carbon content peak for the bacteria luciferase was accompanied by the increase in luciferase decay. The sequence and the crystal structure of luciferin emitting body are also discussed. Keywords: luciferase, bacteria, bioluminescence, protein structure, carbon distribution.
Background The phenomenon of bioluminescence has been observed in many different organisms including bacteria, fungi, algae, fish, squid, shrimp and insects. Luminous organisms produce light by an enzymatic reaction of a luciferase (an enzyme) with a luciferin (substrate). Light-emitting reactions are quite distinct among luminous organism, but
106
Nsimama, P.D. et al
in each case the reaction is an oxidation process with molecular oxygen and is a conversion of chemical energy into light [1-3]. In insects, the luminous species are mainly found in three families: fireflies (lampyridae), railroad worms (phengodidae) and click beetles (elateridae) [2, 3]. The bioluminescence systems of these insects are essentially the same with an identical luciferin, ATP, and Mg2+, and with similar luciferases [3]. The emission wavelength tuning by mutations of the luciferase protein and the investigations of their corresponding decay rate has drawn a great interest in the luciferase bioluminescence as substantiated by quite a good number of reports [4-7]. However, the studies of the wavelength tuning and decay rates in relation to the carbon distribution are not found in the literature. The carbon distribution in a protein has been found to be the main determinant for distinguished protein properties as reported elsewhere [8-10]. In the current work, we are reporting on the carbon distribution of natural and mutated luciferase, which were reported [4, 11] to change the bioluminescence emission peak and the decay rates of luciferase. To the best of our knowledge, this is the first report on the same.
Materials and Methods The protein sequences used in the following study are collected from Disprot database (www.disprot.org) based on the protein reported elsewhere [4, 11]. The carbon distribution along the sequence is obtained using the carbon analysis (CARBANA) program [10], available online. A window size is chosen based on the length of the sequence of a given protein. In the current work the maximum window was of 550. CARD program [9] was used to study the mutational sites of the protein sequences. Different outer lengths and inner lengths of 35 are used.
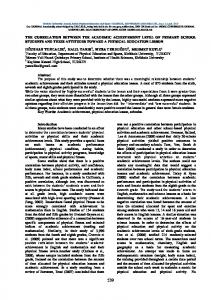
Results and Discussion Carbon distribution for the wild and mutant (S286N) Japanese firefly luciferase Figure 1 shows the carbon distribution for the wild and S286N mutated Japanese firefly luciferase.
Figure 1: Carbon distribution for the native and mutant (S286) luciferase.
Correlation between the Mutated Colour Tunings
107
It is clear from the results that the carbon content for both wild-type and mutant S286N Japanese firefly luciferase are not normally distributed. This is contrary from our previous reports [8-9], whereby it was established that natural stable proteins have a normal distribution of its carbon content symmetrical about 0.3145. This is possibly due to the presence of a luciferin* excited state, which is formed in some middle stages of the bioluminescence process. The carbon content peak positions for the two proteins are different. The wild-type luciferase has a peak at the carbon content of 0.343, which is higher than the normal peak position for stable proteins. It has a shoulder at 0.286 carbon content. Interestingly, the S286N mutant luciferase has a carbon content peak at 0.314 and a shoulder at 0.257. This implies more stable protein was obtained through S286N mutation. According to the results reported elsewhere [4], the mutant S286N of the Japanese firefly luciferase, gave red emission peak, different from the wild-type Japanese firefly luciferase whose emission peak was green yellow, at 560 nm. It is therefore reasonable to conclude from the above results that higher wavelength emission peaks of luciferase bioluminescence shifts the carbon content peak to values lower than the stable position of 0.3145. This carbon distribution study can be used to mutate these light emitting proteins to alter the decay rate. Carbon distribution for the wild-type, mutants I288A and I288V of Japanese luciferase. The carbon distribution for the wild-type and mutants (I288A and I288V) of the Japanese firefly luciferase is shown in Figure 2. As observed in section 3.1, the wildtype firefly luciferase shows the carbon distribution which is not normally distributed. This is really showing that its stability is not to the standard of the normal stable proteins. It has a kink at carbon content 0.286. The mutant I288V has the required normal distribution for the stable protein. It has a main peak at 0.314 carbon content. This suggests that a more stable Japanese firefly luciferase is obtained upon mutating Isoleucine with lower amino residues. The mutant I288A has the carbon distribution which is not normally distributed. It has the main carbon content peak at 0.286 and a small peak at 0.40 carbon content. It was reported [4] earlier that the wild-type enzyme, the mutants I288A and S286N of the Japanese firefly gave single emission maxima at 560 nm (yellowgreen), 613 nm (red) and 605 nm (red), respectively. The excited states seem to shift from a higher to a lower energy level as the amino acid residue at position 288 changes from an Ile to Val and Ala (decreasing the size and the hydrophobicity of the side chain). Most firefly luciferases that emit yellow-green light have an Ile or a Leu residue at this amino acid position, whereas other luciferases that emit differently coloured light do not [4].
108
Nsimama, P.D. et al
Figure 2: Carbon distribution for the wild-type, I288A and I288V mutants of a Japanese Genji-botaru. It can therefore be stated based on the previous [4] and current results that as the carbon content main peaks move to the left of 0.314 the corresponding emission peaks moves to longer wavelengths from the wild-type firefly luciferase emission peak of 560 nm wavelength. Carbon distribution for the native and E175G bacteria luciferase: It was reported previously [11] that replacing glutamate with glycine in the 175th residue (E175G) in LuxA luciferin bacteria sequence changed the bioluminescence decay rate from a slow to a fast one. The experiments were done at pH of 0.7. The carbon distribution for the natural stable and E175G mutant luciferase is given in Figure 3.
Figure 3: The carbon distribution for the wild form of bacteria luciferase and mutant (E175G). The native bacteria luciferase carbon distribution (red colour) is to a large extent, similar to the well known normal distribution of the carbon content, which is
109
Correlation between the Mutated Colour Tunings
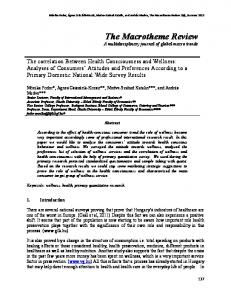
symmetrical about 0.3145. It has a kink at 0.257 carbon content and a small peak at 0.371. On the other hand, the mutant (E175G) has a better normal distribution curve of carbon content, though the symmetry is at 0.286. It also has a lower peak at 0.371. Comparing the result from this work and the previous [11] reports, it can be noted that the bacteria luciferase with carbon content peak position lower than 0.3145 end up having a faster decay rates than the native one. There are clear explanations for the carbon content deviation from normal distribution at 0.371 which are necessary for emission property. The difference between the fast luminescence decay of the E175G mutant and the slow decay of XL luciferase indicated that the Glu175 residue in the central region (residues 166–233 of LuxA) is likely involved in aldehyde binding and the mechanism of turnover of the oxygenated enzyme-flavin (EFO) and Aldehyde-EFO (EFOA) intermediates [12]. Higher decay rate constant of mutant (E175G) luciferase was interpreted by weakening of flavin-enzyme interaction and faster decomposition of EFO intermediates [12]. The carbon distribution for the entire sequences of the wild-type Japanese firefly luciferase and the bacteria luciferase is shown by Figure 4. The left vertical line represents the carbon content. The middle horizontal line of each separate graph represents the optimum carbon content (0.3145) for the stable protein. The upper and lower part of the middle line are the hydrophobic (carbon content 0.3145) and the hydrophilic (carbon content 0.3145). Almost all of the carbon distributions from Figure 4 show a good balance about the optimum value of 0.3145 suggesting quite stable proteins for entire sequences. The carbon distribution for the firefly seems to differ much from that of the bacteria luciferase. It is worthwhile noting that the sequence lengths for the two proteins are 548 and 355 for the Japanese firefly luciferase and bacteria luciferase respectively. The carbon distribution for the respective mutated sequences gave a similar result (not shown). The carbon distribution for the entire sequence doesn’t differ from natural proteins entire sequence carbon distributions. Bacteria luciferase
0.40
0.36
0.32
Japanese firefly.luciferase
0.28 0.40 0.36 0.32 0.28 0.24
100
200
300
400
500
Residue position
Figure 4: Carbon distributions for the entire sequences of the Japanese firefly luciferase and bacteria luciferase.
110
Nsimama, P.D. et al
Structure The firefly luciferase molecule folds into two distinct domains. The major portion of the structure, comprising residues 4-436, consists of a compact domain containing a distorted anti-parallel β-barrel and two β-sheets, which are flanked on either side by alpha α-helices. The C- terminus of the protein (440-544) forms a small separate α + β domain. The C-terminal Ser-Lys-Leu tripeptide is responsible for peroxisomal targeting [13]. In the luciferase structure this sequence is disordered and exposed to solvent, presumably allowing interaction of the targeting signal with its receptor. The 3D structures for these two proteins discussed in this work are shown in Figures 5(a) and 5(b).
Figure 5(a): The crystal structure of Japanese firefly luciferase.
Figure 5(b): The crystal structure of bacteria luciferase. The corresponding sequences (in FASTA format), which were used in the current work is given below: Japanese wild-type luciferase (2D1Q) >2D1Q:A|PDBID|CHAIN|SEQUENCE MENMENDENIVVGPKPFYPIEEGSAGTQLRKYMERYAKLGAIAFTNAVTGVD
Correlation between the Mutated Colour Tunings
111
YSYAEYLEKSCCLGKALQNYGLVVDGRIALCSENCEEFFIPVIAGLFIGVGVAP TNEIYTLRELVHSLGISKPTIVFSSKKGLDKVITVQKTVTTIKTIVILDSKVDYR GYQCLDTFIKRNTPPGFQASSFKTVEVDRKEQVALIMNSSGSTGLPKGVQLTH ENIVTRFSHARDPIYGNQVSPGTAVLTVVPFHHGFGMFTTLGYLICGFRVVML TKFDEETFLKTLQDYKCTSVILVPTLFAILNKSELLNKYDLSNLVEIASGGAPL SKEVGEAVARRFNLPGVRQGYGLTETTSAIIITPEGDDKPGASGKVVPLFKAK VIDLDTKKSLGPNRRGEVCVKGPMLMKGYVNNPEATKELIDEEGWLHTGDI GYYDEEKHFFIVDRLKSLIKYKGYQVPPAELESVLLQHPSIFDAGVAGVPDPV AGELPGAVVVLESGKNMTEKEVMDYVASQVSNAKRLRGGVRFVDEVPKGL TGKIDGRAIREILKKPVAKM Bacterial luciferase (LUXA) >sp|P07740|LUXA_VIBHA Alkanal monooxygenase alpha chain OS=Vibrio harveyi GN=luxA PE=1 SV=1 MKFGNFLLTYQPPELSQTEVMKRLVNLGKASEGCGFDTVWLLEHHFTEFGLL GNPYVAAAHLLGATETLNVGTAAIVLPTAHPVRQAEDVNLLDQMSKGRFRF GICRGLYDKDFRVFGTDMDNSRALMDCWYDLMKEGFNEGYIAADNEHIKFP KIQLNPSAYTQGGAPVYVVAESASTTEWAAERGLPMILSWIINTHEKKAQLD LYNEVATEHGYDVTKIDHCLSYITSVDHDSNRAKDICRNFLGHWYDSYVNAT KIFDDSDQTKGYDFNKGQWRDFVLKGHKDTNRRIDYSYEINPVGTPEECIAII QQDIDATGIDNICCGFEANGSEEEIIASMKLFQSDVMPYLKEKQ
Conclusion The carbon distributions for the native and mutants S286N, I288V, I288A & E175G of luciferase have been analyzed. All native proteins don’t have the normal distribution of carbon, which is always observed for stable proteins, which we attribute it to the presence of excited states in the protein. There is a correlation between the bioluminescence wavelength tuning and the decay properties and the carbon distribution of luciferase proteins. The carbon content peak positions tend to shift to the left of 0.3145 when the emission peaks shift to wavelengths longer than 560 nm to give yellow and red coloured emissions. Similarly, left shifting of the carbon content peak was accompanied by the increase in luciferase decay. The carbon distributions for the entire sequences of firefly luciferases are similar, but differ with that of the bacteria luciferase. However, the hydrophobicity and hydrophilicity of all the proteins for the entire sequences balance quite well at the optimum position of stable proteins. Card program can be used to alter the protein’s decay rate.
Acknowledgements This work was sponsored by the World Bank under the QUICK WIN PROJECTS at the Dar Es Salaam Institute of Technology. We are grateful to Prof. Suzan (International Office) and Prof. Janet (Head, Bioinformation Department) at Karunya University for their cooperation.
112
Nsimama, P.D. et al
References [1] Viviani, V. R., 2002,"The origin, diversity, and structure function relationships of insect luciferases," Cell. Mol. Life Sci., 59, pp .1833–1850. [2] Villalobos, V., Naik, S., Bruinsma, M., Robin S. Mei-Hsiu Pan D., Sarakandi, M., Moss, B., Elhammali, A., and Piwnica-Worms, D., 2010, "Dual-colour click beetle luciferase heteroprotein fragment complementation assays," Chem & Biol., 17, pp. 1018–1029. [3] Inouye, S., 2010, "Firefly luciferase: an adenylate-forming enzyme for multicatalytic functions," Cell. Mol. Life Sci. 67, pp. 387–404. [4] Nakatsu, T., Ichiyama, S., Hiratake, J., Saldanha, A., Kobashi, N, Sakata, K. and Kato, H. 2006. "Structural basis for the spectral difference in luciferase bioluminescence," Nature 440, pp. 372–375. [5] Biggley, W. H., Lloyd, J. E. and Seliger, H. H., 1967, "The spectra distribution of firefly light," J. Gen. Phys., 50, pp. 1681–1692. [6] Conti, E., Ranksa, P N. and Brick P., 1996, "Crystal structure of firefly luciferase throws light on a super family of adenylate-forming enzymes," Structure 4, pp 287–298. [7] De Wet J R., Wood, K. V., De Luca, M., Helinski, D. R. and Subramani S., 1987, "Firelfy luciferase Gene: structure and expression in Mammalian cells,"Molec. and cellul. Biol. 7(2), pp.725–837. [8] Rajasekaran, E., Akila K., Vijayasarathy, M., 2011, "Allotment of Carbon is Responsible for Disorders in Proteins," 6(8), pp. 291–292. [9] K. Akila, N. Sneha and E. Rajasekaran, 2012, " Study on carbon distribution at protein regions of disorder," Intern. J. Biosc., Biochem. and Bioinf., 2(2), pp. 58–60. [10] Rajasekaran E and Vijayasarathy M., 2011, "CARBANA: Carbon analysis program for protein sequences" Bioinformation 5(10), 458–457. [11] Madvar, A. R., Hosseinkhani, S., Khajeh, K., Ranjbar, B., Assodeh, A., 2005, "Implication of a critical residue (Glu175) in structure and function of bacterial luciferase," FEBS letters, 579, pp. 4701–4706. [12] Hosseinkhani, S., Szittner, R. and Meighen, E., 2005, "Random mutagenesis of bacterial luciferase: critical role of Glu175 in control of luminescence decay," Biochem. J., 385, pp.575–580. [13] Gould, S.J., Keller, G.A., Hosken, N., Wilkinson, J. and Subramani, S.,1989, "A conserved tripeptide sorts proteins to peroxisomes," J. Cell Biol. 108, pp. 1657–1664.