CORRELATION BETWEEN THE SECONDARY STRUCTURE ELEMENTS IN THE SPATIAL ARRANGEMENT OF THE EF-HAND CALCIUM BINDING PROTEINS
DANA CRACIUN1, ADRIANA ISVORAN2 1
Teacher Training Department, West University of Timisoara, 4 V. Pirvan, 300223 Timisoara, Romania, E-mail:
[email protected] 2 Department of Biology-Chemistry, West University of Timisoara, 16 Pestalozzi, 300316 Timisoara, Romania, E-mail:
[email protected] Received August 5, 2014
We use the spectral analysis and detrended fluctuation analysis methods to explore the series of data describing the secondary structure motifs of EF-hand calcium binding proteins (EFCaBPs). There are two types of EFCaBPs: calcium sensors usually exhibiting extended spatial structures and calcium buffers usually displaying compact spatial structures. The description of secondary structure motifs of investigated proteins is performed using the SA-Mot analysis method, implemented on-line under SA-Mot server (http://sa-mot.mti.univ-paris-diderot.fr/). The values of both spectral coefficient (obtained using spectral analysis method) and scaling exponent (obtained using detrended fluctuation analysis method) reveal long-range correlation in the successive positioning of the secondary structure motifs in the spatial arrangement of the EF-hand calcium binding proteins and there are not distinct characteristics for extended and compact EFCaBPs. Key words: calcium binding proteins, nonlinear dynamics, long-range correlation.
1. INTRODUCTION
Calcium plays an important role in many of biological processes binding to numerous proteins called calcium-binding proteins (CaBPs). A large number of calcium binding proteins contain an EF-hand structural motif being called EF-hand calcium binding proteins (EFCaBPs) and presenting extended or compact spatial structures in strong correlation with their biological functions [1]. The EF-hand motif generally consists of a 12-residue calcium-binding loop flanked by two α-helices and it is the most conserved motifs in terms of component amino acids [2]. In the compact structure case, the two domains are in close contact but in the extended structures they are clearly separated. Rom. Journ. Phys., Vol. 60, Nos. 7–8, P. 1103–1111, Bucharest, 2015
1104
Dana Craciun, Adriana Isvoran
2
In order to describe or predict protein functions it is important to identify functional motifs in proteins. There are a few webservers allowing identification and extraction of structural motifs of proteins. One of these tools is the structural alphanet HMM-SA [3]. It is a collection of 27 structural prototypes of four residues called structural letters that simplifys the spatial structure of a protein into 1D sequences. It also allows to identify spatial similarity acroos proteins. Starting from HMM-SA data, the next step is the description of each structural motif and identification of motifs of interest, which is provided by SA-Mot server [4]. Within this study, we use the SA-Mot server to identify the structural motifs of interest in EFCaBPs. After identification, we perform a computational analysis in order to make known if there is a long-range correlation between structural motifs of the secondary elements of the EFCaBPs with consequences on the relationship between CaBPs dynamics/structures and biological functions. It is already well known that these proteins contain at least one structural motif, the EF-hand that is found in numerous proteins and has variuos functions, from the calcium-signal transmission to protein-target recognition [1]. There are numerous studies revealing the long-range interactions in protein sequences and their effects on protein secondary structure prediction [5–8]. Also, our group revealed nonlinear properties both for the sequence [8, 9] and the structural aspects of CaBPs [10, 11]. Considering the structural features of CABPs, distinct non-linear properties have been observed for extended and compact EFCABPs respectively, in good correlation with their biological functions [8–11]. 2. METHODS
There are many protein structural bioinformatics related resources on the web concerning both information of specific aspects of protein sequences and structures and on-line servers allowing sequences and structures comparison and/or characterization. When performing a computational study based on proteins sequence and structure data, two general on-line free accessible databases are used: UniProt as a resource for protein sequences and functional information [12] and Protein Data Bank as a resource for protein structural files [13]. We have used these databases to extract sequence and structural information of the EFCaBPs. There are 582 entries in Protein Data Bank concerning calcium binding proteins reflecting the highest interest for studying this protein family. The proteins considered in our study belong to the EF-hand family and are presented in Table 1. They have been chosen as native structures without ligands (except calcium ions when available) and reflecting no more than 80% sequence similarity. Previous studies published by our group revealed 80% sequence identity for the extended
3
Correlation in the EF-hand calcium binding proteins
1105
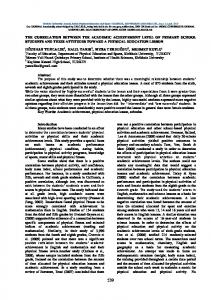
EFCaBPs and a 50% for the compact ones [14]. In addition to the protein name, Table 1 also contains the structural class that protein belongs, the codes entry for UniProt database and Protein Data Bank respectively and the experimental method used for structure determination. Starting from structural data we obtained the secondary structure sequence, (the description of the secondary structure motifs) of investigated EFCaBPs using the SA-Mot analysis on-line resource [4], http://sa-mot.mti.univ-paris-diderot.fr/. This structural alphabet permits the simplification of a 3D protein structure into 1D sequence using structural letters and giving the secondary structure sequence of the protein chain. Figure 1 illustrates the use of this tool for the Bovine recombinant neurocalcin delta (PDB code entry 1BJF, chain A), where AA denotes the aminoacid sequences of a protein chain, SL denotes the structural-letter sequences of a protein chain and SS denotes the secondary-structure sequences of a protein chain (1 for loop, 2 for α-helix, 3 for β-strand). Table 1 The proteins considered in this study Structural class
Compact CaBP
Extended CaBP
Protein Entamobea histolica calcium binding protein Yeast myosin –light chain Bos Taurus recoverin Rattus norvegicus calcineurin B Guanylat cyclase activating protein Bovine recombinant neurocalcin delta Amphioxus sarcoplasmic calcium-binding protein Nereis diversicolor sarcoplasmic calcium-binding protein Calerythrin Human CIB Rabit skeletal muscle troponin C Human calmodulin Paramecium tetraurelia calmodulin Potato calmodulin Xenopus laevis calmodulin Human calmodulin-like protein Sacharomices cerevisiae calmodulin
PDB Code entry
UniProt Code entry
Experimental method
1JFJ
P38505
NMR
1GGW 1REC 2CT9
Q09196 P61023 P21457
NMR X-ray X-ray
1JBA
P51177
NMR
1BJF
P61602
X-ray
2SAS
P04570
X-ray
2SCP
P04571
X-ray
1NYA 1DGU 5TNC 1CLL 1OSA 1RFJ 1DMO 1GGZ 1LKJ
P06495 Q99828 P02588 P62158 P07463 Q42478 P62155 P27482 P06787
NMR X-ray X-ray X-ray X-ray X-ray NMR X-ray NMR
1106
Dana Craciun, Adriana Isvoran
4
Fig. 1 – SA-Mot results for the secondary structure sequence for Bovine recombinant neurocalcin delta-chain A (PDB code entry 1BJF).
To make further computational analysis of the secondary structure elements in the spatial arrangement of these proteins, we have assigned for the unstructured regions the value 0. In order to avoid analysis of similar structures, we need information concerning structure identity of considered proteins. In order to assess the structural similarity between the considered structures we perform structures superposition using Structure Matching tool under CHIMERA software [15]: the most similar in structure are the troponin (5TNC) and calmodulin with RMSD = 1.102 Å based on 16 alpha-carbon atoms (Fig. 2a) and the most divergent are the calmodulin (1CLL) compared to guanylat cyclase activating protein (1JBA, obtained by NMR) with RMSD = 1.851 Å based on 25 alpha-carbon atoms (Fig. 2b). These data illustrate that we do not analyze similar structures.
(a)
(b)
Fig. 2 – Structures superposition: (A) human calmodulin (1CLL, black) superposed to rabbit troponin C (5TNC, grey); (B) human calmodulin (1CLL, black) superposed to guanylat cyclase activating protein (1JBA, grey).
5
Correlation in the EF-hand calcium binding proteins
1107
We investigated the presence of long-range correlation between the successive positioning of the secondary structure elements in the spatial arrangement of proteins using the non-linear analysis methods: spectral analysis (SA) and detrended fluctuation analysis (DFA) respectively. Spectral analysis method (SA) means that each data series was subjected to a Fast Fourier Transform. This plot gives the power spectrum and for non-linear dynamics it obeys the power law distribution
P( f ) ~ 1
f
β
,
(1)
where f is the frequency. The slope of the spectrum in double logarithmic scale is β, the spectral coefficient [16]. In order to remove the non–stationary component, the detrended fluctuations analysis (DFA) method can be used [17]. DFA method gives the scaling exponent, α, who is related to the spectral coefficient by [16]:
β = 2α − 1
(2)
Those related values are used to characterize the series of evaluated data [18]: α = 0.5 and β = 0 correspond to random series, α = 1 and β = 1 corresponds to so call “1/f” series (f is the frequency) and α = 1.5 and β = 2 correspond to Brownian noise. 3. RESULTS AND DISCUSSIONS
Power
The use of the SA and DFA methods is illustrated in Figs. 3 and 4 respectively. The linear fitting of the power spectrum and DFA plots produces correspondingly the spectral coefficients and the scaling exponents. 10
-2
10
-3
1x10
-4
1x10
-5
10
-6
10
-7
5TNC
1E-3
0.01
0.1
Frequency (Hz) Fig. 3 – Illustration of the application of SA method for rabbit skeletal muscle troponin C, PDB code entry 5TNC.
1108
Dana Craciun, Adriana Isvoran 0.4
6
1BJF
0.2
log(F(n))
0.0 -0.2 -0.4 -0.6 -0.8 0.6
0.8
1.0
1.2
1.4
1.6
1.8
log(n)
(a) 0.4
2SCP
0.2
log(F(n))
0.0 -0.2 -0.4 -0.6 -0.8 0.6
0.8
1.0
1.2
1.4
1.6
log(n)
(b) Fig. 4 – Illustration of the application of DFA method for Bovine recombinant neurocalcin delta, PDB code entry 1BJF (a) and Nereis diversicolor sarcoplasmic calcium-binding protein, PDB entry code 2SCP (b).
For the compact EFCaBPs 1BJF, 2SAS, 1JFJ, 1GGW, 1JBA and extended EFCaBP 1DMO, the DFA plots show two linear regions (as illustrated in the Fig. 4a). The first region corresponds to stationary fluctuations and the second region to nonstationary fluctuations. Among these structures 1BJF and 2SAS are homo-dimers and 1JFJ, 1GGW, 1JBA and 1DMO are structures obtained using NMR methods. It reflects the effects of the solvent and those of the interactions between the monomeric units for polymerization resulting in non-stationary fluctuations. The values of the slopes of the second linear region in DFA plots is always lower that those obtained for the first linear regions indicating a lower correlation at long distances in the series of data. The crossover of the lines occurs at log(n) = 1.23 meaning that n = 17. This value corresponds to the length of the dominant long-range correlation measured here in number of amino acids and it is in good agreement with other published data [19, 20].
7
Correlation in the EF-hand calcium binding proteins
1109
The spectral coefficients and scaling exponents obtained using the nonlinear analysis of series of the secondary structure elements of considered EFCaBPs are presented in Figure 5. The mean values of the spectral coefficient are α = 1.36±0.12 and α = 1.29±0.11 for extended and compact EFCaBPs respectively. ANOVA statistical test reflects that, at 0.05 level, the two means are not statistically distinct. It is also true for the values of the scaling exponents: β = 1.02±0.03 and β = 0.89±0.03 for extended and compact EFCaBPs respectively.
1.36 spectral coefficient
spectral coefficient
1.50
1.35
1.20
1.32 1.28 1.24 1.20
0
2
4
6
8
10
0
compact EFCaBPs
2
4
6
8
extended EFCaBPs
1.20 scalling exponent
scalling exponent
1.1 1.05 0.90 0.75 0.60
1.0 0.9 0.8 0.7
0
2
4
6
8
compact EFCaBPs
10
0
2
4
6
8
extended EFCaBPs
Fig. 5 – The values of the spectral coefficient and the scaling exponent obtained for the secondary structural data of EFCaBPs.
These values reveal long-range correlation in the secondary structure motifs in the spatial arrangement of EFCabPs and there is not a distinct behavior for extended and compact EFCaBPs. It suggests that, despite the dissimilar spatial arrangement of extended and compact EFCaBPs, in terms of structural motifs these proteins display similar characteristics and this observation is in good correlation with known data concerning similar biological functions of conserved structural motifs in EFCaBPs.
1110
Dana Craciun, Adriana Isvoran
8
4. CONCLUSIONS
This study illustrates long-range correlation in the secondary structure motifs arrangement of EFCaBPs structures with no distinctive comportment for extended and compact EFCaBPs and in good agreement with their known structural features correlated to biological functions. In our knowledge, it is a first study revealing the long-range correlation of the secondary structure motifs in proteins. This result is in good agreement with published data concerning long-range correlations in the physico-chemical properties of amino acids in the protein sequences [6–9] and also with the fractal properties of the proteins backbones [10, 11]. Moreover, it illustrates the motifs interrelationships and the importance of taking into account the specific motif interactions in protein modeling. Not at last, this study reveals once again the applicability of the non-linear methods for studying the structure-function relationship in proteins. REFERENCES 1. A. Lewit-Bentley, S. Rety, EF-hand calcium-binding proteins, Curr. Opin. Struct. Biol. 10, 637–643 (2000). 2. E. Carafoli, The calcium-signalling saga: tap water and protein crystals, Mol. Cell Biol., 4, 327–332 (2003). 3. A.C. Camproux, R. Gautier, P. Tuffery, A hidden Markov model derivated structural alphabet for proteins, J. Mol. Biol., 339, 561–605 (2004). 4. L. Regad, A. Saladin, J. Maupetit, C. Geneix, A.C. Camproux, SA-Mot: a web server for the identification of motifs of interest extracted from protein loops, Nucl. Acids Res., 39, W203– W209 (2011). 5. D. Kihara, The effect of long-range interactions on the secondary structure formation of proteins, Protein Science 14, 1955–1963 (2005). 6. J. Chen, N.S. Chaudhari, Statistical Analysis of Long-Range Interactions in Proteins, Proceedings of the 2006 International Conference on Bioinformatics & Computational Biology, BIOCOMP'06, Las Vegas, USA, 296–302 (2006). 7. M.I. Sadowski, D.T. Jones, The sequence–structure relationship and protein function prediction, Curr. Opin. Struct. Biol. 19 (3), 357–362 (2009). 8. D. Craciun, A. Isvoran, N.M. Avram, Long range correlation of hydrophylicity and flexibility along the calcium binding proteins chains, Physica A 388 (21), 4609–4618 (2009). 9. L. Pitulice, A. Isvoran, A. Chiriac, Structural features of proteins as reflected by statistical scaling laws, J. Serb. Chem. Soc. 73 (8–9), 805–813 (2008). 10. A. Isvoran, L. Pitulice, C.T. Craescu, A. Chiriac, Fractal aspects of calcium binding proteins, Chaos Solitons&Fractals 35, 960–966 (2008). 11. L. Pitulice, A. Isvoran, C.T. Craescu, A. Chiriac, Scaling properties of the radius of gyration and surface area for EF-hand calcium binding proteins, Chaos Solitons&Fractals 40, 684–690 (2009).
9
Correlation in the EF-hand calcium binding proteins
1111
12. The UniProt Consortium, Activities at the Universal Protein Resource (UniProt), Nucleic Acids Res. 42, D191–D198 (2014). 13. H.M. Berman, J. Westbrook, Z. Feng, G. Gilliland, T.N. Bhat, H. Weissig, I.N. Shindyalov, P.E. Bourne, The Protein Data Bank. Nucleic Acids Res., 28, 235–242 (2000). 14. D. Craciun, A. Isvoran, Computational analysis of surface properties of EF-hand calcium binding proteins, Rom. Journ. Phys. 59 (3–4), 339–345 (2014). 15. E.F. Pettersen, T.D. Goddard, C.C. Huang, G.S. Couch, D.M. Greenblatt, E.C. Meng, T.E. Ferrin, UCSF Chimera – A visualization system for exploratory research and analysis, J. Comput. Chem. 25, 1605–1612 (2004). 16. P. Szendro, G. Vincze, A. Szasz, Pink-noise behavior of biosystems, Eur. Biophys. J. 30, 227– 231 (2001). 17. C.K. Peng, S.V. Buldyrev, S. Havlin, M. Simons, H.E. Stanley, A.L. Goldberger, Mosaic organization of DNA nucleotides, Phys. Rev. E 49, 1685–1689 (1994). 18. V.V. Morariu, A. Coza, Nonlinear properties of the atomic vibrations in protein backbones, Physica A 320, 461–474 (2003). 19. A. Isvoran, L. Unipan, D. Craciun, V.V. Morariu, Analysis of long range correlation in sequences data of proteins, J. Serb. Chem. Soc. 72(4), 383–392 (2007). 20. Y. Zu-Guo, B. Wang, A time series model of CDS sequences in complete genome, Chaos Solitons&Fractals 12(3) 519–526 (2001).