Pulse Voltage in Vacuum. Wen-Bin Zhao, Guan-Jun Zhang, Yun Yang and Zhang Yan. State Key Laboratory of Electrical Insulation and Power Equipment.
170
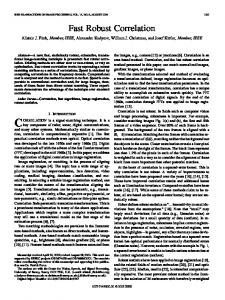
W.-B. Zhao et al.: Correlation between Trapping Parameters and Surface Insulation Strength of Solid Dielectric
Correlation between Trapping Parameters and Surface Insulation Strength of Solid Dielectric under Pulse Voltage in Vacuum Wen-Bin Zhao, Guan-Jun Zhang, Yun Yang and Zhang Yan State Key Laboratory of Electrical Insulation and Power Equipment School of Electrical Engineering, Xi’an Jiaotong University Xi’an, Shaanxi 710049, China
ABSTRACT As well known, the surface conditions of solid materials strongly affect the flashover phenomena under high electric field. The artificial doping ingredients could change the energy distribution and the density of electron and hole traps. The trapping parameters in the surface layer have some influences on the surface insulation strength. In order to adjust different trapping parameters, the composite materials of epoxy resin intermingled with aluminum hydroxide are prepared. The trapping parameters of the samples with different filler concentrations are investigated through the method of measuring the surface potential based on the isothermal current theory. The surface insulation performance in vacuum of each sample is tested according to the flashover voltage under pulsed excitation. Based on the experiment, the correlation between the trapping parameters and surface insulation strength is discussed and some novel models are presented. Index Terms — Trapping parameter, surface potential, flashover, pulsed voltage, epoxy resin, aluminum hydroxide
1 INTRODUCTION SURFACE flashover in vacuum is a primary limitation to electrical and electronic systems, as it typically takes place on the surface region of an insulating material at applied electric stress much lower than the bulk breakdown strength of the material [1]. On the other hand, surface discharge switches are also used in many systems [2]. The flashover phenomena have been interesting topics among many researchers for more than half a century. However, the phenomena are so complicated and influenced by many factors, and up to now the underlying mechanism is still not understood clearly. Former researchers have studied multiple factors such as the applied waveform [3], the included angle between electrode and the surface [4-7], the elements of desorbed gas [8], the kinds of material [8, 9], the surface roughness [10-12], the temperature, the gas pressure, the electrical pre-stress and so on. These contributions have been well reviewed in detail [13]. Recently, our research works has been concentrated on the relationship between flashover and surface conditions of insulating materials. Some experimental results have revealed that, under low electric field, prior to field electron emission from the cathode triple junction of a planar metal-aluminametal structure, electroluminescence phenomena occur due to Manuscript received on 13 October 2005, in final form 27 May 2006.
the radiative recombination of electrons and holes injected into the surface states from the electrodes [14, 15]. There were some different optical phenomena detected from the surface of alumina and polytetrafluoroethylene (PTFE) under dc voltage application, and we attributed the preflashover phenomena to the differences between the surfaces of the two kinds of insulating materials [16]. According to the results, the phenomena mentioned above may be all related to the trapping parameters in the surface layer of a material. Following the work, the trapping parameters of multiple kinds of polymer films were measured [17]. Since the surface elements of an insulating material strongly affect its flashover characteristics, about twenty years ago some researchers carried out much work to improve the surface insulation strength of alumina ceramic by doping some other metal oxides [18, 19]. Now, more and more kinds of composite insulating material are developed to meet the more rigorous request of high field, strong mechanical stress and extreme temperature, etc. At the interface region between the fillers and the matrix, many trap centers are formed [20]. While the composite material is stimulated by electric field, charges would accumulate near the interface. The amounts of fillers would change the trap distribution and also affect the charge accumulation. This provides a method to explore the influence of trapping parameters on surface insulation performance.
1070-9878/07/$25.00 © 2007 IEEE
IEEE Transactions on Dielectrics and Electrical Insulation
Vol. 14, No. 1; February 2007
171
Aluminum hydroxide (Al(OH)3) was employed as a flameresistant filler of epoxy resin about five decades ago, and it has an alias of alumina trihydrate (ATH). In this paper, for epoxy resin samples filled with ATH in different weight concentrations, we investigate its trapping parameters based on the isothermal relaxation current (IRC) theory [21] according to the surface potential decay measurement. The flashover voltage of each sample is also acquired under pulsed excitation in vacuum. The relationship between the trap density distribution and the flashover voltage is discussed.
2 SAMPLES AND EXPERIMENTAL ARRANGEMENT 2.1 SAMPLES The epoxy resin used in the experiment is an aromatic WSR618 (diglycidyl ether of bisphenol-A) cured by WSRH023 (a curing agent with two amino group), as shown in Figure 1a and Figure 1b, respectively. Figure 1c gives the main curing reaction.
Figure 2. Surface pattern of epoxy resin samples with different weight proportions of (a) no filler (b) 10% (c) 20% (d) 30% (e) 40% (f) 50% and (g) 60%.
Table 1 shows the basic electrical parameters of different samples. These results are measured via an electrometer (KEITHLEY 6517) and a high voltage bridge (QS37). Figure 1. Molecular formulae and partial curing reaction (a) epoxy resin (b) curing agent and (c) curing reaction
During the curing process, the amino reacts with epoxy group continuously, and most of linear epoxy molecules are linked with the curing agent, finally producing a spacial network structure. ATH powder (with an average diameter of 2 to 3 µm) is used as the filler with 6 kinds of different weight proportion. Typically, a mixture of epoxy, curing agent, dilution agent and ATH powder preprocessed is placed in a stainless steel vacuum agitator, heated to 50 to 70 °C and kept in 100 Pa pressure. After being agitated for ~50 min, the mixture is poured into the mold with releasing agent coated. The final curing process is performed over 80 °C for ~3 hours. All samples cured are polished with chromium oxide grinding powders, cleared in a supersonic cleaner and dried prior to the experiment. The surface pattern of each sample with different weight percentages is observed and obtained by scanning electronic microscope (SEM, Philips XL-20), as shown in Figure 2.
Table 1. Typical dielectric properties of different samples. Surface Volume ATH Thickness (L) Resistivity (ρs) Resistivity (ρv) (wt%) (mm) (Ω) (Ω·cm) 0 1.077 3.07×10¹⁶ 8.60×10¹⁶ 10 2.296 7.70×10¹⁵ 1.40×10¹⁶ 15 20 1.301 4.20×10 4.60×10¹⁵ 15 30 1.087 3.50×10 3.10×10¹⁵ 40 1.521 4.20×10¹⁴ 3.40×10¹⁵ 14 50 1.613 8.90×10 2.10×10¹⁵ 13 60 2.307 6.40×10 1.70×10¹⁵
εr 2.34 4.01 3.95 3.92 4.66 4.30 4.68
2.2 EXPERIMENTAL SETUP The arrangement for studying the surface potential decay of corona-charged samples is depicted in Figure 3. Each epoxy slice is firmly stuck to an earthed stainless steel plate electrode with one side via conductive silica grease, and the other side is faced to multiple needle electrodes with a distance of ~2 mm. A DC voltage of +/-1.5 kV is applied to the needle-plate electrode for positively and negatively charging, respectively.
172
W.-B. Zhao et al.: Correlation between Trapping Parameters and Surface Insulation Strength of Solid Dielectric
After each sample is charged for ~2 min, all needle electrodes are cleared and two sides of the sample are shortcircuited for ~1 min to remove surface free charges. Then the brace is quickly rotated to make the vibration capacitive probe be above the charged area on the sample surface. The probe is connected to a surface potential meter (Kawaguchi S2001A). Its analog output signal is fed into an amplifier & A/D module and then to a PC. Thus the surface potential is measured and continuously recorded with a sampling rate of 0.2 Hz. Since the potential decay is sensitive to the experimental conditions such as the ambient temperature, the relative humidity and the charging duration, the experiments are carried out in a sealed chamber, in which the humidity and temperature can be monitored and kept invariable for a long time. All measurements are accomplished at ~15 °C and 30% relative humidity.
Figure 5. Experimental circuit and voltage waveform (a) experimental circuit and (b) typical voltage waveform while no load.
3 THEORY ANALYSIS Figure 3. Experimental setup used for dc corona and surface potential measurement.
Flashover experiments are performed in a light-tight vacuum chamber with a vacuum level sustained at ~3×10⁻⁴ Pa. Each sample is placed on an organic glass substrate plate, and two circular cone stainless steel electrodes with a diameter of 20 mm are butted on it with a gap spacing of 5 mm. as shown in Figure 4. The electric field distribution of similar shape electrodes has been analyzed in [22].
3.1 CORONA CHARGING AND DECAY OF SURFACE POTENTIAL Reference [23] elucidated the process of corona charging in detail. While a voltage above certain high level is applied on the needle electrode, the air will be ionized and abundant charges concentrate around the point, which could form ionization region as can been seen in Figure 6. The electric field will drift the charges to hit the surface of sample, and then charges could enter the surface layer of the material, even into its inside. It is noticed that, only a fixed range within a radius of R would be significantly charged, leading to a nonuniform surface potential distribution.
Figure 4. Electrode-sample configuration.
A one-stage Marx generator is constructed with a waveform of ~0.4/2.5 μs while no load, as described in Figure 5a and Figure 5b, respectively. One electrode butted to the sample is connected to the generator output and the other to the ground through a 25.6 mΩ current viewing resistor (CVR). The applied voltage is recorded by a 4-channel digital oscilloscope (Tektronix TDS3014, 100 MHz bandwidth, 1.0 GSa/s sampling rate) through a HV probe (Tektronix P6015A, 1000:1 voltage dividing ratio, 75 MHz bandwidth), and the current is measured via the CVR.
Figure 6. Corona charging process of a specimen.
Figure 7 gives the space charge distribution inside a sample after the sample has been charged. This is a 2-dimension diagrammatic sketch along the normal direction and the surface of a sample. Considering the situation of negatively charging, electrons are injected into the upper free surface,
IEEE Transactions on Dielectrics and Electrical Insulation
Vol. 14, No. 1; February 2007
which forms the negative potential. Former researchers’ experimental results proved that the injected charges are hold in its surface layer with a thickness of δ (1~2 μm) [24, 25]. The value of negative surface potential is mainly dominated by the density of the trapped electrons near to the free surface layer [17], as shown in Figure 7, the higher surface potential can be derived in the area with a larger density of trapped electrons.
173
volume density of traps at a certain energy level E; en is the probability per unit time of a trapped electron emitted to the conduction band from a trap level at energy E, which is quite dependent on the temperature T (the Kelvin scale), and t is the time. Defining a function Gn(E,t) as
Gn ( E , t ) = en ( E , T )e − en ( E ,T ) t
(2)
Thus the current induced by trapped electrons is given by
Jn =
Ec 1 qL ∫ f 0 ( E ) N ( E )Gn ( E , t ) dE Ei 2
(3)
In equation (3), Gn determines the weighted contribution of any electron-emitting level to the current Jn at certain instant. If the Gn(E,t) is plotted as a function of energy for various values of t, the curves will be asymmetrical bell-shaped curve with a maximum at E=Em and a half-width of 3kT. Em is obtained from the condition as
Figure 7. Space charge distribution trapped inside an insulating material in charging equilibrium.
After removing the voltage excitation, the transporting behaviors of the trapped charges involve three main ways. The trapped charges will drift towards the opposite side driven by the self-inflicted electric field and diffuse along the negative gradient of the density of trapped charges. The trapped electrons in the upper free surface layer tend to escape out and recombine with the positive charges in air. 3.2 MEASURING THE DENSITY OF TRAPPING CENTERS According to Table 1, considering a typical sample (with volume resistivity ρv=3.40×10¹⁵ Ω·cm and relative permittivity εr=4.0) in an open-circuit configuration with one surface contacted to a grounded plane and the other free, the relaxation time dominated by the inner transport could be approximated according to τ=ρvεrε0 by the resistor-capacitor model. Here, the estimated decay time is much larger than the experimental value, implying that the charges transport mainly in the surface layer and the inner transport could be neglected. Based on the analysis, the method for measuring trap energy distribution according to the isothermal current theory proposed by Simmons [21] is applicable in our experiments. After the solid sample has been charged by the negative tip electrode, part of the traps above the equilibrium Fermi level Ef0 (electron traps) will be occupied by electrons. Those electrons emitted to the conduction band would be swept out of the solid, which induces a current Jn [21] under a constant temperature
Jn =
Ec 1 qL ∫ f 0 ( E ) N ( E ) en ( E , T ) e − e n ( E ,T ) t dE Ei 2
(1)
Where f0(E) is the initial occupancy of traps by electrons; N(E) is the energy distribution of the trap levels, i.e., the
∂G ∂E
=0
(4)
E = Em
Solving the partial differential equation, we can obtain the depth of electron trap Etn
Etn = Ec − Em = kT ln(γt )
(5)
Where k is the Boltzmann’s constant; γ is the frequency of the electrons oscillation. Gn(E,t) could be approximated by the δ function as (kT/t)δ(E-Em). Substituting the simplified Gn into the integration in equation (1), the current induced by detrapped electrons is given by
Jn =
qLkT f 0 ( E ) N ( Em ) 2t
(6)
Where q is the magnitude of the electron charge. Based on the analogy method for the traps of electrons and considering the sample charging with positive tips, the depth of hole trap Etp and the current Jp induced by detrapped holes is respectively given by
Etp = Em − Ev = kT ln(γt ) qLkT Jp = [1 − f 0 ( E )]N ( Em ) 2t
(7) (8)
Where Ev is the energy level of valence band; 1-f0(E) is the occupancy of traps according to the definition in [21]. If defining Et as (Em-Ev) or (Ec-Em) for positively or negatively charging conditions, we can yield an identical equation about the energy depth of the traps
Et = kT ln(γt )
(9)
The f0(E) has proved to be constant over the energy depth range [26]. If the initial occupancy rate f0(E) is assumed as 1/2, the current J induced by the electrons or holes can be given in
W.-B. Zhao et al.: Correlation between Trapping Parameters and Surface Insulation Strength of Solid Dielectric
174
the same form
J=
qLkT f 0 ( E ) N ( Em ) 2t
(10)
In fact, J is the current per unit cross-sectional area of the solid [27], and it is equal to the average current density Ja obtained by measuring the decay curve of surface potential. Ja is given by
Ja =
ε 0ε r d Vs (t ) L
dt
(11)
Where Vs(t) is the surface potential. Thus, the curve of N(Em)-Et demonstrates the energy distribution function that the volume density varies with the energy of the traps, which is derived from equation (9), (10) and (11) based on the data of the surface potential.
trap measurement is unlikely to implement under our experimental condition for taking so long time. But, it is indicated that the traps of the pure sample are of deeper energy level and higher density. For the same matrix material (epoxy resin), we can assume that samples with different filler concentrations have nearly the same energy gap Eg between the conduction band and the valance band. Therefore, they have approximately equal Fermi level Ef0. Given equation (5) and equation (7), the data of Figure 8 can be unified in Figure 9, which qualitatively demonstrates the energy range of the traps acquired in our experiment with different filler concentrations as a variable parameter.
4 EXPERIMENTAL RESULTS AND DISCUSSION 4.1 ENERGY DISTRIBUTION OF TRAPS After the sample has been charged with positive and negative tip respectively, Vs(t) is recorded for more than 20 hours. The differential of Vs(t) is calculated according to the data picked up from the raw series at an identical interval. The current density J is derived from equation (11). Substituting J into equation (9) and (10), and assuming γ=1012 s-1, the distributions N(Em) of electrons and holes are obtained respectively, as shown in Figure 8.
Figure 9. Energy Diagram of the samples with different weight proportion.
As well known, charge carriers are easy to be detrapped from the shallow traps, but difficult to escape from the deep traps. It is observed that the trap depth detected in this experiment is distributed within the range from ~0.84 to 1.03 eV. Because of the limitations of the experimental method and device, it is difficult to obtain a full energy distribution of traps. The traps at the deeper energy level can only be scanned, and this mainly reflects the status of chemical traps [28]. In contrast, the shallow traps are quickly detrapped and hard to be detected due to the relatively slow response time of probe system and the influence of ambient. On the other hand, much deeper traps are also hard to be measured, for the relatively low emission probability en(E,T) at a low room temperature [21]. Since the trapped charges mainly exist in the surface layer of the sample, the volume density of the traps detected in this paper is hereinafter regarded as the surface trap density. We define Net and Nht as the surface density of the electron and hole traps respectively. The energy depth of them is restricted within the range from 0.84 to 1 eV. Net and Nht is given by Figure 8. Trap energy distribution of epoxy samples with different filler proportions (a) electron traps (b) hole traps.
In particular explanatorily, for pure epoxy resin, its surface potential decays very slowly at the room temperature, so its
⎧ N = Ec − 0.84 N ( E )dE m m ⎪ et ∫Ec −1 ⎨ E v +1 N ( Em )dEm ⎪ N ht = ∫ E v + 0.84 ⎩
(12)
IEEE Transactions on Dielectrics and Electrical Insulation
Vol. 14, No. 1; February 2007
Substituting the definition of Et=Ec-Em=Em-Ev and assuming Ec and Ev as a constant, the Net and Nht could be written as
⎧N = Ec −( Ec −0.84) N (E )d (E − E ) = 1 N (E )dE m c t ∫0.84 m t ⎪ et ∫Ec −( Ec −1) ⎨ 1 Ev +1− Ev ⎪Nht = ∫ N (Em )d (Et + Ev ) = ∫ N (Em )dEt + 0 . 84 − 0 .84 E E v v ⎩
(13)
Thus, the surface trap density of electron and hole traps is obtained by calculating the digital integration of (13), as listed in Table 2. It is believed that the pure epoxy resin would show a much higher density of electron and hole traps. Table 2. Density of electron and hole traps in the surface layer. Filler concentration Density (×1019 m-3) (wt%) Electron traps Hole traps 10 10.74 7.37 20 7.14 1.24 30 2.65 3.28 40 4.75 8.65 50 5.30 3.48 60 8.32 4.24
4.2 PERFORMANCE OF FLASHOVER While increasing and decreasing the applied voltage step by step (10 times shots at every step), the surface insulation performance for each sample under pulsed stimulation is described by the curves in Figure 10.
175
occurs invariably, and the flashover takes place easily in spite of a decrease of the applied voltage. After the voltage drops to VR, the sample can withstand the surface shot without flashover. The surface insulation performance of all samples is summarized in Table 3. Table 3. Surface insulation performance of the samples. wt (%)
VL (kV)
VM (kV)
VR (kV)
0 10 20 30 40 50 60
25.8 20.7 18.3 17.6 24.1 24.0 22.6
25.8 23.9 20.2 18.8 27.2 28.1 22.6
10.8 12.2 11.3 13.4 15.4 13.9 16.7
4.3 RELATIONSHIP BETWEEN THE INSULATION PERFORMANCE AND SURFACE TRAPPING PARAMETERS In Figure 11, we describe the surface insulation performance of all samples by the 3 types of curves, VL, VM and VR at different filler concentrations. They reflect the trend of related voltages varying with the increase of the filler concentration. According to Table 2, the relationship between the surface trap density and the filler concentration is denoted by the values of Net, Nht and the sum of them.
Figure 10. Voltage and current curves under pulse voltage (a) Maximum applied voltage (b) Maximum current.
For the samples with different filler concentration, Figure 10a and 10b display the peak value of applied voltage and the maximum current in the same breakdown event, respectively. Every experimental point in Figure 10 is the average value of ten shots under almost the same voltage level. In this experiment, we define 3 characteristic values to indicate the surface insulating strength: the low-probability flashover voltage VL (