Accepted Manuscript Cortical and subcortical responses to biological motion Dorita H.F. Chang, Hiroshi Ban, Yuji Ikegaya, Ichiro Fujita, Nikolaus F. Troje PII:
S1053-8119(18)30208-8
DOI:
10.1016/j.neuroimage.2018.03.013
Reference:
YNIMG 14782
To appear in:
NeuroImage
Received Date: 13 October 2017 Revised Date:
28 February 2018
Accepted Date: 5 March 2018
Please cite this article as: Chang, D.H.F., Ban, H., Ikegaya, Y., Fujita, I., Troje, N.F., Cortical and subcortical responses to biological motion, NeuroImage (2018), doi: 10.1016/j.neuroimage.2018.03.013. This is a PDF file of an unedited manuscript that has been accepted for publication. As a service to our customers we are providing this early version of the manuscript. The manuscript will undergo copyediting, typesetting, and review of the resulting proof before it is published in its final form. Please note that during the production process errors may be discovered which could affect the content, and all legal disclaimers that apply to the journal pertain.
ACCEPTED MANUSCRIPT
Cortical and subcortical responses to biological motion Dorita H. F. Changa,*, Hiroshi Banb,c, Yuji Ikegayab,d, Ichiro Fujitab,c, Nikolaus F. Trojee
a
Department of Psychology, The University of Hong Kong, Hong Kong Center for Information and Neural Networks (CiNet), National Institute of Information and Communications Technology, Japan c Graduate School of Frontier Biosciences, Osaka University, Japan d Graduate School of Pharmaceutical Sciences, The University of Tokyo, Japan e Department of Psychology, Queen’s University, Canada
AC C
EP
Figures: 6 Supplementary Figures: 4
M AN U
Word Count Abstract: 109 Introduction: 1481 Methods: 2370 Results: 1096 Discussion: 2258
TE D
Submitted to: NeuroImage
SC
RI PT
b
* Corresponding Author Department of Psychology, The University of Hong Kong 6.07, The Jockey Club Tower, Centennial Campus
[email protected]
ACCEPTED MANUSCRIPT
Abstract
Using fMRI and multivariate analyses we sought to understand the neural representations of articulated body shape and local kinematics in biological motion. We show that in addition
RI PT
to a cortical network that includes areas identified previously for biological motion
perception, including the posterior superior temporal sulcus, inferior frontal gyrus, and ventral body areas, the ventral lateral nucleus, a presumably motoric thalamic area is
SC
sensitive to both form and kinematic information in biological motion. Our findings suggest that biological motion perception is not achieved as an end-point of segregated cortical form
system including a subcortical network.
M AN U
and motion networks as often suggested, but instead involves earlier parts in the visual
AC C
EP
TE D
Keywords. Visual perception, biological motion, life detector, fMRI
Page 2 of 36
ACCEPTED MANUSCRIPT
Introduction
The introduction of point-light motion displays (Johansson, 1973) has helped reveal the
RI PT
exceptional efficiency with which the human visual system can interpret animate (biological) motion devoid of other obvious contextual cues (e.g., the shape of the agent). Of course, form information is still readily available through the deformation of the motion pattern itself, and indeed observers use such global structure-from-motion information to interpret
SC
biological motion (Troje, 2002). It is clear now, however, that the global shape arising from
M AN U
deformation of the motion pattern is not the only cue available to the observer. Extensive behavioral data suggest that the visual system is also remarkably sensitive to local kinematic information, and particularly responds to the gravitational acceleration of the feet and the way they strike the ground (Beintema and Lappe, 2002; Troje and Westhoff, 2006; Chang and Troje, 2009). We refer to these two sources of information as “global” (structure from
TE D
motion) and “local” (kinematics of individual dots) cues.
EP
Neuroimaging, neurophysiology, and neurostimulation studies have identified a network of areas in the cortex that responds to biological motion. Relevant areas include ventral
AC C
extrastriate regions such as the posterior superior temporal sulcus (pSTS), posterior inferotemporal sulcus (pITS), fusiform gyrus, extrastriate and fusiform body areas (EBA, FBA), but also portions of the frontal and parietal cortex (Bonda et al., 1996; Grossman and Blake, 2002; Peuskens et al., 2005; Saygin et al., 2004; Peelen et al., 2006; Saygin, 2007; Jastorff and Orban, 2009; Grosbas et al., 2012; Thompson and Baccus, 2012; Van Kemenade et al., 2012). However, these studies have generally isolated the areas involved in the perception of biological motion by contrasting an intact walker with one that is spatially scrambled. This contrast addresses the effects of global structure on the neural responses Page 3 of 36
ACCEPTED MANUSCRIPT well, but since the kinematic information conveyed by the individual local dots are the same between the two stimuli, it is not appropriate to search for the neural representations of local cues. Studies thus far that have tried to tease apart the separate contributions of shape and kinematics have promisingly shown some dissociation in terms of the cortical networks
RI PT
involved. Notably, the dorsal cortex seems to be critical for the perception of kinematics, and the ventral stream critical for the perception of shape (with information from the two streams proposed to be integrated in the occipito-temporal cortex) (Casile and Giese, 2005;
SC
Thompson et al., 2004; Jastorff and Orban, 2009; Vangeneugden et al., 2014; Gilaie-Dotan et al., 2015). While the majority of these studies have reduced biological motion into point-
M AN U
light representations, these same regions are implicated in more naturalistic contexts. For example, videos and static images of bodies similarly elicit responses in ventral body areas EBA and FBA (O’Toole et al., 2014).
TE D
There is reason to believe that surveys of the brain regions relevant to biological motion perception would benefit from moving beyond the cortex, considering the roles of subcortical loci. The neural substrates underlying the perception of local kinematics, in particular, has
EP
garnered much intrigue as it is posited that the relevant mechanisms are phylogenetically
AC C
more primitive, and hence likely to involve older parts of the visual system (Troje and Westhoff, 2006; Johnson, 2006). In light of a growing body of developmental data showing that sensitivity to biological motion is present early in development (Fox and McDaniel, 1982; Bertenthal, 1996; Hirai and Hiraki, 2005; Méary et al., 2007; Reid et al., 2008), it would not be surprising if biological motion perception is governed in part by deeper structures such as the brainstem or thalamus. This line of thought is also strengthened by work in non-human species - newly hatched chicks - for orienting towards biological motion (Vallortigara et al,. 2005; Vallortigara and Regolin, 2006). These findings in chicks, which
Page 4 of 36
ACCEPTED MANUSCRIPT have very different brain organization as compared to primates, though they do have circuits elsewhere with functions homologous to those governed by the mammalian six-layer cortex (Wang et al., 2010), should challenge our traditional understanding that high-order
RI PT
“biological motion” perception in humans is solely reliant on the cortex.
While the thalamus has been long-considered as a sensory relay center, an increasing body of literature is indicating a regulatory role for this region, contributing to wide-ranging aspects
SC
of cognition. For example, it has been shown that fMRI responses in the human lateral
geniculate nucleus can be modulated by actively directing subjects to attend to or ignore a
M AN U
stimulus (O’Connor et al., 2002). Attentional modulations of single-unit responses in the LGN have also been shown in the macaque (McAlonan et al., 2008). Moreover, lesions in the thalamus, and in particular of the pulvinar and mediodorsal nucleus, can result in attention and memory impairments (e.g., Baxter, 2013; Jankowski et al., 2013). Considered together,
TE D
these findings challenge traditional notions that attentional modulations are of sole cortical origin. Beyond attentional processes, thalamic nuclei have been implicated in other highorder functions including learning (Bradfield et al., 2013; Habib et al., 2013), language
EP
(Klostermann et al., 2013), and movement control (e.g., Prevosto and Sommer, 2013) –
AC C
extending to anticipations of perceptual consequences of ocular movements (Ostendorf et al., 2013). Hence, it would not be surprising if the thalamus, and potentially other subcortical centers may also be implicated in biological motion perception.
To our knowledge, only one study to date has implicated a non-cortical area (the cerebellum) in the processing of biological motion (Sokolov et al., 2012). These findings are particularly interesting at it has become increasingly clear that the cerebellum should no longer be considered a solely motor structure. For example, the cerebellum has been shown to be
Page 5 of 36
ACCEPTED MANUSCRIPT involved in language processing (e.g., Xiang et al., 2003), visuospatial reasoning (e.g., Bonda et al., 1995; Creem-Regehr et al., 2007), and executive functions (e.g., Tomasi et al., 2007). Whether additional subcortical components of the motor loop may be involved in a broader range of functions, including, of more immediate relevance, the perception of biological
RI PT
motion, is unclear.
Here, using whole-brain, high-resolution, multiband fMRI, along with a multivariate
SC
approach (multivoxel pattern analysis, MVPA), we aimed to achieve a survey of the cortical and subcortical areas for the perception of global structure-from-motion and local kinematic
M AN U
information in biological motion that may have been overlooked in traditional univariate approaches. We focus on global and local cues containing information about the intended walking direction of a stationary point-light walker. The facing-direction task has been used widely to show the importance of both form-related processes (Beintema and Lappe, 2002;
TE D
Miller and Saygin, 2013) and kinematics-related processes (Troje & Westhoff, 2006; Hirai et al., 2011) in biological motion perception. We introduced three main types of manipulations in order to isolate stimuli that contained solely global form from motion information, solely
EP
kinematics, or neither global form nor natural kinematics information. To isolate
AC C
representations of global structure-from-motion we generated novel walkers that carried the structure of an intact walker but no informative local cues as to walking direction (“globalonly” walkers). These stimuli were generated by replacing each local trajectory with the average of its original trajectory and its left/right mirror-flipped variants. While the overall spatial arrangement of the dots was preserved, this manipulation rendered individual local motions that were symmetric along the anterior-posterior axis, and critically carried no horizontal asymmetry. In order to create a stimulus that isolates local cues to facing direction, stimuli were deprived of structural cues to direction by taking the veridical walker
Page 6 of 36
ACCEPTED MANUSCRIPT (Troje, 2002) and randomly reallocating the positions of the individual dots along the horizontal dimension. We call this stimulus the “local-natural” walker. We then took this latter stimulus and modified it further in order to also deprive it from the acceleration patters that we had earlier shown to be the critical feature of the “life detector” (Chang and Troje,
RI PT
2009). This last type was achieved by both scrambling the horizontal positions of the
individual dots thereby destroying global structure, and manipulating kinematics such that the individual dots traveled along the original traces at constant speed (Chang and Troje, 2009).
SC
We call this stimulus the “local-modified” walker (see Methods for further details on the stimulus manipulations). The three types of walkers were presented both upright and upside-
M AN U
down. We included an ‘inversion’ manipulation to help validate any dissociations between structure-related and kinematics-related regions, in light of behavioural literature that have suggested very different sources underlie inversion-related perceptual impairments for the two types of stimuli. The source of the first inversion effect appears to be similar to that
TE D
observed in the face literature (Freire et al., 2000), relating to the inversion of the familiar body structure. The inversion effect observed with kinematics-only stimuli, however, appears to relate to the orientation of velocity gradients within the individual dot-motions,
EP
and specifically those of the feet, but is also curiously modulated by visual field position
AC C
(Chang et al., 2009; Hirai et al., 2011). Inclusion of the upside-down variants, thus probe for differential modulations of the relevant regions with inversion and may thereby help verify any dissociation between structure-related and kinematics-related regions.
Page 7 of 36
ACCEPTED MANUSCRIPT
Methods Participants. Nineteen observers (mean age of 26.4 years, 13 males) participated in this study. All had normal or corrected-to-normal vision, and provided written informed consent
RI PT
in line with ethical review and approval of the work by the ethics committee of the National Institute of Information and Communications Technology (NICT), Japan.
SC
Stimuli. Stimuli were point-light biological motion sequences based on motion capture data of an average walker computed from 50 men and 50 women, that can be represented as a
M AN U
simple fourier series characterizing the position of the each dot motion in three dimensions (Troje, 2002). Each walker in this particular experiment was represented by a set of 11 dots shown in sagittal view (facing either rightward or leftward) with a gait frequency of 0.93 Hz. Overall translation was subtracted. Dots were white (153.7 cd/m2) on a black background
TE D
(0.92 cd/m2).
The average walker in its original form contains both full structure from motion information (through the presence of the familiar body shape) and kinematic information (as carried by
EP
horizontal and vertical asymmetries, such as acceleration). In order to tease apart the contributions of these differing types of information, we did not present the walker in this
AC C
original form, but rather derived six variations of the stimulus, manipulating the presence or absence of structural organization (intact, or absent), the kinematic information contained in the individual local trajectories (veridical kinematics, mirror-symmetric motion, or perturbedconstant speed), and orientation (upright or inverted). As these manipulations cannot be neatly characterized in terms of a factorial-type design, we provide schematic samples of the stimuli (Figure 1a), as well as summarize the information contained in the stimulus in accordance with our stimulus labels, both in terms of global structure and local kinematics (Figure 1b). Page 8 of 36
ACCEPTED MANUSCRIPT [Figure 1 about here] Samples of the stimuli can also be viewed at http://changlab.hk/demo-bm. All demonstrations in the multimedia are right-facing.
RI PT
Global only walker. Our “global-only” walker was designed to convey structurefrom-motion information only, by rendering individual local trajectories (left-right) mirror-symmetric. This was achieved by first preserving the spatial layout of the dot
SC
trajectories (i.e., the mean position of each dot is retained in its original vertical and horizontal location). Critically, we then took each individual point-light motion and
M AN U
replaced its horizontal component by the average of the original trajectory and its left/right mirror-flipped variants. The resulting motion is perfectly symmetric about the horizontal axis. This is conveyed in Figure 1a (global walker and its inset) where we have provided the trace of one dot – that of the foot trajectory of our global
TE D
walker. This left/right symmetric motion can be contrasted with that of the natural walker (Figure 1a, local natural walker, inset), which, if in motion, retains strong horizontal asymmetric cues in one direction (i.e., left, in Fig. 1a). Consequently, in
EP
the Global walker, kinematic-based direction cues are now uninformative. If asked to
AC C
resolve the facing direction of such a stimulus, the observer can only rely on the deformation of the overall structure (from motion).Certainly, as this manipulation indeed provides distortions to the shape of the local trajectories themselves, one could argue that the overall structural deformation of the walker is also not entirely identical to that which would be carried by a veridical walker (although casual inspection of our interactive demo reveals that any distortions to global shape appear rather minimal).
Page 9 of 36
ACCEPTED MANUSCRIPT Local natural walker. Our “local natural” walker was designed to carry natural kinematic information, but no global structure information. This walker was achieved by starting with the original (average) walker and randomly shuffling the horizontal spatial positions of the dots. There were no manipulations to the local kinematics. As
RI PT
such, if asked to resolve the facing direction of this particular stimulus, the observer can rely on local kinematics, but not global structural deformations.
Local modified walker. Finally, a “local modified” walker was designed to carry
SC
neither structure-from-motion information, nor valid kinematic information. This walker was achieved by starting with the original (average) walker and, as for the
M AN U
“local natural” walker, randomly shuffling the horizontal spatial positions of the dots; however, we additionally perturbed local motion by forcing each individual dot to move with constant speed along its original trajectory. That speed was equal to the average speed of the corresponding dot-motion in the original walker (Chang and
TE D
Troje, 2009). This was achieved by interpolating each individual dot trajectory and computing linear arclength. Critically, this manipulation disrupts the natural velocity profile of the foot motion and in particular eliminates the vertical asymmetries caused
EP
by gravitational acceleration. This walker then contains neither global form
AC C
information nor the critical local invariants.
The three types of stimuli (global only, local natural, and local modified) were shown upright or inverted, rendering a total of six main stimulus variations. Importantly, an inverted “local natural” and “local modified” walker was generated by mirror-flipping each dot about its horizontal axis only. This retains the vertical order of the dots (i.e., feet dots were retained at the bottom of the display). An inverted “global only” walker carried a complete inversion of
Page 10 of 36
ACCEPTED MANUSCRIPT the shape and the local trajectories (which were themselves altered, as described above). For all stimuli, the starting phase (temporal position of the gait cycle) was randomly selected on each trial. For the two “local” stimuli, horizontal spatial shuffling was randomized on each
RI PT
trial.
Stimuli were presented on a PC (HP Z230SF). Graphics rendering was implemented by a nVidia Quadro K600 graphics card set to display 1024 x 768 pixels at 60 Hz. Stimuli were
SC
front-projected to a screen placed 90 cm from back of the bore using a LCD projector
(Cannon WUX4000) and viewed through a 45 deg tilted mirror mounted in front of the
M AN U
observer. Stimuli subtended visual angles of 2.9 x 6.4 deg.
Biological motion task. On each trial, participants were presented with a single point-light walker (500 ms) and asked to judge whether the walker appeared to be facing rightwards or
TE D
leftwards by responding with one of two buttons on the response box. Each trial was allotted a fixed inter-stimulus interval of 1500 ms, before it timed out and the subsequent trial was presented. A central fixation cross (0.5 x 0.5 deg in size) was presented for the full duration
AC C
EP
of each trial. Observers were asked to respond after stimulus offset.
fMRI acquisition. Imaging data for the participants were acquired at the NICT CiNet imaging facility (Suita, Osaka, Japan), using a 3-tesla Siemens Trio MR scanner with a 32channel, phase-array (whole) head coil for both localizer and experimental runs. Blood oxygen level–dependent signals were measured with an echo-planar sequence (Voxel size = 1.5 mm3, TR=2000ms, Flip angle = 70 deg, 78 slices with multiband (factor=3); 205 volumes where the first 5 were discarded to eliminate the effects of start-up transients). The MultiBand EPI sequence was provided by the University of Minnesota (under a C2P contract). For
Page 11 of 36
ACCEPTED MANUSCRIPT each participant, we additionally acquired a high-resolution (1 mm3) anatomical scan.
ROI definition. Regions-of-interest (ROIs) V1, V2, V3, V4, V3A, and V3B/KO were defined for each participant using standard phase-encoded retinotopic mapping procedures, mapping
RI PT
polar angle with a slowly rotating (clockwise or counterclockwise), checkerboard wedge stimulus (Sereno et al., 1995). We were able to identify V3B/KO (kinetic occipital) using this same phase-encoded map (Wandell et al., 2005; Ban et al., 2012), generally falling
SC
anterior to V3A, inferior to V7 (Dupont, 1997) and posterior to the human motion complex (hMT+/V5). We subsequently identified hMT+/V5 in each participant using a separate
M AN U
functional localizer (single-run), defining it as the region that responded significantly higher (p < 0.01) when responses to blocks of static dot field presentations were contrasted with responses to blocks that presented moving dots that traveled toward and away from fixation (Huk et al., 2002). We included four additional extrastriate regions that have been previously
TE D
implicated for biological motion perception. Each was defined as a spherical ROI (5 mm rad.) centered on Talairach coordinates of: [+/- 36, 10, 28] for the inferior frontal gyrus (IFG) (Saygin et al., 2004; Saygin, 2007), [+/- 57, +/-45, 10] for the posterior superior temporal
EP
sulcus (pSTS) (Sunaert et al., 1999), [left -45, -74, 1; right 48, -70, 1] for the extrastriate body
AC C
area (EBA) (Peelen et al., 2006; Jastorff and Orban, 2009), as well as [left 36, -39, -19; right 41, -45, -19] for the fusiform body area (FBA) (Peelen et al., 2006; Jastorff and Orban, 2009). We note that due to the proximity of the human motion complex hMT+ with EBA, overlapping voxels of the two regions, if any, were removed from both ROIs in each subject. Finally, VLN was identified post-hoc anatomically as an ROI defined by the Talairach atlas (Talairach et al. 1988). As this thalamic sub-area has no distinctive physical characteristic that can allow it to be identified visually in individual subjects through visual inspection, and has no known reliable functional localizers, we opted to use this common ROI across all
Page 12 of 36
ACCEPTED MANUSCRIPT subjects. The VLN, identified in this manner had coordinates of [-15, -10, 9.9] and a volume of 573 mm3 for the left hemisphere, and coordinates of [13, -10, 10] along with a volume of 572 mm3 for the right hemisphere.
RI PT
Design and procedures. fMRI runs were arranged in a block-design with each block lasting 16 seconds. One particular scan run included five main block types comprising four stimulus condition blocks (e.g., global) and a fixation block. Each stimulus condition block was
SC
repeated 3 times within a particular run, and were interleaved by fixation blocks. Block order was randomized. Individual condition blocks consisted of 8 trials of a particular stimulus
M AN U
condition where the number of left and right-facing walkers were balanced within the block. Therefore, one particular run included 24 trials of a particular condition, and a total of 96 experimental trials. Due to the large number of conditions, stimulus conditions were scanned across two run types. Conditions global (upright), global (inverted), local natural (upright),
TE D
and local natural (inverted) were acquired in Run type 1. Conditions local modified (upright), local modified (inverted) were acquired simultaneously with local natural (upright), and local natural (inverted) in Run type 2. Both run types were scanned in the same day
EP
(total session duration of 1.5 hours), with the order of the run types within a session
AC C
counterbalanced. These experimental scans were acquired on a separate day from the localizer scans. Participants completed a minimum of 8 total runs (4 scan runs per run type) yielding 96 trials per stimulus type (i.e., 12 “blocks” of trials). Each run lasted 6.8 minutes.
fMRI data analysis. fMRI data were analyzed with BrainVoyager QX (BrainInnovation B.V.). For each participant, we transformed anatomical data into Talairach space. Functional data were preprocessed using three dimensional motion correction, slice time correction, linear trend removal and high-pass filtering (3 cycles/run).
Page 13 of 36
ACCEPTED MANUSCRIPT
Data were subsequently analyzed both in terms of their univariate activity (GLM), and multivariate patterns (multivoxel pattern analysis, MVPA). GLM analyses included regressors for each experimental condition, and six motion regressors (three translation
RI PT
parameters; in millimeters) and three rotation parameters (pitch, roll, yaw; in degrees) defined as square-wave regressors for each stimulus presentation block convolved with a gamma function to approximate the idealized haemodynamic response. The time course signal of
SC
each voxel was then modelled as a linear combination of the different regressors (leastsquares fits) and the regressor coefficients were used for contrasts of the different
M AN U
experimental conditions. Contrasts were performed after combining the two different run types, and included: For each stimulus orientation (upright and inverted), we contrasted Global vs local natural (to elucidate form based representations) stimuli, and local natural vs local modified stimuli (to elucidate kinematic based representations). We additionally
TE D
contrasted responses of the two orientations within each stimulus type (e.g., Global upright vs Global inverted). Whole-brain, group-level responses were analysed using GLM randomeffects analyses.
EP
For the multivariate classifications, we chose to use a linear SVM classifier (libSVM) (Chang
AC C
and Lin, 2011) together with a multivariate feature selection algorithm, Recursive Feature Elimination (RFE) to estimate spatial patterns (De Martino et al., 2008). The RFE eliminated the necessity of selecting a somewhat arbitrary fixed number of voxels per ROI, and instead offered estimates based on voxel subsets with the best performance within each ROI. Briefly, for this analysis, all voxels and their time courses were first converted to Z scores and shifted in time (4 s) to account for the hemodynamic response. This shift corresponds to the typical peak of the BOLD response function (Serences, 2004). We then took 80% of the training data set to compute SVM weights. Note that the sampling of data for training was done
Page 14 of 36
ACCEPTED MANUSCRIPT while retaining blocks in their entirety (i.e., no blocks were partitioned). The selection of the data set (and computation of SVM weights) were repeated 20 times within a particular RFE step (i.e., each voxel had 20 sampled weights, which were subsequently averaged). Following each step, we then ordered voxels based on their (step-averaged) weight from the
RI PT
highest to the lowest. Using these weights, we omitted the 5 most uninformative voxels, and used the rest to decode the test patterns. This yielded an accuracy at the current voxel
count/pattern. This process was repeated until voxel count fell below 50. For each ROI,
SC
based on the maximum mean accuracy (across all cross-validations) across all RFE steps, we retrieved the final voxel pattern with which to compare the accuracies of the different cross
M AN U
validations. Mean prediction accuracies were tested against chance level (0.54), which was determined via permutation tests for the data (i.e., by running 1,000 SVMs with shuffled labels).
TE D
As noted earlier, due to the large number of conditions in each experiment, conditions were scanned across two different run types. This resulted in an unbalanced training data set that was corrected via the Synthetic Minority Over-sampling Technique (SMOTE) algorithm
AC C
EP
(Chawla et al., 2002).
Behavioral data analysis. Behavioral performances were quantified in terms of the proportion of correct discrimination responses. As response input on each trial was not permitted until after stimulus offset, reaction time data were not considered informative and not analysed. Discrimination accuracies were analyzed with a repeated-measures analysis of variance (ANOVA) comparing orientation (upright/inverted) and walker type (global only, local natural, local modified). Data satisfied parametric assumptions, and any variance
Page 15 of 36
ACCEPTED MANUSCRIPT (sphericity) violations were addressed with Greenhouse-Geisser corrections. Follow-up posthoc comparisons were conducted by means of Bonferroni-corrected t tests (two-tailed).
RI PT
Results Behavioral discriminations. Behavioral performance, quantified in terms of proportion of corrected responses, were computed for each walker condition at the two orientations and are
SC
presented in Figure 2. These accuracies were entered in a 2 (orientation) x 3 (condition) repeated-measures ANOVA that indicated performance was higher when the walkers were
M AN U
displayed upright rather than inverted (main effect of orientation, F(1,18) = 103.8, p < .001, η2= .85), and varied according to walker condition (main effect of condition, F(2, 36) = 16.7, p < .001, η2= .48). Follow-up Bonferonni-adjusted t tests indicated that performance was highest for the global condition than for the two local conditions (t(18) = 3.04, p =.021 for
TE D
global versus local natural; t(18) = 4.65, p = .001 for global versus local modified). Performance for the local natural stimuli was also generally better than that for the local modified stimuli, t(18) = 7.08, p < .001. Performance changes with stimulus inversion,
EP
however, depended on the type of stimulus (stimulus by orientation interaction, F(2, 36) = 8.23, p = .001, η2= .43). Specifically, inversion resulted in a significant performance
AC C
decrease for the local natural stimuli, t(18) = 11.8, p < .001, local modified stimuli, t(18) = 10.5, p < .001, but only marginally for the global walkers, t(18) = 1.9, p = .07.
[Figure 2 about here]
fMRI: Cortex. We first present the univariate (GLM) responses to our stimuli, in terms of the beta weights (% signal change) across our group of ROIs in Figure 3, separately for the upright stimuli (upper panel) and inverted stimuli (bottom panel). We also present a sample Page 16 of 36
ACCEPTED MANUSCRIPT map from the group-level whole-brain random-effects GLM analysis, contrasting the local natural versus local modified stimulus (Figure 4). An initial comparison of the ROI-based analyses and the whole-brain maps indicated that our choice of ROIs adequately represented much of the univariate responses to our stimuli, with strong responses in retinotopic (V1-V4),
RI PT
and extrastriate areas – notably along the posterior STS, IFG, and EBA.
An examination of the beta weights revealed that signals were generally strongest for hMT+ as compared to all other cortical ROIs, and highest for the local natural stimuli as compared
SC
to the other two walker types. These observations were confirmed by a 3 (condition) x 2 (orientation) x 12 (ROI) repeated-measures ANOVA that indicated a significant main effect
M AN U
of condition, F(2, 36) = 6.4, p = .004, η2= .26, and a significant main effect of ROI, F(3.9, 71.6) = 7.8, p < .001, η2= .30. Post-hoc Bonferonni-corrected t-tests confirmed that weights for the global stimuli were significantly lower than those of the local natural stimuli, t(18) = 2.9, p = .009, but not different from those of the local modified stimuli, t(18) = .14, p =.88.
TE D
Additional follow-up comparisons for the main effect of ROI confirmed that overall, the signals were higher for hMT+ than for all other ROIs (all comparisons involving hMT+, ps < .03). Additionally, while signals for V3b and EBA were significantly lower than that of
EP
hMT+, they were higher than those of all remaining ROIs (ps < .03). The ANOVA also indicated a significant interaction between condition and ROI, F(6.1, 110.4) = 3.2, p = .005,
AC C
η2= .15. We interpreted this interaction with follow-up Bonferonni-corrected one-way ANOVAs for each condition (walker) type. The analyses indicated that the pattern of responses across ROIs were slightly different for the local modified stimulus as compared to the global and local natural stimuli. In particular for the global and local natural stimuli, responses for V3b were different from those of hMT+, IFG, and VLN (all ps < .03) while for the local modified stimulus, V3b responses did not differ from IFG (p > .9).
Page 17 of 36
ACCEPTED MANUSCRIPT [Figures 3 and 4 about here]
MVPA classification accuracies for discriminating stimuli containing global shape-frommotion and local kinematic information (global vs. local natural walker) are presented in
RI PT
Figure 5a (open bars). The classification accuracies of all ROIs were tested with t-tests against a baseline of 0.54 (see Methods), using False Discovery Rate (FDR) corrected
thresholds that hold FDR < .05. Accuracies were well above-baseline in early retinotopic
SC
(V1-V4) and higher order areas including hMT+, EBA, FBA, IFG, and pSTS. These same areas had above-baseline classification accuracies for discriminating between intact and
M AN U
perturbed local kinematics (local natural vs. local modified) (Fig. 5a, filled bars, accuracies above shuffled-baseline, FDR < 0.05). Differences among the walker types emerge when considering discriminations between upright and inverted stimuli. For global shape, a number of regions including early visual cortex, and hMT+ can well discriminate between the
TE D
two orientations; however, classification accuracies for discriminating upright versus inverted stimuli for local natural and local modified stimuli, did not differ from baseline for all ROIs
[Figure 5 about here]
AC C
EP
(Fig. 5b).
fMRI: Ventral Lateral Nucleus (VLN). An examination of the univariate (General Linear Model) responses in subcortical regions revealed a thalamic area, specifically the left ventral lateral nucleus (VLN) that was involved in all contrasts including both those comparing global shape and local kinematics, as well as comparing local kinematics intact and perturbed (Fig. 6a, overlaid outlines).
Page 18 of 36
ACCEPTED MANUSCRIPT [Figure 6 about here]
We subsequently ran ROI-based SVM classifications on the VLN, as identified for all subjects by probabilistic and Talairach atlases. Accuracies for discriminating between global
RI PT
structure and local kinematics, as well as between the two local stimuli were well above chance in the VLN (Fig. 6b; see also Supplementary Figures S2 & S3 for lateralized
analyses indicating above-chance classification performance independently in both the
SC
right and left VLN). This was confirmed by t-tests of the accuracies against the baseline of 0.54, corrected (thresholded) to hold FDR < .05 (t(18) = 5.5, p < .001 for global versus local
M AN U
natural; t(18) = 6.9, p < .001 for local natural versus local modified). It is interesting to note that the VLN is however insensitive to both orientation of global structure and local kinematics (Fig. 6c). This is in contrast to above chance-level accuracies for discriminating global structure from local kinematics observed in the cortex (Fig. 5b), but congruent with
TE D
the poor discrimination accuracies in these same regions when contrasting orientations of natural and modified kinematics.
EP
Finally, we conducted further analyses examining classification performance separately for
AC C
the left and right hemispheres across all cortical ROIs (and VLN). The results are presented in Supplementary Figure S1 (left hemisphere) and Figure S2 (right hemisphere). Classification accuracies were entered in a 2 (hemisphere) x 5 (classification) x 12 (ROI) repeated-measures ANOVA. The analysis revealed that performance was comparable between both hemispheres (no significant main effect of hemisphere, F(1, 18) = .06, p = 0.80; no significant interactions involving hemisphere).
Discussion Page 19 of 36
ACCEPTED MANUSCRIPT We used carefully designed stimuli that contained solely biological form (global only stimulus), solely biological kinematics (local natural stimulus), and neither form nor kinematics information (local modified stimulus) in order to survey the neural representations
RI PT
of biological motion in cortex and subcortical structures.
While results from analyses of univariate responses revealed rather homogenous activity across conditions, consideration of multivariate patterns is more revealing. We found a
SC
striking capacity of cortical regions for discriminating stimuli containing global and local information. Global shape-from-motion and local kinematic information (global vs. local
M AN U
natural walker) can be distinguished in early retinotopic areas (V1-V4) and higher order areas including EBA, FBA, IFG and STS – areas implicated previously for biological motion perception. This same broad network can also discriminate between intact and perturbed local kinematics (local natural vs. local modified). The ability of the STS to discriminate
TE D
both global and local cues is surprising, given the relatively weak univariate signals this region produces when presented with walking (rather than action-type) stimuli (see also Jastorff and Orban, 2009); still, strong prediction accuracies can be observed in this region
EP
(and across cortex) (i.e., global versus local natural, local natural versus modified, global
AC C
versus local modified).
Intriguingly, results from both our GLM and MVPA analyses indicated a cluster outside of cortex - in a region identified as the ventral lateral nucleus that was responsive to our stimuli. The VLN holds extensive projections to the motor and premotor cortex (Kievit and Kuypers, 1975; Shinoda et al., 1993) and receives considerable afferents from the cerebellum (dentate nucleus) and the globus pallidus (Carpenter and Strominger, 1967). As such, the VLN is classically thought to act as a major relay for motor planning and coordination (e.g.,
Page 20 of 36
ACCEPTED MANUSCRIPT Daskalakis et al,. 2004), and is hence usually designated as part of the motor thalamus. Projection targets from the VLN, however, are not limited to motor cortex, but also include frontal and parietal associative cortex (e.g., Kievit & Kuypers, 1977; Wiesendanger & Wiesendanger, 1985a, b; Morel et al., 2005; Prevosto et al., 2010). In fact, the many cortical
RI PT
areas (i.e., prefrontal, frontal, parietal cortices) that provide input to the cerebellum also conversely receive cerebello-thalamo-cortical projections (Ramnani, 2012). Hence, the
motor division of the thalamus, including in particular the VLN certainly has the circuitry to
SC
support higher-order functions. Indeed, several studies have suggested that the regions of the motor thalamus that receive cerebellar input (such as the ventral lateral complex) in fact
M AN U
contribute to executive control functions of the frontal lobe (Ide & Li, 2011; van der Salm et al., 2013). For example, the cerebello-thalamo-cortico circuit has been shown to be involved behavioral adjustments in response to error detection (Ide & Li, 2011). There is also an emerging line of evidence that suggests cortical regions with extensive cerebellar-thalamic
Ojemann, 2000).
TE D
input is involved in cognitive and motor aspects of language and memory (Johnson &
EP
Nonetheless, our finding of the involvement of (a primarily motoric) thalamic structure for
AC C
biological motion perception is exciting, as it reveals the need to consider the possibility of a much earlier (pre-cortical) encoding of this special class of motion. As noted, the involvement of earlier-to-develop, deeper structures of the brain for biological motion perception appears to fit well with the extensive behavioral and EEG studies showing that sensitivity to biological motion emerges at birth, or at least early in development (Fox and McDaniel, 1982; Bertenthal, 1996; Hirai and Hiraki, 2005; Méary et al., 2007; Reid et al., 2008). Infants as young as 5 months of age prefer to look at upright walkers over inverted walkers (Fox and McDaniel, 1982), and can discriminate an intact walker from one where the
Page 21 of 36
ACCEPTED MANUSCRIPT dots have been spatially scrambled (Bertenthal et al., 1987). More recently, it has been shown that the capacity for perceiving biological motion is present at birth. Newborns (twoday-olds) prefer to look at an upright point-light stimulus as compared to its upside-down counterpart, or random motion (Simion et al., 2008). These findings, together with the
RI PT
observed predisposition in newly hatched chicks for looking towards biological motion (Vallortigara et al,. 2005; Vallortigara and Regolin, 2006) challenges not only our
understanding of the bird’s brain but also points to the need to consider earlier, pre-cortical
SC
regions in evaluations of the underlying mechanisms for perceiving biological patterns. Of course it is feasible that the representations we observed here in VLN arise later in
M AN U
processing, via descending cortico-thalamic input. Nonetheless our finding of the relevance of a motoric thalamic nucleus, while unexpected and undoubtedly requires further validation with more detailed investigation, appears to fit with existing literature that has implicated the cerebellum in the processing of biological motion (Sokolov et al., 2012), and more broadly,
TE D
the human thalamus for higher-order behavioural functions (e.g., Bradfield et al., 2013; Habib et al., 2013; Klostermann et al., 2013; for a review, see Saalmann & Kastner, 2011). Our findings of the involvement of a motor-related subcortical structure for biological motion
EP
perception also fit well with the growing body of literature that seems to implicate the mirror
AC C
neuron system for the perception of socially-relevant stimuli (Tai et al., 2004; Iacoboni and Dapretto, 2006; see also Miller and Saygin, 2013). At the heart of the findings from the social cognition literature is the premise that the perception of biological actions are mapped into the observers’ own motor representations (Jeannerod, 2001).
In order to appreciate the functional significance of VLN for biological motion perception, it is important to place our subcortical findings back in the context of responses observed in cortex. The results from our multivariate analyses indicated that both global structure
Page 22 of 36
ACCEPTED MANUSCRIPT information (global structure vs. local natural), and kinematic information (local natural vs. modified) can be well discriminated in retinotopic regions and extrastriate regions, EBA, FBA, STS and IFG. While the sensitivity of these extrastriate regions is not surprising as these same regions have been previously implicated in biological motion perception, the high
RI PT
prediction accuracies into the early retinotopic regions are surprising and allude to a possible role of low level differences between our stimulus classes which may have been a necessary byproduct of our intended manipulations. For example, one distinct difference between the
SC
global walker and the two local stimuli is that the global walker had a fixed configuration (that of a typical human body shape) in the visual field, whereas the two local walkers had a
M AN U
more variable spatial extent. However, we note that as our spatial randomizations for the local stimuli were restricted along the horizontal dimension only, and further restricted within a grid specified by the size of the veridical walker, both the density of the stimuli and the overall spatial extent should be preserved on average across trials. In order to further probe
TE D
the possible role of low level differences in driving the observed SVM prediction accuracies, we conducted an additional MVPA analysis for the global structure versus kinematics discrimination when both stimulus types are presented upside-down (Supplementary Figure
EP
S3). Interestingly, as compared to the accuracies for the upright stimuli (for the same
AC C
comparison), prediction accuracies for the inverted variants increased substantially in early visual cortical regions (V1-V4). In extrastriate regions including IFG, EBA, FBA, STS, and even the VLN, however, comparable prediction accuracies were observed for the two orientations. At first glance, the substantial increase in accuracies in early visual cortex for the upsidedown discriminations seems puzzling; however, this increase seems to match the exaggerated difference in behavioural accuracies between the two conditions when the stimuli are turned upside down (Fig. 2, white versus black bars on the right versus the same bars on the left). That is, inverting the two stimuli results in exaggerated perceptual
Page 23 of 36
ACCEPTED MANUSCRIPT differences between the two stimuli. Critically, low level differences cannot account for this exaggerated difference as these cues (if any) remain the same regardless of orientation. Thus we may rule out the possibility that the observer (and classifier) relied solely upon irrelevant low-level differences (e.g., spatial extent) to perform the discriminations in early cortical
RI PT
regions (although the same cannot be concluded of extrastriate regions, and VLN). Still, the high prediction accuracies in the extrastriate regions (and VLN) should not be discounted. Indeed, classification performance is well-above chance in these same areas for
SC
discriminations between stimuli where low level properties are almost identical (i.e., natural
M AN U
versus modified kinematics) (Fig. 5).
Nonetheless, we fathom that one way to further establish the functional relevance of the high accuracies observed in the early retinotopic regions, as well as extrastriate pSTS, IFG, EBA, as well as the VLN, is to examine the relationships between these responses and behavior. In
TE D
Supplementary Figure S4, we plotted individual subject behavioral performances against SVM accuracies obtained when comparing the local natural and local modified stimuli. This choice was driven by the fact that it provided the highest prediction accuracy in VLN, as
EP
compared to other conditions (Fig. 6b) and likely to offer more reliable comparisons.
AC C
Behavioral performance for these two conditions were first converted into an index, computed as (accuracy_local_modified) subtracted from (accuracy_local_natural). The indices were then plotted against the SVM prediction accuracies for two sample retinotopic regions (V1, V2) as well as for extrastriate pSTS, IFG, EBA, and subcortical VLN. As evident in this figure, behavioral discriminations provide a better match to SVM prediction accuracies in extrastriate pSTS, IFG, EBA, as well as VLN (Fig. S4c, d, e, f) as compared to V1 or V2 (Fig. S4a, b). Still, we caution that interpretation of these relationships is not
Page 24 of 36
ACCEPTED MANUSCRIPT straightforward, as behavioral discriminations are based on left-right direction judgments, while prediction accuracies are based on conditional differences between walker types.
We finally consider the role of inversion in the present data. As noted, we opted to present
RI PT
the three main walker types both upright and upside-down in light of the extensive behavioral literature suggesting orientation effects relating to structure- and kinematics perception are likely attributable to very different sources. Orientation-dependent modulations observed in
SC
the fMRI responses, then, could provide further insight into the specificity of the relevant regions. Our behavioral findings are largely consistent with the orientation-specific
M AN U
behavioral responses to both global structure and local kinematic cues in biological motion demonstrated previously (Troje and Westhoff, 2006; Chang and Troje, 2009, Hirai et al., 2011). The global inversion effect is normally attributed to the retrieval of the familiar shape of the walker as conveyed by the display’s spatiotemporal organization. The configuration-
TE D
based inversion effect was not statistically significant here, possibly due to our additional manipulation of the local trajectories (rendered left-right mirror-symmetric), which acted to decrease discrimination accuracies when the stimulus was held upright. Indeed an
EP
examination of our obtained accuracies for the global stimulus at the upright orientation
AC C
(~80%) indicated that they are significantly lower than those obtained in previous work where local trajectories were held intact along with global shape (~90% in Hirai et al., 2001). The inversion effect for the local natural stimulus, on the other hand, can be attributed to the presence (and orientation) of acceleration (Chang and Troje, 2009). Lastly, what might account for the final inversion effect observed for the local modified stimulus? Due to our manipulation, natural acceleration information is absent in these stimuli. We speculate that here, direction is retrieved by extrinsic motion cues, akin to the translation of a point placed at the rim of rolling wheel (Johansson, 1974). This extrinsic information is reversed when a
Page 25 of 36
ACCEPTED MANUSCRIPT stimulus is mirror-inverted about the horizontal axis. Indeed, behavioral responses are trending in the opposite direction when the motion is inverted (31% accuracy) rather than upright (66% accuracy) (Fig. 2, grey-fill). We still note that a second cue, notably the vertical layout or location of the individual point-lights, and in particular of the feet, may also
RI PT
underlie the inversion effect for the modified stimulus. Specifically, it has been shown that the magnitude of the local motion-based inversion effect is not only modulated by the
orientation of vertical acceleration, but also by whether the vertical order of the body is kept
SC
intact (i.e., head at the top, feet at the bottom) (Hirai et al., 2011). In the present study, in order to destroy global structure in our local stimuli, we elected to shuffle the spatial
M AN U
positions of the point-lights about the horizontal axis only, thereby retaining the vertical order of the body. This correspondingly produced a large behavioral inversion effect, as predicted by previous work (Hirai et al., 2011). How did orientation affect fMRI responses? As evident in Figure 3, response amplitudes changed very little upon stimulus inversion,
TE D
across all three types of walkers. Results from the MVPA, however, are again more revealing. Orientation of global form can be well discriminated a number of regions including early visual cortex and the human motion complex (hMT+). By contrast,
EP
orientation of local kinematics is not well-discriminated across all ROIs tested (Fig. 5). We
AC C
can only speculate as to what might account for this apparent discrepancy between the behavioural and fMRI responses. In line with suggestions that the kinematics-based mechanism should be a fast-acting one (Hirai et al., 2011), perhaps responses that reflect local-orientation-sensitivity are temporally transient such that they could not be captured and contrasted well by the long TR of fMRI acquisition. Another potential factor that may contribute to our inability to measure kinematics-based orientation effects under the current paradigm may relate to the traditional fMRI setup in which the observer is laying supine and viewing a mirror tilted above the head. Given previous behavioural data implicating
Page 26 of 36
ACCEPTED MANUSCRIPT vestibular input for perceiving biological kinematics (Chang et al., 2010), we may have expected to observe orientation-dependent responses in vestibular cortex. Indeed, one previous neuroimaging study has demonstrated the involvement of vestibular cortex when perceiving gravity-consistent visual stimuli (specifically, object motion consistent with
RI PT
natural gravitational acceleration; Indovina et al., 2005). Here, the offset of the stimulus with respect to the gravity vector may have acted to weaken the relevant orientation-dependent
SC
responses.
Previous theoretical models (Giese and Poggio, 2003) have posited that biological motion
M AN U
perception occurs in the lateral-occipitotemporal cortex as an end-product of initially segregated cortical streams for basic form (ventral) and kinematic (dorsal) representations. While one previous study has shown involvement of non-cortical (cerebellar) regions for biological motion perception (Sokolov, 2012), it unclear as to whether there may be more
TE D
extensive subcortical involvement that may have been missed in traditional univariate approaches. Here, we introduced subtle manipulations in our stimuli in an attempt to isolate specific aspects of biological motion perception, using a multivariate approach to survey of
EP
the networks engaged in biological motion perception. Our data implicate a wide and
AC C
complex network with extensive cortical sensitivity to biological motion along much of the same areas previously identified by others, but also a surprising capacity of thalamic VLN to make similar discriminations of biological patterns. Although we caution the exact role of this motoric thalamic relay in governing sensitivity to biological motion requires careful validation, our finding well with previous reports of the involvement of other aspects of the motor loop (Cerebellum; Sokolov, 2012). While it is possible that the VLN response arrives from descending cortico-thalamic input to prepare the organism for a response to a potentially-threatening stimulus, the possibility of this area being a part of a much earlier,
Page 27 of 36
ACCEPTED MANUSCRIPT potentially pre-cortical system that may signal “life” (Troje and Westhoff, 2006; Johnson,
AC C
EP
TE D
M AN U
SC
RI PT
2006) is exciting and deserves further attention and further research.
Page 28 of 36
ACCEPTED MANUSCRIPT
Acknowledgments This research was supported by the Foreign Researcher Invitation Program, National Institute of Information and Communications Technology (NICT), Japan, a JSPS
RI PT
KAKENHI(17H04790) to HB, as well as the Ministry of Internal Affairs, Japan.
SC
Author contributions
DC, HB, and NT contributed to stimulus and design development. DC and HB performed
Competing financial interests
M AN U
data collection and analyses. All authors contributed to the preparation of this manuscript.
AC C
EP
TE D
The authors declare no competing financial interests.
Page 29 of 36
ACCEPTED MANUSCRIPT
References
AC C
EP
TE D
M AN U
SC
RI PT
Ban H, Preston TJ, Meeson A, Welchman AE (2012) The integration of motion and disparity cues to depth in dorsal visual cortex. Nature Neurosci 15:636–643 Baxter MG (2013) Mediodorsal thalamus and cognition in non-human primates. Frontiers in systems neuroscience, 7, 38. Bradfield LA, Hart G, Balleine, BW (2013) The role of the anterior, mediodorsal, and parafascicular thalamus in instrumental conditioning. Frontiers in systems neuroscience, 7, 51. Beintema JA, Lappe M (2002) Perception of biological motion without local image motion. Proc. Natl Acad Sci USA 99: 5661-5663. Bertenthal BI, Proffitt DR, Kramer SJ (1987) Perception of biomechanical motions by infants: implementation of various processing constraints. J Exp Psych: Human Perception and Performance 13: 577-585. Bertenthal BI (1996) Origins and early development of perception, action, and representation. Annual Review of Psychology 47: 431-459. Bonda E, Petrides M, Ostry D, Evans A (1996) Specific involvement of human parietal systems and the amygdala in the perception of biological motion. Journal of Neuroscience 16: 3737-3744. Bonda E, Petrides M, Frey S, Evans A (1995). Neural correlates of mental transformations of the body-in-space. Proceedings of the National Academy of Sciences, 92(24), 1118011184. Carpenter MB, Strominger NL (1967) Efferent fibers of the subthalamic nucleus in the monkey. A comparison of the efferent projections of the subthalamic nucleus, substantia nigra and globus pallidus. Am J Anat 121: 41-72. Casile A, Giese MA (2005) Critical features for the recognition of biological motion. Journal of vision 5(4): 6-6. Chang C-C, Lin C-J (2011) LIBSVM : a library for support vector machines. ACM Transactions on Intelligent Systems and Technology 2:27:1-27:27. Chang DH, Troje NF (2009) Acceleration carries the local inversion effect in biological motion perception. Journal of Vision 9(1):19, 1–17. Chang DH, Harris LR, Troje NF (2010) Frames of reference for biological motion and face perception. Journal of Vision, 10(6), 22-22. Chawla NV, Bowyer KW, Hall LO, Kegelmeyer WP (2002) SMOTE: synthetic minority over-sampling technique. J Artif Intell Res 16: 341-378. Creem-Regehr SH, Neil JA, Yeh HJ (2007) Neural correlates of two imagined egocentric transformations. Neuroimage, 35(2), 916-927. Daskalakis ZJ et al (2004) Exploring the connectivity between the cerebellum and motor cortex in humans. Journal of Physiology 557.2: 689-700. De Martino F et al (2008) Combining multivariate voxel selection and support vector machines for mapping and classification of fMRI spatial patterns. Neuroimage 43: 44-48. Fox R, McDaniel C (1982) The perception of biological motion by human infants. Science 218: 486-487. Page 30 of 36
ACCEPTED MANUSCRIPT
AC C
EP
TE D
M AN U
SC
RI PT
Freire, A., Lee, K., & Symons, L. A. (2000) The face-inversion effect as a deficit in the encoding of configural information: Direct evidence. Perception, 29(2), 159-170. Genovese CR, Lazar NA, Nichols T (2002) Thresholding of statistical maps in functional neuroimaging using the false discovery rate. NeuroImage 15: 870-878. Giese MA, Poggio T (2003) Neural mechanisms for the recognition of biological motion. Nat Rev Neuroscience 4: 179-192. Gilaie-Dotan S, Saygin AP, Lorenzi LJ, Rees G, Behrmann M (2015) Ventral aspect of the visual form pathway is not critical for the perception of biological motion. Proceedings of the National Academy of Sciences, 112(4): E361-E370. Grossman ED, Blake R (2002) Brain areas active during visual perception of biological motion. Neuron 35: 1167-1175. Grosbas M-H, Beaton S, Eickhoff SB (2012) Brain regions involved in human movement perception: A quantitative voxel-based meta-analysis. Human Brain Mapping 33: 431454. Hirai M, Hiraki K (2005) An event-related potentials study of biological motion perception in human infants. Cognitive Brain Research 22: 301-304. Hirai M, Chang DH, Saunders DR, Troje NF (2011) Body configuration modulates the usage of local cues to direction in biological-motion perception. Psychological Science 12: 1543-1549. Hirai, M., Saunders, D. R., & Troje, N. F. (2011) Allocation of attention to biological motion: Local motion dominates global shape. Journal of Vision, 11(3), 4-4. Iacoboni M, Dapretto M (2006) The mirror neuron system and the consequences of its dysfunction. Nature Reviews Neuroscience 7(12): 942-951. Ide JS, Chiang-shan RL (2011) A cerebellar thalamic cortical circuit for error-related cognitive control. Neuroimage, 54(1), 455-464. Indovina I, Maffei V, Bosco G, Zago M, Macaluso E, Lacquaniti F (2005) Representation of visual gravitational motion in the human vestibular cortex. Science, 308(5720), 416419. Jankowski MM, Ronnqvist KC, Tsanov M, Vann SD, Wright NF, Erichsen JT, et al (2013). The anterior thalamus provides a subcortical circuit supporting memory and spatial navigation. Frontiers in Systems Neuroscience, 7. Jastoff J, Orban GA (2009) Human functional magnetic resonance imaging reveals separation and integration of shape and motion cues in biological motion processing. Journal of Neuroscience 29: 7315-7329. Johansson G (1973) Visual perception of biological motion and a model for its analysis. Percept Psychophys 14: 195-204. Jeannerod M (2001) Neural simulation of action: a unifying mechanism for motor cognition. Neuroimage 14(1): S103-S109. Johansson G (1974) Vector analysis in visual perception of rolling motion. Psychological Research 36: 311-319. Johnson MD, Ojemann GA (2000) The role of the human thalamus in language and memory: evidence from electrophysiological studies. Brain and cognition, 42(2), 218230. Johnson MH (2006) Biological Motion: A Perceptual Life Detector? Current Biology 16: R376-R377.
Page 31 of 36
ACCEPTED MANUSCRIPT
AC C
EP
TE D
M AN U
SC
RI PT
Kievit J, Kuypers HGJM (1975) Subcortical afferents to the frontal lobe in the rhesus monkey studied by means of retrograde horseradish peroxidase transport. Brain Res 85: 261-266. Kievit J, Kuypers, HGJM (1977) Organization of the thalamo-cortical connexions to the frontal lobe in the rhesus monkey. Experimental Brain Research, 29(3-4), 299-322. Klostermann F (2013) Functional roles of the thalamus for language capacities. Frontiers in systems neuroscience, 7, 32. Kriegeskorte N, Goebel R, Bandettini P (2006) Information-based functional brain mapping. Proc Natl Acad Sci USA 103: 3863-3868. McAlonan K, Cavanaugh J, Wurtz RH (2008) Guarding the gateway to cortex with attention in visual thalamus. Nature, 456(7220), 391. Méary D, Kitromilides E, Mazens K, Graff C, Gentaz E (2007) Four-day-old human neonates look longer at non-biological motions of a single point-of-light. PloS ONE 2: e186.Peuskens H, Vanrie J, Verfaillie K, Orban GA (2005) Specificity of regions processing biological motion. Eur Journal of Neuroscience 21: 2864-2875. Miller LE, Saygin AP (2013) Individual differences in the perception of biological motion: links to social cognition and motor imagery. Cognition 128(2): 140-148. Morel A, Liu J, Wannier T, Jeanmonod D, Rouiller EM (2005) Divergence and convergence of thalamocortical projections to premotor and supplementary motor cortex: a multiple tracing study in the macaque monkey. European Journal of Neuroscience, 21(4), 1007-1029. O'Connor DH, Fukui MM, Pinsk MA, Kastner S (2002) Attention modulates responses in the human lateral geniculate nucleus. Nature neuroscience, 5(11), 1203. O'toole AJ, Natu V, An X, Rice A, Ryland J, Phillips PJ (2014) The neural representation of faces and bodies in motion and at rest. NeuroImage, 91, 1-11. Ostendorf F, Liebermann D, Ploner CJ (2013) A role of the human thalamus in predicting the perceptual consequences of eye movements. Frontiers in systems neuroscience, 7, 10. Peelen, M. V., Wiggett, A. J., & Downing, P. E. (2006) Patterns of fMRI activity dissociate overlapping functional brain areas that respond to biological motion. Neuron, 49(6), 815822. Prevosto V, Graf W, Ugolini G (2009) Cerebellar inputs to intraparietal cortex areas LIP and MIP: functional frameworks for adaptive control of eye movements, reaching, and arm/eye/head movement coordination. Cerebral cortex, 20(1), 214-228. Prevosto V, Sommer M (2013) Cognitive control of movement via the cerebellar-recipient thalamus. Frontiers in systems neuroscience, 7, 56. Ramnani N (2012) Frontal lobe and posterior parietal contributions to the cortico-cerebellar system. The Cerebellum, 11(2), 366-383. Reid VM, Hoehl S, Landt J, Striano T (2008) Human infants dissociate structural and dynamic information in biological motion: Evidence from neural systems. Social Cognitive and Affective Neuroscience 3: 161-167. Saalmann YB, Kastner S (2011) Cognitive and perceptual functions of the visual thalamus. Neuron, 71(2), 209-223. Saygin AP, Wilson SM, Hagler DJ, Bates E, Sereno MI (2004) Point-light biological motion perception activates human premotor cortex. Journal of Neuroscience 24(27): 6181-6188.
Page 32 of 36
ACCEPTED MANUSCRIPT
AC C
EP
TE D
M AN U
SC
RI PT
Saygin AP (2007) Superior temporal and premotor brain areas necessary for biological motion perception. Brain 130(9): 2452-2461. Serences JT (2004) A comparison of methods for characterizing the event-related BOLDtimeseries in rapid fMRI. NeuroImage 21: 1690– 1700. Sereno MI et al (1995) Borders of multiple visual areas in humans revealed by functional magnetic resonance imaging. Science 268: 889-893. Shinoda Y, Kakei S, Futami T, Wannier T (1993) Thalamocortical organization in the cerebello-thalamo-cortical system. Cerebral Cortex 3: 421-429. Simion F, Regolin L, Bulf H (2008) A predisposition for biological motion in the newborn baby. PNAS 150: 809-813. Sokolov AA et al (2012) Biological motion processing: the left cerebellum communicates with the right superior temporal sulcus. Neuroimage 59: 2824-2830. Sunaert S, Van Hecke P, Marchal G, Orban GA (1999) Motion-responsive regions of the human brain. Experimental Brain Research 127(4): 355-370. Tai YF, Scherfler C, Brooks DJ, Sawamoto N, Castiello U (2004) The human premotor cortex is' mirror' only for biological actions. Current Biology 14(2): 117-120. Talairach et al (1988) Co-planar stereotaxic atlas of the human brain. Thieme, New York. Thompson JC, Baccus W (2012) Form and motion make independent contributions to the response to biological motion in occipitotemporal cortex. Neuroimage 59: 625-634. Thompson JC, Clarke M, Stewart T, Puce A (2005) Configural processing of biological motion in human superior temporal sulcus. Journal of Neuroscience 25(39): 9059-9066. Tomasi D, Chang L, Caparelli EC, Ernst T (2007). Different activation patterns for working memory load and visual attention load. Brain research, 1132, 158-165. Troje NF (2002) Decomposing biological motion: A framework for analysis and synthesis of human gait patterns. Journal of Vision 2: 371-387. Troje NF, Westhoff C (2006) The inversion effect in biological motion perception: Evidence for a “life detector”? Current Biology 16: 821-824. Vallortigara G, Regolin L, Marconato F (2005) Visually inexperienced chicks exhibit spontaneous preference for biological motion patterns. PloS Biology 3: e208. Vallortigara G, Regolin L (2006) Gravity bias in the interpretation of biological motion by inexperienced chicks. Current Biology 16: R279-R280. van der Salm SM, van der Meer JN, Nederveen AJ, Veltman DJ, van Rootselaar AF, Tijssen MA (2013) Functional MRI study of response inhibition in myoclonus dystonia. Experimental neurology, 247, 623-629. van Kemenade BM, Muggleton N, Walsh V, Saygin AP (2012) Effects of TMS over premotor and superior temporal cortices on biological motion perception. Journal of Cognitive Neuroscience 24(4): 896-904. Vangeneugden J, Peelen MV, Tadin D, Battelli L (2014) Distinct neural mechanisms for body form and body motion discriminations. Journal of Neuroscience, 34(2): 574-585. Wandell BA, Brewer AA, Dougherty RF (2005) Visual field map clusters in human cortex. Philosophical Transactions of the Royal Society of London B: Biological Sciences 360(1456): 693-707. Wang Y, Brzozowska-Prechtl A, Karten HJ (2010) Laminar and columnar auditory cortex in avian brain. Proc Natl Acad Sci USA 107(28):12676–12681.
Page 33 of 36
ACCEPTED MANUSCRIPT
AC C
EP
TE D
M AN U
SC
RI PT
Wiesendanger R, Wiesendanger M (1985) The thalamic connections with medial area 6 (supplementary motor cortex) in the monkey (Macaca fascicularis). Experimental Brain Research, 59(1), 91-104. Wiesendanger R, Wiesendanger M. (1985) Cerebello-cortical linkage in the monkey as revealed by transcellular labeling with the lectin wheat germ agglutinin conjugated to the marker horseradish peroxidase. Experimental brain research, 59(1), 105-117. Xiang H, Lin C, Ma X, Zhang Z, Bower JM, Weng X, Gao JH (2003) Involvement of the cerebellum in semantic discrimination: an fMRI study. Human brain mapping, 18(3), 208-214.
Page 34 of 36
ACCEPTED MANUSCRIPT
Figure Legends
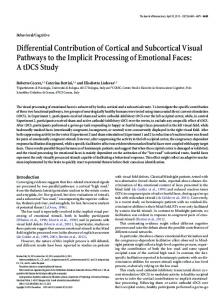
Schematic representations of the three main types of stimuli presented in this experiment, at the two orientations (Figure 1a). In the global stimulus, the structural organization of the walker was held intact, but local trajectories were rendered left-right mirror symmetric. In the local natural stimulus, the structural organization was destroyed by horizontal shuffling, but the local kinematics were veridical. Finally in the local modified stimulus, both the structural organization was destroyed through horizontal shuffling, and local kinematics were perturbed by forcing the motion along the fixed trace at constant speed. The stimulus labels and the corresponding global and local information contained in them are summarized in Figure 1b.
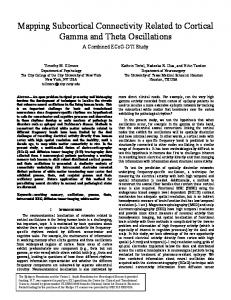
Figure 2
Behavioral discrimination accuracies for direction judgements. Overall performance was significantly better for the upright rather than inverted stimuli. Performance was best for the global (empty bars), than the two local stimuli (black- and grey-filled bars). Additionally, inverting stimulus orientation resulted in a significant performance decline for the local natural and local modified stimuli, but not the global walkers. Error bars represent ± 1 SEM (N = 19).
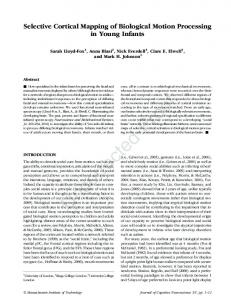
Figure 3
GLM beta weights (% signal change) for the three main types of walkers at the upright (a) and inverted (b) presentations. Overall, the univariate signals were highest for the local natural stimuli. Note that in all multivariate analyses, the univariate differences across conditions were removed.
Figure 4
Sample map from the whole-brain group-level GLM analyses (random effects). We present the results from contrasting responses to the local natural versus local modified stimulus. Responses are superimposed onto representative flat maps of left and right hemispheres of one participant, with retinotopic regions delineated. Sulci are coded in darker grey than the gyri.
AC C
EP
TE D
M AN U
SC
RI PT
Figure 1
Figure 5
MVPA classification accuracies are above-baseline for (a), discriminating global structure-from-motion from local (natural) kinematics, and between natural versus modified local kinematics; (b) discriminating between upright and inverted global and local cues. The dashed line indicates the shuffled baseline (0.54) against which accuracies were tested. Abovebaseline accuracies (FDR < 0.05), are indicated by asterisks. Error bars represent ± 1 SEM (N = 19).
Figure 6
(a) GLM contrasts for global shape-from-motion vs local (natural) kinematics (upright: green outline; inverted: white outline), and local natural vs modified kinematics (upright: red outline; inverted: blue outline) yielded significant, overlapping clusters in left ventral lateral nucleus Page 35 of 36
ACCEPTED MANUSCRIPT
AC C
EP
TE D
M AN U
SC
RI PT
(VLN). (b,c) Classification accuracies from ROI-based SVM analysis on bilateral VLN identified across subjects. The dashed line indicates the shuffled baseline (0.54) against which accuracies were tested. Abovebaseline accuracies (FDR < 0.05), are indicated by asterisks. Error bars represent ± 1 SEM (N = 19).
Page 36 of 36
Figure 1
ACCEPTED MANUSCRIPT
a
Global
Local Natural
Local Modified
RI PT
Upright
Information Contained Global Structure Local Trajectories Symmetric Intact Scrambled Veridical Scrambled Constant
M AN U
Stimulus label Global Local Natural Local Modified
AC C
EP
TE D
b
SC
Inverted
Figure 2
Global Local Natural Local Modified
1 0.8
0.4 0.2 0
Upright
Inverted
RI PT
0.6
AC C
EP
TE D
M AN U
SC
Proportion Correct ± 1 SEM
ACCEPTED MANUSCRIPT
Figure 3
ACCEPTED MANUSCRIPT
a
Global (upright) Local Natural (upright) Local Modified (upright)
1
0.4 0.2
0.6
VLN
RI PT
0.4 0.2 0
-0.2
V1
-0.4
b
V2 V3 V3A V3B V4 hMT+ EBA FBA IFG STS
Global (inverted) Local Natural (inverted) Local Modified (inverted)
1 0.8
0.4 0.2
0.6
M AN U
Beta (% signal change)
0
SC
Beta (% signal change)
0.8
VLN
0.4 0.2 0
-0.2
V1
V2 V3 V3A V3B V4 hMT+ EBA FBA IFG STS
AC C
EP
TE D
-0.4
0
Figure 4
ACCEPTED MANUSCRIPT
GLM (Random-Effects)
p < .05 t(18) 2.10
p < .0001 8.00
RI PT
Local Natural vs Local Modified
AC C
EP
TE D
M AN U
SC
Left
Right
Figure 5
ACCEPTED MANUSCRIPT
a
Global vs Local Natural Local Natural vs Local Modified
0.9
0.7
* * * * * * * * * * * *
*
0.6
* ** * * * * *
0.5 V1 V2 V3 V3A V3B V4
b 1 0.9
Global (upr vs inv) Local Natural (upr vs inv) Local Modified (upr vs inv)
* * *
0.8 0.7
*
* *
0.5
TE D
V1 V2 V3 V3A V3B V4
EP AC C
*
*
0.6
0.4
hMT+ EBA FBA IFG STS
SC
0.4
Prediction Accuracy ± 1 SEM
*
RI PT
0.8
M AN U
Prediction Accuracy ± 1 SEM
1
hMT+ EBA FBA IFG STS
Figure 6
ACCEPTED MANUSCRIPT
Global vs Local Natural (upr) Global vs Local Natural (inv)
Local Natural vs. Modified (upr) Local Natural vs. Modified (inv)
Coronal
Sagittal
L
P
A
p < .05 t(18) 2.1
b
8
c
*
*
0.6 0.5 0.4
VLN
EP AC C
Prediction Accuracy ± 1 SEM
0.7
Global (upr vs inv) Local Natural (upr vs inv) Local Modified (upr vs inv) 0.8 0.7
M AN U
0.8
TE D
Prediction Accuracy ± 1 SEM
Global vs Local Natural Local Natural vs Local Modified
RI PT
R
SC
a
0.6 0.5 0.4
VLN