residual cardiac and respiratory movement noise (about10-3 to 10-2 change in ..... cortex at 600 nm (thin trace: vertical arrow, 3 x10⁻³) and 930 nm. (thick trace: ...
Proc. Natl. Acad. Sci. USA Vol. 87, pp. 6082-6086, August 1990 Neurobiology
Cortical functional architecture and local coupling between neuronal activity and the microcirculation revealed by in vivo high-resolution optical imaging of intrinsic signals (cortical columns/blood volume/cerebral metabolism/oximetry)
RON D. FROSTIG*t, EDMUND E. LIEKE*, DANIEL Y. Ts'o*, AND AMIRAM GRINVALD*t§ tIBM Research Division, Thomas J. Watson Research Center, Yorktown Heights, NY 10598; *Laboratory of Neurobiology, The Rockefeller University, 1230 York Avenue, New York, NY 10021; and the Weizmann Institute of Science, Rehovot, 76100 Israel
Communicated by Torsten N. Wiesel, April 19, 1990
ABSTRACT We have shown previously the existence of small, activity-dependent changes in intrinsic optical properties of cortex that are useful for optical imaging of cortical functional architecture. In this study we introduce a higher resolution optical imaging system that offers spatial and temporal resolution exceeding that achieved by most alternative imaging techniques for imaging cortical functional architecture or for monitoring local changes in cerebral blood volume or oxygen saturation. In addition, we investigated the mechanisms responsible for the activity-dependent intrinsic signals evoked by sensory stimuli, and studied their origins and wavelength dependence. These studies enabled high-resolution visualization of cortical functional architecture at wavelengths ranging from 480 to 940 nm. With the use of near-infrared illumination it was possible to image cortical functional architecture through the intact dura or even through a thinned skull. In addition, the same imaging technique proved useful for imaging and discriminating sensoryevoked, activity-dependent changes in local blood volume and oxygen saturation (oxygen delivery). Illumination at 570 nm allowed imaging of activity-dependent blood volume increases, whereas at 600-630 nm, the predominant signal probably originated from activity-dependent oxygen delivery from capillaries. The onset of oxygen delivery started prior to the blood volume increase. Thus, optical imaging based on intrinsic signals is a minimally invasive procedure for monitoring short- and longterm changes in cerebral activity.
In the present study we have introduced high-resolution optical imaging techniques and the use of natural sensory stimuli to study the coupling between neuronal activity and microcirculatory responses and to image the functional architecture of cortex. Although the optical signals observed in response to a natural sensory stimulus were 1 to 2 orders of magnitude smaller than intrinsic signals evoked by experimental manipulations other than a sensory stimulus (14-16, 18-21), high-resolution imaging was still possible. To analyze the components of the intrinsic signal, we imaged the well-known columnar organization of the visual cortex at various wavelengths. The classical studies of Hubel and Wiesel (22) demonstrated that neurons in the visual cortex are selective for the orientation of a visual stimulus, and that neurons with similar orientation preferences are grouped together into orientation columns. Similarly, neurons that receive input primarily from the left eye are segregated from those receiving input from the right eye, forming ocular dominance columns. We selectively activated restricted cortical regions by choosing an appropriate visual stimulus instead of using direct electrical stimulation.
MATERIALS AND METHODS Animals. Monkeys and cats were anesthetized with continuous infusion of sodium pentothal and paralyzed with succinylcholine or vecuronium bromide (Norcuron). To control the proper level of anesthetics, and the physiological state of the animal, the electroencephalogram, the electrocardiogram, expired CO2, and rectal temperature were monitored continuously. Optical Chamber. To minimize optical noise originating from cortical movement due to cardiac pulsation and respiration, a 20-mm (diameter) stainless steel chamber was glued to the exposed skull with dental cement. The top of the chamber was closed with a transparent glass window. The chamber was filled with silicone oil (200 fluid, Dow Coming). To remove the residual cardiac and respiratory movement noise (about 10-3 to 10-2 change in reflected light intensity) from smaller activity-related optical signals, the data acquisition was synchronized to the electrocardiogram and respiratory cycle and a subtraction procedure was used (6, 10, 11). Charge-Coupled Device (CCD) Apparatus. To achieve a high spatial resolution we used a slow-scan CCD camera (23, 24) (Photometrics, Tucson, AZ). The exposed cortex was illuminated with light guides and imaged through a standard macro lens (f 2.8, Pentax). The frame rate of the CCD camera was up to 5 Hz. The duration of each trial was usually 3 s. To improve the signal-to-noise ratio we used signal averaging (10-64 trials for each stimulus condition; the experiment
Several in vitro and in vivo imaging techniques are based on activity-dependent changes in cerebral blood volume or flow or oxygen saturation (1-5). Optical imaging (6, 7), based on intrinsic signals (8), offers several advantages over optical imaging with voltage-sensitive dyes (6-12). It has been shown that neuronal activity produces at least three characteristic types of intrinsic optical changes in brain tissue that affect the light intensity reflected from the active cortex (13-16). The first are light scattering signals, first reported by Hill and Keynes (13), who, some 40 years ago, detected light scattering changes in active nerves. These signals have multiple origins (see ref. 17 for review). A second type of intrinsic signal originates from changes in the absorption or fluorescence of the transition states of intrinsic chromophores like hemoglobin, cytochromes, or NADH. Such changes of intrinsic chromophores have been investigated by Chance (14) and by Jobsis, LaManna, Rosenthal, and other groups (1520). Of particular interest is the extensively studied transition from oxyhemoglobin to hemoglobin in response to increased level of electrical activity (oximetry). A third type of intrinsic signal originates from changes in blood volume leading to changes in the overall light absorption by hemoglobin.
Abbreviation: CCD, charge-coupled device. tTo whom reprint requests should be addressed at: The Rockefeller University, Laboratory of Neurobiology, Box 138, 1230 York Avenue, New York, NY 10021.
The publication costs of this article were defrayed in part by page charge payment. This article must therefore be hereby marked "advertisement" in accordance with 18 U.S.C. §1734 solely to indicate this fact.
6082
Proc. Natl. Acad. Sci. USA 87 (1990)
Neurobiology: Frostig et al. Reflection Change
_i
D
s~~~~~~~~~~~~~~~~~
2 mm
AR
540 nm ,
11,-j /
//
810 nm
C
810 nm a.
(N
\t/
duration was 0.5-3 hr including an interstimulus interval of 6-10 s in addition to data-transfer time).
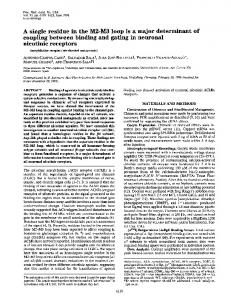
RESULTS Mapping Signal. Of the multiple components of the intrinsic signal, only some may be sufficiently large and well localized to the site of neuronal activity to be useful for studying the local coupling between neuronal activity and the microcirculation and for high-resolution imaging of the functional architecture of cortex. We defined the mapping signal as the difference between two intrinsic signals at a given cortical locus: the first signal is the response to an optimal stimulus evoking action potentials in neurons at that cortical locus and the second signal results from a second stimulus that does not activate that cortical locus.l For example, to derive the ocular dominance mapping signal we divided the signal obtained with right eye stimulation from that obtained with a left eye stimulation (both measured at the center of the right ocular dominance columns) (8, 13, 24). An effective approach for differentiating individual components of the intrinsic signal is to determine its wavelength dependency and time course. We found that the visible and the near-infrared wavelength ranges were useful for functional imaging. Fig. 1 illustrates the maps of ocular dominance columns of monkey striate cortex obtained with visible (540 nm) and infrared (810 nm) illumination. These maps were obtained as follows: the averaged picture obtained when only the right eye viewed a visual stimulus (e.g., Fig. 1A) was divided by the averaged picture obtained when only the left eye was stimulated (8, 12, 24). The maps obtained by using illumination at 540 nm and at 810 nm were similar. The artifacts from the large blood vessels were larger at shorter wavelengths, due to the large hemoglobin absorption at these wavelengths (e.g., 540 nm; Fig. 1B). Fifteen nearly identical functional maps were obtained at wavelengths ranging from 480 to 940 nm (including several isosbestic wavelengths). These optical maps were confirmed by single unit recordings or by subsequent comparison with cytochrome oxidase histology from the same tissue. Functional maps obtained at 600-630 nm gave the best quality and reproducibility (e.g., ref. 24). Relative to the reflected light intensity without a stimulus, the amplitudes of the activity-dependent reflection signals were 2.4% and 0.1% at 540 nm and 810 nm, respectively. The amplitudes of the digital values (low-pass filtered) of the ocular dominance column maps are shown in Fig. 1 D and E. Although the two functional maps were similar at the two wavelengths (Fig. 1 B and C), the mapping signal at 540 nm (0.12%) was about 18 times larger than that obtained at 810 nm (0.0065%). Action Spectrum of the Reflection Signal. Previous studies have shown that increases in blood volume, changes in the oxidation state of hemoglobin, and changes in the oxidation
$Even if a small fraction of the neurons at a given site responded to the nonoptimal stimulus, this definition of a mapping signal is still useful for comparing the results at different wavelengths.
6083
FIG. 1. Visible and near-infrared high-resolution optical imaging of ocular dominance columns in macaque visual cortex. (A) CCD picture of the exposed 9 x 2.5 mm cortex, showing the cortical vasculature. (B) Imaging of the ocular dominance columns in area 17 of monkey visual cortex with 540-nm illumination. (C) Same as B but imaged with 810-nm illumination. (D and E) Plots of the pixel values in these images (divided by the total intensity of the reflected light), across the same single row of each map (see arrows in B and C), showing the amplitude of the mapping component of the signals (each pixel was viewing a 50 x 50 ,um area of cortex).
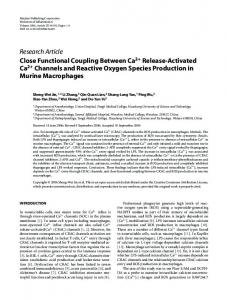
state of cytochromes all yield markedly different reflection spectra (14-16, 18, 20, 25). To investigate the multiple origins of the intrinsic signal, we first measured the reflection spectrum (action spectrum) by repeating the imaging experiments described above. The striking similarity of the action spectrum (Fig. 2A) to the absorption spectrum of hemoglobin (Fig. 2B) suggested that most of the activity-dependent reflection signal (at 480-590 nm) originated from a blood volume increase rather than from changes in the absorption of cytochromes or a change in hemoglobin oxidation state alone. Indeed, at 570 nm (an isosbestic wavelength), hemoglobin absorption is not sensitive to the oxygenation state of hemoglobin; yet a large reflection signal was obtained, along with good maps of the ocular dominance columns. High-Resolution Imaging of Blood Volume Changes With a Dye Injected into the Microcirculation. The observation that high-resolution functional maps can be obtained from activity-dependent blood volume changes alone was surprising. Furthermore, it may be argued that the 570-nm filter that was used was not exactly centered around the in vivo isosbestic wavelength for hemoglobin. To better isolate the contribution of blood volume changes from other possible components, we made an i.v. injection of a fluorescent dye (Texas Red dextran, 30 mg/kg; Molecular Probes) and compared the changes in the fluorescence signal excited at the hemoglobin isosbestic wavelength (570 nm) with the reflection signals at 570 nm. The dye was conjugated to high molecular weight dextran (70,000 Mr) and therefore did not leak out of the cerebral microvasculature. This approach demonstrated di-
2
v 9x
A MReflection
M
Map. (norm.) - Ref.
10o .5
I
10
W
O
15 w
10
B
A A
5
Hemoglobin
Absorbance
---
560
D
Spectrum SF -5HbOv x
0
480
-5
In
640
Oximetry 56(1/
640
720
720
FIG. 2. (A and B) Comparison between the action spectrum of activity-dependent reflected light signals in monkey striate cortex and the absorption spectra of hemoglobin. Map., mapping; Ref., reflection. (A) Fractional change of the reflected light signal at different illumination wavelengths. (The line between the points was drawn by hand.) To minimize errors, the in vivo reflection measurements at different wavelengths were interlaced, using a filter wheel. (B) In vitro absorption spectra of hemoglobin and oxyhemoglobin. (C) Difference between the normalized action spectrum of the mapping signal and the action spectrum of the reflection signal shown in A. The action spectrum of the mapping signal was normalized to the amplitude of the reflected light signal at the isosbestic point at 570 nm. (D) Action spectrum of a pure oximetry signal in a test tube. The vertical scales in A-D are in arbitrary units. Considering the expected differences between the in vivo and in vitro spectroscopy measurements, the striking similarity between C and D suggests that in addition to the blood volume component the mapping signal contained also an oximetry component.
6084
Neurobiology: Frostig et al.
rectly that with proper analysis even blood volume change alone can yield a high-resolution functional map. We observed an activity-dependent increase in fluorescence (emissions collected at >630 nm); this fluorescence signal yielded a high-resolution functional map that was essentially identical to the 570-nm map obtained with a reflection measurement prior to dye injection. 1 The mapping signal derived from the high-resolution fluorescence imaging was 0.07%, 20-fold smaller than the 1.4% overall activity-dependent fluorescence increase. Both of these values were similar to those obtained with measurements of the intrinsic signals at 570 nm. From these results, we conclude that the major component of the intrinsic signals measured at 570 nm originates primarily from blood volume changes. The quality and spatial resolution ofthe functional maps (at 570 nm) strongly indicate that the source of the small mapping signals is densely distributed, probably activity-dependent capillary recruitment or venule dilation, some component of which is highly localized to the site of cortical electrical activity. Comparison of the Action Spectra of the Mapping and Reflection Signals. We calculated the action spectrum of the intrinsic mapping signal (e.g., Fig. 1 D and E) from the functional maps obtained at the wavelength range of 560-710 nm. At wavelengths with a large hemoglobin absorption component (