castle, Lynch, Georgopolous, Sakata, & Acuna, 1975;. Pohl, 1973; Pribram & Barry, .... shaw, Mackworth, and Pribram (1970) showed that the ordinary relatively ...
Perception & Psychophysics /993. 53 (5). 505-5/8
Cortical involvement in visual scan in the monkey R. BRUCE BOLSTER University of Winnipeg, Winnipeg, Ontario, Canada and KARL H. PRIBRAM Stanford University, Stanford, California and Radford University, Radford, Virginia Monkeys performed a visual search task for food reward. Green square targets were embedded in 3 x 3 arrays of colored forms. In distinct-feature arrays, all nontarget stimuli were red diamonds, whereas in shared-feature arrays, some nontarget stimuli shared either form (red square) or color (green diamond) with the target. Reaction time was slower for shared-feature arrays and linearly related to the number of shared-feature distractors. Errors were more common in sharedfeature arrays, and shared-feature distractors were mistaken for targets more frequently than distinct-feature distractors. Event-related local field potentials were recorded from implanted transcortical electrodes. Significant task-related differences were obtained from association cortex, but not from projection cortex. Results are discussed in terms of the relative contribution of inferotemporal, dorsolateral frontal, and parietal cortex to feature-driven visual scan.
Some 30 years ago, J. Z. Young (1962) developed the theme that the primary sensory projection systems of the brain have evolved to map the sensory environment, whereas the more intrinsically connected "association" cortex performs abstract computations on the mapping functions. In discussing this paper, one of us (Pribram, 1962) presented evidence that such abstract computations were composed by sampling the maps in a top-down fashion. More recently, a great deal of interest has been generated by Schneider and Shiffrin's (for a review, see Schneider, Dumais, & Shiffrin, 1984) observations of the conditions that predispose humans toward automatic as opposed to those which predispose them toward controlled processing of sensory input. Automatic processing was considered to operate simultaneously on maps of the input; controlled processing was considered to entail scans (searches) of the input. Additional experiments by Efron have called attention to the fact that a variety of hitherto conflicting or unexplained observations-especially with regard to differences in hemispheric function-can be understood in terms of the order in which sensory input is sampled, or scanned (for a review, see Efron, 1990). Scanning was
The authors are indebted to Sharon E. Hendricks for collection and analysis of data reported in Experiment I, and to Margaret J. Harrington, Stephen D. Cutcomb, and Ronald M. Ruff for assistance in surgery, computer programming, and data collection in Experiment 2. Funding for this research was provided by grants from the Natural Sciences and Engineering Research Council of Canada to R.B., and from NIHINIMH to K.H.P. Correspondence should be addressed to K. H. Pribram, Center for Brain Research and Informational Sciences, Radford University, Box 6977, Radford, VA 24142.
shown to occur during a postexposure period and thus to be independent of eye movement. Some central brain process, shown to be influenced by experience, was inferred to be responsible. In monkeys, several experiments have been carried out in our laboratory to investigate whether indeed the sensory projection systems of the brain are involved in mapping while the intrinsically connected sensory specific association systems are involved in sampling operations. Thus, with the use of a mathematical stimulus sampling technique in analyzing data obtained in a multiple-choice experiment, resections of the inferotemporal cortex were shown to impair sampling when monkeys were trained to choose one of several objects (Pribram, 196Oa). A similar result was obtained when multiple features of a pattern were critical to performance (Butter, 1968). Furthermore, with the use of brain electrical responses, it was shown that recordings made from striate (visual projection) cortex reflected all of the feature characteristics of a briefly (50 msec) presented multifeatured stimulus. By contrast, the recordings made from inferotemporal (sensory specific association) cortex reflected only task parameters: that is, these recordings reflected the distinction between the feature that was being rewarded and responded to and the features that were not (Nuwer & Pribram, 1979; Rothblat & Pribram, 1972). The present studies were undertaken to investigate under what conditions stimulus sampling entailed scan and what extent of intrinsic cortex might be involved in sampling procedures. Previous observations (Pribram, I 960b) showed that the more difficult the discrimination task is for monkeys (as measured by number of errors made before reaching criterion), the greater the deficit after resec-
505
Copyright 1993 Psychonomic Society, Inc.
506
BOLSTER AND PRIBRAM
tions of the inferotemporal cortex. To further analyze task parameters contributing to difficulty, we chose to measure reaction time (RT) as well as errors to criterion and to compare performance on a distinct-feature array task with performance on a shared-feature array task. These tasks were modified from Treisman's "disjunctive" versus "conjunctive" displays. Modification was in keeping with Schneider and Shiffrin's procedures: the display set-the nature and number of distractors in an arraywas manipulated. Such procedures had in previous studies (Douglas, Barrett, Pribram, & Cerny, 1969; Douglas & Pribram, 1969; Pribram, 1960a) been shown to be sensitive to the effects of brain damage. The first experiment addressed the conditions in which scan becomes manifest; the second experiment addressed the issue of the extent of cortex involved in the scanning process.
GENERAL METHOD Subjects Subjects were 6 female cynomologous monkeys (Macaca fascicularis) , 3 in Experiment I and 3 in Experiment 2. They each weighed approximately 3 kg and were approximately 3 years old. The animals were individually housed and were allowed free access to water at all times, except during the daily testing session, which lasted approximately half an hour. They were maintained on a diet of laboratory monkey chow and fruit; feeding took place following testing. Apparatus The 6 monkeys were tested with the DADTA-VII (Discrimination Apparatus for Discrete Trial Analysis, Version VII) system, a microcomputer-based video control system that performs on-line collection of behavioral and electrophysiological data. This system, which has been described in detail by Cutcomb, Bolster, and Pribram (1981), consisted of an Apple II + microcomputer, a color video monitor, which was used to present computer-generated arrays of colored forms, and a response panel matrix. The panel matrix was composed of nine individual lucite panels, each measuring 7 cm square, arranged in a 3 x 3 matrix. The video monitor was positioned vertically, directly behind the panel array, so that individual stimuli appeared behind each of the response positions. The stimuli were presented so that they appeared centered in the response panels from the monkey's point of view. Each panel was hinged at the top so that it would move when pressed by the monkey. Panel presses were detected by microswitches positioned behind the bottom of each panel. The microswitch closures were input to the Apple via a parallel port and were registered by the computer on an interrupt basis, using machine language software routines. The timing of stimulus events and measurement of response latencies was controlled to I-msec accuracy by a real-time clock installed on the Apple. During each trial, the computer encoded the stimulus array that was presented, the panel where the target appeared, the stimulus and panel that were selected by the monkey, and the animal's RT to the nearest millisecond. These data, together with a cumulative record of the subject's accuracy, were simultaneously output to a file on one floppy disk of the Apple and to a dot matrix printer. Stimuli The stimuli were colored forms generated by the high-resolution graphics software of the Apple 11+ computer, presented in 3 x 3 arrays as described below. Two forms were used-a square 4 cm on each side, and the same shape rotated 45 0 to produce a "diamond. " This operation ensured
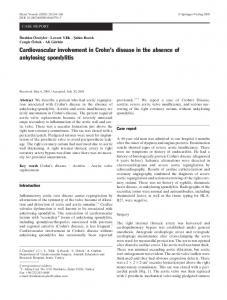
that stimuli were matched for area and contour. Each stimulus could be either red or green. The intensity levels were adjusted so that the stimuli were matched as closely as possible for luminance. The screen brightness was attenuated so that the stimuli appeared against a black background. At a viewing distance of 20 cm, the individual stimuli subtended 12 0 x 12 0 of visual angle, with the entire stimulus array subtending approximately 45 0 x 45 0 • The features chosen (red and green colors, square and diamond forms) were highly distinctive, to ensure that discriminability within feature dimensions was not a significant factor in performance. The stimuli were presented in 3 x3 arrays. The target stimulus was always a green square, and it always appeared somewhere in the array. The remaining eight positions in the array contained nontarget "distractor" stimuli. Two array types were presented. In distinct-feature arrays, all nontarget positions contained red diamonds-stimuli that shared neither color nor form with the target. In shared-feature arrays, some nontarget positions contained distractors that shared one feature-either form (red squares) or color (green diamonds)-with the target. The number of these sharedfeature distractors was systematically varied as described below. Examples of each of the two array types appear in Figure I. In this figure, the target appears in the center panel in each array, but during the experiment, the position of the target and distractor items varied from trial to trial as will be described below. Procedure During the daily testing session, the monkeys were restrained in a primate chair and sat within easy arm's reach of the panels and foodwell. The panel matrix was set in a sound and lightattenuating enclosure equipped with an adjustable houselight and
$ $ $ $ II $ $ $ $ Distinct-feature array
• • • ~ ~
II $
~
$
Shared-feature array _
Green
E3
Red
Figure 1. Examples of distinct-feature and shared-feature arrays, with the target (green square) shown in the central position.
YISUAL SCAN IN THE MONKEY viewing port. The primate chair was placed inside this enclosure so that the center panel was directly in front of the animal's eyes. Banana pellet rewards (Bio-Serv, 190 mg) were delivered to a foodwell centered directly below the panels. At the beginning of each trial, a small white circle appeared on the center panel and remained until the monkey initiated that trial by pressing the panel. Two hundred milliseconds after the panel press was detected by the computer, one of the arrays appeared for 50 msec. To obtain reward, the animal had to press the panel where the target stimulus, the green square, appeared. The position of the target was controlled by a pseudorandom series, providing equal probability of occurrence at each location within a daily session. Choice and RT were recorded on line by the computer. If the animal responded incorrectly, an identical array was presented on the next trial. Three consecutive incorrect responses to the same array resulted in the generation of a new array for the subsequent trial. If the monkeys failed to press any panel within 15 sec after the initiation of the trial, the trial was automatically reinitiated. Distinct-feature and shared-feature arrays appeared with equal frequency within a daily session. The two array types were presented in pseudorandom order across trials, with the order of presentation determined by a Gellerman series (equal numbers of each array type, with no more than three successive presentations of either type). A new Gellerman series was generated by the computer for each day's session. Randomization of array types across trials within a session was necessary, in order to minimize habituation and other changes of state of the organism that would adversely affect the analysis of ERLFPs in Experiment 2. The daily sessions thus included both array types presented in pseudorandom order. The monkeys were initially trained to choose 'the target, the green square, to a criterion of at least 75 % accuracy for three consecutive 54-trial sessions. During this phase, the number of sharedfeature distractors was held constant at six (three of each type), as depicted in Figure I. Following training, the number of shared-feature distractors in the conjunctive display was varied in pseudorandom fashion across daily sessions. Within a session, the number of these distractors present in the shared-feature array was constant at 2, 4, 6, or 8, with equal numbers of red squares and green diamonds. The subjects were tested for 5 days on each number of distractors.
507
1500
1400 >u
c v
E ""'c 0
~ v
1300
r--
~
1200
0:
1100
o
4
6
8
Number of distroctors
Figure 2. Response latency as a function of the number of sharedfeature distractors present in the stimulus array.
025 Number of Shared-Feature dislraclors o
020
a 0 o 2
(Distinct-Feature Array)
• 4 v 6
•
g
"0~
8
0.15
~
~
0
~
0.10
"
0:
EXPERIMENT 1 2500
Results Analysis of correct responses. The mean RT for hits (presses to the target stimulus) in the two array types are presented in Figure 2. Mean RTs were initially analyzed by using repeated measures analysis of variance (ANOYA). Latency for hits was significantly affected by array type [F(I,3055) = 87.97, p < .001]. Within shared-feature arrays, hit response latency was significantly affected by the number of sharedfeature distractors [F(3,1474) = 25.27, P < .001]. RTs for the shared-feature arrays were pooled across animals for regression analysis. The slope of the regression line (representing the average increase in response latency for each shared-feature distractor) was 60.5 msec, and the intercept value was 956 msec. The distribution of RTs across trials within each sharedfeature array is also of interest. To depict this aspect of the data in graphic form, the RTs on individual trials were pooled across subjects and grouped into bins of 120 msec. The resulting histograms, which appear in Figure 3, show the proportion of correct responses occurring at each la-
Response Latency (msec)
Figure 3. Effects of array composition on the frequency distribution of latency to correct response.
tency interval for shared-feature arrays with 2,4,6, and 8 distractors. Figure 4 depicts RT as a function of the stimulus item chosen. These data were collected during the training period, when the number of distractors in the shared-feature array was held constant at six (three of each type). Errors during training reflected distraction by the number of items within the stimulus array. In the posttraining phase of the experiment, the number of shared features varied from day to day. Thus between arrays, variability was confounded with intraarray effects (see Brody, Ungerleider, & Pribram, 1977). Figure 4 shows that RTs varied systematically as a function of the stimulus chosen. Targets were selected most rapidly from the distinct-feature arrays. Longer latencies
508
BOLSTER AND PRIBRAM
2000
arrays were chosen much more often than non-sharedfeature distractors. These results are consistent with results obtained with humans and thus make plausible the use of monkeys as models for examining the extent of cortex involved in distinguishing between responses to distinct-feature and to shared-feature arrays.
~
1750
EXPERIMENT 2
o ~ v '"
1500
2500
~
Shared-feature array
~
Distinct-feature array
2250
~
v
:§ c
Method
1250
GRN SO
GRN DIA
RED SO
RED DIA
Stimulus type
Figure 4. Response latency as a function of stimulus choice. Only presses to target (green square) stimuli were reinforced.
characterized erroneous responses, with green diamonds having the shortest latency, followed by red squares, and finally by red diamonds in both types of arrays. It is interesting that in both array types red diamond errors occurred with relatively long latencies even though they were the only distractors present in the disjunctive array. Errors made to other distractors in the shared-feature array task occurred at latencies intermediate between the mean RTs to green diamonds and those to red squares. Thus RT was positively related to the feature "similarity" between the distractor item and the target: Of the two shared-feature distractors, green diamonds yielded faster responses than did red squares, suggesting dominance of color over form, a phenomenon that is also reflected in the frequency with which these distractors were chosen, as noted below. Accuracy. The mean accuracy level during the posttraining period was 86 %. Significantly more errors occurred with shared-feature arrays, where the mean accuracy was 77%, than for distinct-feature arrays, where the mean accuracy was 95% [t(41) = 6.16, p < .001]. Within shared-feature tasks, the mean number of responses per day to green diamonds was 3.5, to red squares 2.5, and to red diamonds 0.3. There were thus significantly more incorrect responses to stimuli sharing one feature with the (green square) target than there were to red diamonds, which shared neither color nor form with the target [t(41) = 7.66, p < .001]. The difference in error rate for the two types of shared-feature distractor was not statistically significant. Summary Targets were identified more rapidly when presented in distinct-feature than in shared-feature arrays. Mean RT to targets in shared-feature arrays was linearly related to the number of shared-feature distractors presented. Error rates were higher for shared-feature than for distinctfeature arrays, and shared-feature distractors in these
Procedure. To facilitate recording of stimulus-evoked potentials, in this experiment the monkeys were required to withhold their responses for 750 msec. Failure to press any panel within 15 secs after trial initiation caused the trial to restart. Event-related local field potential (ERLFP) differences were recorded from implanted transcortical electrodes while monkeys performed the tasks developed in Experiment I. The stimuli were computer-generated arrays of colored forms, presented for 50 msec. The monkeys were rewarded for responding to a green-square target. As in Experiment I, two array types were used. In the distinctfeature arrays, all nontarget stimuli were red diamonds, whereas in the shared-feature arrays, nontarget stimuli could share either form (red square) or color (green diamond) with the target. Arrays with and without shared features appeared with equal frequency within a daily session. The two array types were presented in pseudorandom order across trials, providing for 54 correct responses (6 to each of the nine panel positions) for each display type and yielding a total of 108 correct trials in a daily session. This was double the number of daily trials used in Experiment I, assuring more stable average ERLFPs. Randomization of array types across trials within a session was done to minimize variance within the ERLFPs. If this had not been done, array-related ERLFP effects might have been confounded by order effects, whether systematic or random. If a particular array type had been repeatedly presented, habituation would have occurred, with progressive diminution of ERLFP amplitude across trials. This would have complicated the interpretation of "average" ERLFP waveforms. By contrast, the randomization procedure disrupted habituation by frequent and unpredictable changes of array types. Surgery. Electrode implantation was performed under aseptic conditions. The animals were given two prophylactic doses of penicillin by intramuscular injection, the first following induction of anaesthesia, and the second, 24 h later. General anaesthesia was induced by injection of a I: I mixture of ketamine (I()() mg/ml) and xylazine (20 mg/ml) (0.2 ml/kg) and maintained via tluothane inhalation. Bipolar insulated stainless steel electrodes were implanted through burr holes in the skull. The electrodes, (Frederick Haer, No. 17-2) were of a coaxial configuration with a 2-mm separation between the exposed portions of the tip and barrel. They were inserted so that the barrel was in the superficial layers of cortex and the tip made contact with the white matter. When the electrodes are implanted in this manner, differential amplification across the electrode contacts records potentials between depth and surface of the cortex. Electrodes were implanted bilaterally in seven cortical regions. These placements, together with the stereotaxic coordinates in the anterior/posterior (A/P) plane (relative to the interaural line), are listed in Table I. These placements are shown diagrammatically in Figure 5. The striate electrode was placed on the anterior lateral surface of area 17 in the region of the foveal projection. At the time of surgery, the electrode leads were connected to miniature multiplex plugs (Winchester, 29-pin) that were permanently attached to the skull with dental acrylic. One plug location was connected to a stainless steel screw threaded into a blind hole in the skull.
VISUAL SCAN IN THE MONKEY Table 1 Electrode Placements, With Stereotaxic Coordinates Electrode Implant Coordinates Striate (A/P) -13-15.0 mm Ventral prestriate (A/P) -5.0 mm Inferior parietal* (A/P) -0.5 mm Posterior inferotemporal (A/P) + 4.0 mm Anterior inferotemporal (A/P) + 12.0 mm Precentral gyrus (A/P) +20.0 mm Lateral frontal (A/P) +30.0 mm Note-A/P, anterior/posterior plane (relative to the interaural line). *Implanted in one animal (Harlow) only.
precentral
Figure S. Lateral view of macaque cerebral hemisphere, showing implant sites for transcortical electrodes.
Recording protocol. During recording sessions, the head plug was connected through "mininoise" shielded cables to a two-stage multiple-channel differential amplifier. Potentials were recorded differentially between the tip and barrel of the individual electrodes. The skull screw was used as a common reference (animal ground) for the preamplifiers. All shields in the cables were connected to the animal ground to minimize electrical artifacts arising in the cables. Cutoff frequencies of the high-pass and low-pass filters were set at 0.2 Hz and 50 Hz, respectively. Data were collected simultaneously from five electrodes during a single recording session. We recorded for 5 consecutive days from a single set of electrodes, at the same gain settings for each amplifier, before switching to another set of electrodes. We then adjusted the amplifier gains for the new electrode set (to adjust output voltage to the input band of the A/D converter) and recorded for a second 5-day series, keeping the amplifier settings constant across days at the new values. Digitization of the electrocorticogram was conducted on line by a PDP-ll/34 computer. Digitization was time-locked to the stimulus presentation, beginning when the monkey pressed the initiation cue, and continued for I sec. The sampling rate for digitization was 256 Hz. The digitized data were saved on magnetic disk. The stimulus array appeared for 100 msec, approximately 50 msec after the initiation cue was pressed. (The differences in procedure between this and Experiment I are due to the limitations of the different display systems used.) To obtain reward, the monkeys were required to withhold their response for at least 750 msec following trial initiation. The purpose for this delay was to ensure that stimulus-evoked brain activity was not contaminated by response events. Delivery of reward was delayed an additional 500 rnsec following correct responses. Responses at latencies less than 750 rnsec (which occurred infrequently) caused the initiation cue to reappear and the trial to restart. The digitization of such trials was automatically aborted by the computer.
509
Individual trials were coded according to the array presented, the panel pressed, and the stimulus chosen by the monkey. Only' 'correct" trials (when the monkey responded to the target) were saved for ERLFP analysis. Histology. Following completion of the experiment, the animals were anaesthetized by barbiturate injection, and low-level de current, insufficient to produce a lesion, was passed between the electrode tip and skull-ground screw, with the electrode tip acting as the anode. This procedure deposits iron from the stainless steel electrode in the region of the electrode tip. The animals were then perfused intracardially under deep barbiturate anaesthesia using physiological saline followed by formol saline containing potassium ferrocyanide. This substance reacts with deposited iron to yield a prussian blue stain (ferric ferrocyanide) concentrated at the position of the electrode tip (Brown & Tasaki, 196\). After hardening in formol saline/potassium ferrocyanide solution, the brains were removed and photographed to identity the sites of electrode penetration. The brains were then mounted in albumin, and frozen sections of 4O-1L thickness were taken through the electrode sites in the coronal plane. Mounted sections were counterstained with neutral red to offset the blue reaction product. Visual examination of the mounted coronal sections established the depth of electrode placement. Only electrodes that were correctly placed across the layers of the cerebral cortex in the target region are reported here.
Results Records from individual trials were initially sorted according to array type. Data were normalized by subtracting the mean voltage of the first six data points (24 msec) from the entire I-sec record, thus removing the dc offset. Artifacts were removed by rejecting trials with more than eight contiguous out-of-range values. The potentials were then averaged across trials within array type, yielding a distinct-feature and a shared-feature average for each electrode. Averaging was done on records collected within each daily running session, so that the stability of the ERLFP across days could be monitored. Averaged plots for the distinct-feature and sharedfeature arrays were superimposed to highlight eventrelated activity. Data from the 3 animals are presented in Figures 6-11. In each figure, data from 2 consecutive running days are presented, in order to illustrate the replicability of the ERLFPs. Initial inspection of these data revealed two phenomena. One was that the general shape of the ERLFP was clear-cut and extremely stable from day to day within any individual electrode recording. The second was that the form of the ERLFP differed markedly from electrode to electrode. Generally, the briskest stimulus-evoked activity was recorded at the striate electrodes at 50-100 msec poststimulus. Very little stimulus-evoked activity was recorded at the precentral cortex, as would be expected from the visual nature of the task. ERLFPs from inferotemporal parietal and frontal cortex tended to be smaller in amplitude and varied considerably in waveshape from electrode to electrode. To determine the statistical significance of ERLFP differences related to array type, the potentials were divided into latency bins of 100 msec. The ERLFPs related to the two array types were compared by using the mean am-
510
BOLSTER AND PRIBRAM Monkey: Molly
Day I
Day 2
STRIHE - R
lOW
"
~,y;0~~~ .,
PRESTRIATE - L
lW.
PRESTRIATE - R
lOW.
PRECENTRAL - R
Distinct-feature array Shareo-feature array
~
100 MSEC
I lW
Figure 6. Averaged transcortical potentials evoked by distinct-feature and shared-feature arrays in monkey MoUy. Electrode placements are in projection cortext. Potentials are generally not sensitive to array type. Each ERLFP represents an average of 54 trials from a single running day. Two consecutive running days are depicted, to demonstrate replicability of the ERLFP waveforms.
plitude for each latency window, in a repeated measures ANOVA. Tests of significance were made at each latency bin, using the Scheffe procedure for mUltiple pairwise comparisons. To reduce the number of comparisons to a manageable number, only the latency range from 0 to 600 msec poststimulus was subjected to analysis. Significant array-related differences identified by this procedure are marked with asterisks on the plots depicted in Figures 6-11. Event related differences, like the ERLFPs themselves, were well replicated across days within a "given electrode. However, array-related ERLFP differences appeared only at certain cortical locations. At the striate cortex, there were no significant array-related dif-
ferences in any of the 3 animals, despite brisk stimulusevoked activity in each case. A very different set of results was obtained from the inferotemporal (IT) cortex. At the IT sites, array-related differences appeared in all 3 animals. These differences were replicated across days, notwithstanding the somewhat weaker and more variable nature of IT stimulus-evoked activity. These differences occurred in the latency range of 200-500 msec poststimuIus, and were most pronounced at the most active electrodes-that is, those with relatively high-amplitude spontaneous activity. Significant array-related differences were noted at the anterolateral frontal electrodes in all 3 monkeys, although
VISUAL SCAN IN THE MONKEY
511
Monkey: Chow Day I
Day 2
I
STRIATE - L
lOW.
,',
I
\.
STRIATE - R
lOW.
PRESTRIATE - L
lOW.
PRECENTRAL - L
Distinct-feature array Shared-feature array
H
100 NSEC.
I
IW.
Figure 7. As in Figure 6, monkey Chow.
these differences were both prominent and well replicated only in one animal (Molly). These differences also appeared in the latency range from 200 to 500 msec poststimulus. In one animal (Harlow) with an inferoparietal implant, significant array-related differences from this electrode were seen in the 300- to 4OO-msec latency bin. Both the overall waveshape and event-related difference were well replicated across days.
Post Hoc Analysis In the previous section, we described a parametric analysis that was an a priori, omnibus test producing a conservative estimate of the amount of event- or array-related activity present in the ERLFPs. However, we were also interested in the possibility that significant event-related
differences as reflected in the averaged ERLFPs might arise from the additive contribution of two or more independent factors in the electrocorticogram. We therefore elected to subject a subset of the data to principal components analysis. The use of an LSI-ll/34 computer, the only one available for processing the data, imposed severe constraints on memory and processing speed, precluding exhaustive use of multivariate analysis. Therefore, we selected a single electrode analysis and replicated the analysis on data from 2 successive days as a test for reliability. The right posterior inferotemporal electrode in the monkey Chow was selected, since this electrode showed the highest amplitude of evoked activity among all inferotemporal electrodes and in addition exhibited large, significant, and reliable arrayrelated ERLFP differences.
512
BOLSTER AND PRIBRAM Monkey: Harlow Day 2
Day I
~ ~ , ' ......
STRIATE - L
I
lOW:
PRESTRIATE - L
lOW.
rv~ ,
,
'
'.
"
PRESTRIATE - R
lOW.
" ,-' " ,.-/\1' \VI ~ ... '
PARIETAL - L
,
Distinct-feature array Shared-feature array
" ~, ,
" "
] H
100 MSEC.
lOW.
Figure 8. As in Figure 6, monkey Harlow. Note significant array-related ERLFP differences at the inferior parietal electrode.
To prepare the data for analysis, we reduced the number of latency bins from 250 in the raw records to 25, so that each latency bin contained the mean amplitude for a 40-msec epoch. This was necessary in order to reduce the number of variables in the principal components analysis (and it also had the effect of smoothing the records). Following the recommendations of Donchin (1966), principal components analysis was then performed on the latency covariance matrix of this data set, with trials (108 per session) as the random variable. The first two factors extracted from the 1st day's recording are depicted in Figures 12 and 13. These two ~omponents accounted for 28 % and 17 % of the total variance, respectively. Figures 14 and 15 depict the first two factors extracted from the next day's recording from the
same electrode (file DCG037). These two factors accounted for 23% and 15% of the total variance. The analysis identified one component with peak activity in two latency ranges. The first of these occurs in the 300- to 4OO-msec interval, a latency range associated with "selection negativity" in human visual ERLFP experiments (see below). The second peak, of opposite polarity, was maximal at approximately 700 msec poststimulus. A second component was a very late slow negative potential commencing at 800 msec poststimulus. This event is reminiscent of the transcortical negative potentials (TNVs) associated with intention to respond (Donchin, Otto, Gerbrandt, & Pribram, 1971) and is related to the fact that the monkeys were required to withhold their responses for at least 750 msec poststimulus. Note
VISUAL SCAN IN THE MONKEY
513
Monkey: Molly Day 2
Day I
IT ANTER lOR - L
10M!.
~~ I
.I.
IT ANTERIOR - R .
10M!.
. ij~
IT POSTER lOR - L.
FRONTAL - R
Distinct-feature array Shared-feature array
H
100 MSEC..
1M!
Figure 9. Averaged transcortical potentials evoked by distinct-feature and shared-feature arrays in monkey Molly. Electrode placements are in association cortex. Potentials are sensitive to array type.
that the component structure identified in this analysis was well replicated when the analysis was repeated on data from a 2nd day. Summary ERLFPs were recorded from implanted transcortical electrodes while monkeys performed a task in which they were presented computer-generated 3 x 3 arrays of colored forms. The targets were always green squares, appearing among distractor arrays of two types. In distinctfeature arrays, nontarget distractors were always red squares. In shared-feature arrays, three distractors (green diamonds) shared color with the target, three (red squares) shared form with the target, and the remaining two stimuli were red diamonds. Transcortical potentials evoked by the two array types differed significantly at the in-
ferotemporal, inferoparietal, and lateral frontal cortex, but did not differ at the striate, prestriate, or precentral cortex. Event-related differences were maximal at latencies from 250 to 600 msec poststimulus. DISCUSSION The results of Experiment 2 show that-within the limits of these studies-when RTs are prolonged during the performance of discrimination tasks, differences in ERLFPs can be recorded from intrinsically connected association cortex and not from projection cortex. Furthermore, such differences were obtained from all locations within the intrinsic cortex from which recordings were made. This suggests that more than one single process is responsible for the increase in RTs.
514
BOLSTER AND PRIBRAM Monkey: Chow Day I
Day 2
IT liNTER IOR - R
IW
IT POSTER IOR - L.
IW.
IT POSTER IOR - R
FRONTIIL - L
lOW
Distinct-feature array Shared-feature array
f----j 100 MSEC..
IW.
Figure 10. As in Figure 9, monkey Chow.
In view of the fact that three separate cortical areas are implicated, it is reasonable to ask whether at least three factors responsible for the increase in RTs can be identified. The first and most accessible of such factors is that due to the involvement of the parietal cortex. This cortex has been shown to be involved in the processing of extrapersonal space in monkeys (Brody & Pribram, 1978; Mountcastle, Lynch, Georgopolous, Sakata, & Acuna, 1975; Pohl, 1973; Pribram & Barry, 1956; Wilson, 1957) and in humans (Posner, Walker, Friedrich, & Rafal, 1984). In the present experiments, the location of all cues was changed from trial to trial. There is therefore every reason to expect a correlation between the difficulty of the task (as expressed in RTs) and location search. In addition, the difficulty in location search was a function of the composition of a distractor set. In earlier experiments, we found that the performance of monkeys
with far frontal resections suffers when the location of distractors is randomized over nine positions as in the DADTA used in the current experiments. This deficiency becomes especially apparent when compared with performance in the Wisconsin General Testing Apparatus (WGTA), which limits randomization to two locations (Brody & Pribram, 1978; Brody et aI., 1977; Pribram, Konrad, & Gainsburg, 1966). The nine-location randomization was instituted to deter monkeys (especially those with far frontal resections) from falling into position habits. In this, the technique was successful but the changes in location of a cue pose an especially potent distractor for monkeys (Douglas & Pribram, 1969), especially those with far frontal damage (Grueninger & Pribram, 1969). Thus, in the present experiments, one source of difficulty is the fact that manipulations were made of the distractor set.
VISUAL SCAN IN THE MONKEY
515
Monkey: Harlow Day 2
Day I
IT ANTERIOR
IT POSTERIOR - L
IW.
FRONTAL - L
FRONTAL - R
1QJ-V.
Distinct-feature array Shared-feature array
H
100 NSEC..
lOW.
Figure 11. As in Figure 9, monkey Harlow.
A distractor set provides the context-the contingencieswithin which the rewarded target has to be chosen. Fuster (1988) conceptualized this context-reward relationship in terms of cross-temporal contingencies. However, experiments in our laboratory in which spatial context is manipulated, as in variants of object constancy tasks (Anderson, Hunt, Vander Stoep, & Pribram, 1976), showed that the relationship can be spatiotemporal as well as temporotemporal. In fact, in other experiments (Brody & Pribram, 1978; Pribram, Plotkin, Anderson, & Leong, 1977), we presented data that showed far frontal involvement whenever behavior was influenced by two or more distinct sets of covarying contingencies, even when both were spatial. More generally, therefore, the far frontal cortex becomes implicated whenever perception entails relating
current contingencies to a context computed from prior relevant contingencies. The computation of this covariation demands that cross-temporal, spatiotemporal, and cross-spatial contingencies be perceived. In classical and operant conditioning, the consequences of behavior are contiguous in time and place with the stimulus conditions that initiate the behavior. When contiguity is loosened, stimulation that intervenes between initiation and consequence has the potential to distract and thus to prevent the processing of covariation. Perception is perturbed and processing is destablized. Perturbation is controlled only if a stable state, an established set of contingencies, that is, a stable context, instructs and directs the process (Pribram, 1987). It is from the effects of interference on the establishment of such a stable state that one is able to discern the
516
BOLSTER AND PRIBRAM 1.500
MonKey: Chnw R~(on..1:
1.000
'"
c '0 o o -J ~
o
Day I
EI~(tnw..k:
IT Posterior - R.
0.500 0.000 t-"......~-----'T-------;l"-=,L--------
-0
~ -0.500
-1.000
First Component
-1.500 + - - - - + - - - + - - - - + - - - - t - - - - - - - i 200 400 600 800 1000
Latency (msec) Figure 12. Firm component extracted by principal components factor analysis of 108 single-trial, ERLFPs from one electrode (posterior inferotemporal, right hemisphere) in a single testing session (Day 1 of Figure 10). Vertical axis values are factor loadings for each latency bin.
1.500 1.000 c '"
'0 0
Monkey: Chow ReL"ord: Day I Electrode: IT Posterior - R.
scribed by Kinsbourne and Wood (1975), show that the impairment in processing serial position is due to a derangement of the set of covarying contingencies, the contextual structure of an episode. To summarize our view of the involvement offar frontal cortex in visual scans of shared-feature arrays: Trial by trial changes in the distractor set disrupt the generation of a stable state within which search for the rewarded target can be performed. This state is characterized as a variable mapping (Schneider & Shiffrin, 1977) of an established context of covarying contingencies. In Efron's terms, this context forms a flexible, yet stable, scanplan. But task difficulty in the situations used in the current experiments is not primarily due to the location of cues or to the effect of failure to process a distractor set into a scanplan. Rather, as shown by the correlation between RTs and the type of stimulus chosen in Experiment 1, it is the colors and forms in the distractor set that determine difficulty reflected in the duration of the scanning process. As has repeatedly been documented, the color and form of objects is processed by an inferior temporal lobe
0.500
0
-J
2u
1.500
Monkey: Chow
1.000
Record: Day 2 Electmde: IT Posterior - R.
0.000
0 "- -0.500
'"
c '0
Second Component
-1.000
0 0
-J ~
0
-1.500 200
400
600
800
1000
0.500 0.000
-0
0 "- -0.500
Latency (msec)
-1.000
Figure 13. As in Figure 12, second component.
-1.500 200
powerful role of context in controlling trial-unique, episodic processing. When the interfering effect of distractors is removed (e.g., by darkening the testing chamber) during trial-unique tasks such as delayed response, monkeys with far frontal resections perform the task as well as their controls (Malmo, 1942; Pribram, 1961). The effects of interference occur primarily during stimulus presentation or shortly thereafter, not during the delay period (Pribram, 1961; Stamm, 1969). Interference therefore affects the organization of a perceptual context within which subsequent performance occurs. The impairment is also shown by patients with damage to their frontal cortex. These patients fail to remember the place in a sequence in which an item occurs: The patients lose the ability to "temporally tag" events-that is, to place them within the episode. With such patients, Milner (1974; see also Petrides & Milner, 1982) performed a series of experiments demonstrating how the processing impairment affects the middle portions of an episode. In her studies, it is relative recency, the serial position of the covarying contingencies, that becomes muddled. Other patients with frontolimbic damage, de-
I
I
400
600
800
1000
Latency (msec)
FJgIII'e 14. Firm component extracted by principal components factor analysis of 108 single-trial ERLFPs from the same electrode (posterior inferotemporal, right hemisphere) in the subsequent testing session (Day 2 of Figure 10). Vertical axis values are factor loadings for each latency bin. Note that the wavefonn replicates the first component of the previous day's testing session.
1.500
Monkey: Chow
1.000
Record: Day 2 Electrode: IT Posterior - R.
'" 0.500 ~ o
.3~ o
-0
~
0.000 +--:;=7"'''----'>...
=-~---;;_'''''''',_:;;;;,...e:=-~..L----
-0.500 -1.000
Second Componeol
-1.500+----+-----t---+----+--------i 400 200 600 800 1000
Latency (msec) Figure IS. As in Figure 14, second component.
VISUAL SCAN IN THE MONKEY
517
system (Blum, Chow, & Pribram, 1950; Mishkin, 1966; the inferotemporal cortex altered bias (13) toward risk. Mishkin, Ungerieider, & Macko, 1983; Pribram, 1954; Thus, eye movements do not become permanently stuck Pribram & Mishkin, 1955) rather than a parietal lobe sys- but range widely only to become repeatedly captured by tem (Brody & Pribram, 1978; Pribram & Barry, 1956; one or another cue. Bias with regard to temporal lobe function depends not Wilson, 1957). This temporal lobe process thus forms the focus of our interest in the present experiments. It is with only on the feature properties of the stimulus: As was regard to the temporal lobe system that the identification shown in behavioral experiments, on task parameters such as the successive versus the simultaneous presentation of of leatural factors is most cogent. However, when monkeys are markedly overtrained, cues (Pribram & Mishkin, 1955) and the competencies ERLFPs related (1) to which panel is pressed and (2) to achieved in the situation through learning (Pribram & correct or incorrect choice are reflected in the recordings McGuinness, 1975, 1992). In short, fluidity in scan apmade not from the inferotemporal but from the striate and pears to reflect a more basic process such as comprehenfrom the precentral motor cortex (Bridgeman, 1982; sion, the competence to grasp (prehend) the demands of Pribram, Spinelli, & Kamback, 1967; Rothblat & the situation. (For a detailed review, see Pribram, 1991, Pribram, 1972). In these experiments, the monkeys were Lecture 7.) given more than 6 months of training in tasks such as those In conclusion, on the basis of brain electrical recordings used in the present experiments and, additionally, repeated made in monkeys performing discrimination tasks, autodiscrimination reversal procedures have been mastered matic processing was found to be refleCted in the records (e.g., the red diamond becomes the rewarded target cue obtained from primary sensory and motor systems. and then the green diamond; the red square and again the As measured by (1) eye movement (scan), (2) behavgreen square; etc.). Mean RTs were not recorded, but ioral reaction time, and (3) brain electrical activity, conincidental observation and error scores suggest that when trols on processing can be related to at least three putaperformance becomes sufficiently automated, the sensory- tive factors. The parietal, far frontal, and temporal cortex, motor projection systems reflect this automaticity. respectively, have been identified to help organize stimWith regard to the temporal lobe system, studies of eye ulus sampling on the basis of (I) location search, (2) genmovement in our laboratory have been most productive erating a scanplan to deal with the covarying contingenwith regard to exploring the factors controlling scan. Bag- cies that characterize a shared-feature distractor set, and shaw, Mackworth, and Pribram (1970) showed that the (3) bias leading to attentional fluidity (not to be confused ordinary relatively random sampling of objects or patterns with automaticity). The most enigmatic of these factors in a discrimination procedure is markedly slowed by resec- is bias: fluidity in sampling apparently depends on comtion of the inferotemporal cortex. Whenever a novel cue prehending not only the featural factors that directly deor one that was a part of the discrimination was fixated, termine the outcome of a search but ancillary task paramvisual capture occurred; that is, eye movements seemed eters and prior experience, as well. to become "stuck" on the cue. (Randomization of the poREFERENCES sition of cues and distractors alleviated this "stickiness" in the attentional process; Brody et al., 1977.) Ungerleider ANDERSON, J. A., HUNT, S. c., VANDER STOEP, A., 8< PRIBRAM, K. H. and Christiansen (1977, 1979) showed that similar cap(1976). Object permanency and delayed response as spatial context in monkeys with frontal lesions. Neuropsychologia, 14, 481-490. ture effects ensued lesions of the pulvinar, a thalamic BAGSHAW, M. H., MACKWORTH, N. H., 8< PRIBRAM, K. H. (1970). nucleus that has reciprocal connections with the inferotemThe effect of inferotemporal cortex ablations on eye movements of poral cortex on the one hand and with the superior colmonkeys during discrimination training. International Journal of liculus (optic tectum) on the other. Neuroscience, 1, 153-158. Slowing due to damage of the tectal-pulvinar-temporal BLUM, J. S., CHOW, K. L., & PRIBRAM, K. H. (1950). A behavioral analysis of the organization of the parieto-temporo-preoccipitaJ corlobe system is not due to impaired capacity for eye movetex. Journal of Comparative Neurology, 13, 127-135. ment: speed and competence in tracking, in saccades, and BRIDGEMAN, B. (1982). Multiplexing in single cells of the alert monso forth, remains unimpaired. Only when choices among key's visual cortex during brightness discrimination. Neuropsychologia, 20, 33-42. cues had to be made did the deficiencies show up. Recall also that the results obtained by Efron (1990) were in- BRODY, B. A., & PRIBRAM, K. H. (1978). The role offrontaJ and parietal cortex in cognitive processing: Tests of spatial and sequence funcdependent of eye movement-they were related to posttions. Brain, 101, 607-633. exposure processing. Thus, the results obtained with eye- BRODY, B. A., UNGERLEIDER, L. G., & PRIBRAM, K. H. (1977). The movement recording can be interpreted to reflect sloweffects of instability of the visual display on pattern discrimination learning by monkeys: Dissociation produced after resections of froning of a more centrally controlled process. Slowing in such tal and inferotemporal cortex. Neuropsychologia, 15, 439-448. centrally controlled processes necessary to choice can acK. T., & TASAICI, T. (1961). Localization of electrical activity count for the observations of Chalupa, Coyle, and Linds- BROWN, in the cat retina by an electrode marking method. Journal ofPhysiolley (1976) that damage to the pulvinar produces deficits ogy, 158, 281-295. in pattern discrimination when and only when cues are BUTTER, C. M. (1968). The effect of discrimination training on pattern equivalence in monkeys with inferotemporal and lateral striate flashed tachistoscopically. lesions. Neuropsychologia, 6, 27-30. A fmal point: In another set of experiments, using modiCHALUPA, L. M., COYLE, R. S., & LINDSLEY, D. B. (1976). Effect fied signal detection procedures, Pribram, Spevack, of pulvinar lesions on visual pattern discriminations in monkeys. JourBlower, and McGuinness (1980) showed that removal of nal of Neurophysiology, 39, 354-369.
518
BOLSTER AND PRIBRAM
CUTCOMB, S. D., BOLSTER, R. B., & PRIBRAM, K. H. (1981). DADTA VI: A minicomputer-based video control system for the analysis of behavioral and e1ectrophysiological data. Behavior Research Methods & Instrumentation, 13, 337-340. DONCHIN, E. (1966). A multivariate approach to the analysis of average evoked potentials. IEEE Transactions on Bio-Medical Engineering, BME-13, 131-139. DoNCHIN, E., OTTo, D., GERBRANDT, L. K., & PRIBRAM, K. H. (1971). While a monkey waits: Electrocortical events recorded during the foreperiod of a reaction time study. Electroencephalography of Clinical Neurophysiology, 31, 115-127. DOUGLAS, R. J., BARRETT, T. W., PRIBRAM, K. H., & CERNY, M. C. (1969). Limbic lesions and error reduction. Journal of Comparative & Physiological Psychology, 68, 437-441. DOUGLAS, R. J., & PRIBRAM, K. H. (1969). Distraction and habituation in monkeys with limbic lesions. Journal of Comparative & Physiological Psychology, 69, 473-480. EFRON, R. The decline and fall of hemispheric specialization (MacEachran Lectures). Hillsdale, NJ: Erlbaum. FUSTER, J. M. (1988). The prefrontal conex; Anatomy, physiology and neuropsychology of the frontal lobe (2nd ed.). New York: Raven. GRUENINGER, W. E., & PRIBRAM, K. H. (1969). Effects of spatial and nonspatial distractors on performance latency of monkeys with frontal lesions. Journal of Comparative & Physiological Psychology, 68, 203-209. K.JNSBOURNE, M., & WOOD, F. (1975). Short-term memory processes and the amnesia syndrome. In. J. A. Deutsch (Ed.), Shon term memory (pp. 257-291). New York: Academic Press. MALMO, R. B. (1942). Interference factors in delayed response in monkeys after removal of frontal lobes. Journal of Neurophysiology,S, 295-308. MILNER, 8. (1974). Hemispheric specialization: Scope and limits. Neurosciences, 4, 75-89. MISHKIN, M. (1966). Visual mechanisms beyond the striate cortex. In R. W. Russell (Ed.), Frontiers in physiological psychology (pp. 93119). New York: Academic Press. MISHKIN, M., UNGERLEIDER, L. G., & MACKO, K. A. (1983). Object vision and spatial vision: Two cortical pathways. Trends in Neuroscience, 6, 414-417. MOUNTCASTLE, V. 8., LYNCH, J. c., GEORGOPOWUS, A., SAKATA, H., & ACUNA, C. (1975). Posterior parietal association cortex of the monkey: Command functions for operations within extrapersonal space. Journal of Neurophysiology, 38, 871-908. NUWER, M. R., & PRIBRAM, K. H. (1979). Role of the inferotemporal cortex in visual selective attention. Electroencephalography & Clinical Neurophysiology, 46, 389-400. PETRIDES, M., & MILNER, B. (1982). Deficits on subject-ordered tasks after frontal and temporal-lobe lesions in man. Neuropsychologia, 20, 249-262. POHL, W. G. (1973). Dissociation of spatial and discrimination deficits following frontal and parietal lesions in monkeys. Journal of Comparative & Physiological Psychology, 82, 227-239. POSNER, M. I., WALKER, J. A., FRIEDRICH, F. J., & RAFAL, R. D. (1984). Effects of parietal lobe injury on covert orienting of visual attention. Journal of Neuroscience, 4, 1863-1874. PRIBRAM, K. H. (1954). Toward a science of neuropsychology (method and data). In R. A. Patton (Ed.), Current trends in psychology and the behavioral sciences (pp. 115-142). Pittsburgh, PA: University of Pittsburgh Press. PRIBRAM, K. H. (l960a). The intrinsic systems of the forebrain. In J. Field, H. W. Magoun, & V. E. Hall (Eds.), Handbook ofphysiology; Neurophysiology II (pp. 1323-1324). Washington, DC: American Physiological Society. PRIBRAM, K. H. (l960b). A review theory in physiological psychology. Annual Review of Psychology, 11, 1-40. PRIBRAM, K. H. (1961). A further experimental analysis of the behavioral
deficit that follows injury to the primate frontal cortex. Experimental Neurology, 3, 432-466. PRIBRAM, K. H. (1962). Discussion of Young's paper. In V. 8. Mountcastle (Ed.), Interhemispheric relations and cerebral dominance (p. 107). Baltimore: Johns Hopkins University Press. PRIBRAM, K. H. (1987). The subdivisions of the frontal cortex revisited. In E. Brown & E. Perceman (Eds.), Thefrontallobes revisited (pp. 1139). New York: IRBN Press. PRIBRAM, K. H. (1991). Brain and perception: Holonomy and structure in figural processing. Hillsdale, NJ: Erlbaum. PRIBRAM, K. H., & BARRY, J. (1956). Further behavioral analysis of the parieto-temporo-preoccipital cortex. Journal ofNeurophysiology, 19,99-106. PRIBRAM, K. H., KONRAD, K., & GAINSBURG, D. (1966). Frontal Iesions and behavioral instability. Journal of Comparative & Physiological Psychology, 62, 123-214. PRIBRAM, K. H., & MCGUINNESS, D. (1975). Arousal, activation and effort in the control of attention. Psychological Review, 82, 116-149. PRIBRAM, K. H., & MCGUINNESS, D. (1992). Attention and paraattentional processing: Event-related brain potentials as tests of a model. In D. Friedman & G. Bruder (Eds.), Psychophysiology and experimental psychopathology: A tribute to Samuel Sutton (Annals of the New York Academy of Science, Vol. 658, pp. 65-92). New York: New York Academy of Science. PRIBRAM, K. H., & MISHKIN, M. (1955). Simultaneous and successive visual discrimination by monkeys with inferotemporallesions. Journal of Comparative & Physiological Psychology, 48, 198-202. PRIBRAM, K. H., PLOTKIN, H. C., ANDERSON, R. M., & LEONG, D. (1977). Information sources in the delayed alternation task for normal and "frontal" monkeys. Neuropsychologia, 15, 329-340. PRIBRAM, K. H., SPEVACK, A. A., BLOWER, D., & MCGUINNESS, D. (1980). A decisional analysis of the effects of inferotemporallesions in the rhesus monkey. Journal of Comparative & Physiological Psychology, 94, 675-690. PRIBRAM, K. H., SPINELLI, D. N., & KAMBACK, M. C. (1967). Electrocortical correlates of stimulus response and reinforcement. Science, 157, 94-96. ROTHBLAT, L., & PRIBRAM, K. H. (1972). Selective attention: Input filter or response selection? An electrophysiological analysis. Brain Research, 39, 427-436. SCHNEIDER, W., DUMAIS, S. T., & SHIFFRlN, R. M. (1984). Automatic and control processing and attention. In R. Parasuraman & W. R. Davies (Eds.), Varieties of attention (pp. 1-27). Orlando, FL: Academic Press. SCHNEIDER, W., & SHIFFRlN, R. N. (1977). Controlled and automatic human information processing: I. Detection, search, and attention. Psychological Review, 34, 1-66. STAMM, J. S. (1969). Electrical stimulation of monkeys' prefrontal cortex during delayed response performance. Journal ofComparative & Physiological Psychology, 67, 535-546. UNGERLEIDER, L. G., & CHRISTENSEN, C. A. (1977). Pulvinar lesions in monkeys produce abnormal eye movements during visual discrimination training. Brain Research, 136, 189-196. UNGERLEIDER, L. G., & CHRISTENSEN, C. A. (1979). Pulvinar lesions in monkeys produce abnormal scanning of a complex visual array. Neuropsychologia, 17, 493-501. WILSON, M. (1957). Effects of circumscribed cortical lesions upon somesthetic and visual discrimination in the monkey. Journal ofComparative & Physiological Psychology, SO, 630-635. YOUNG, J. Z. (1962). Why do we have two brains? In V. B. Mountcastle (Ed.), Interhemispheric relotions and cerebral dominance (pp. 724). Baltimore, MD: Johns Hopkins University Press.
(Manuscript received August 21, 1989; revision accepted for publication September 14, 1992.)