Dec 22, 2010 - in making connections with their cortical targets. ..... Stokes, C. C. & Isaacson, J. S. From dendrite to soma: dynamic routing of inhibition .... carried out in Adobe Illustrator in a scalable vector graphics (SVG) format. The. SVG file ...
ARTICLE
doi:10.1038/nature09714
Cortical representations of olfactory input by trans-synaptic tracing Kazunari Miyamichi1, Fernando Amat2, Farshid Moussavi2, Chen Wang3, Ian Wickersham4{, Nicholas R. Wall4, Hiroki Taniguchi5, Bosiljka Tasic1, Z. Josh Huang5, Zhigang He3, Edward M. Callaway4, Mark A. Horowitz2 & Liqun Luo1
In the mouse, each class of olfactory receptor neurons expressing a given odorant receptor has convergent axonal projections to two specific glomeruli in the olfactory bulb, thereby creating an odour map. However, it is unclear how this map is represented in the olfactory cortex. Here we combine rabies-virus-dependent retrograde mono-trans-synaptic labelling with genetics to control the location, number and type of ‘starter’ cortical neurons, from which we trace their presynaptic neurons. We find that individual cortical neurons receive input from multiple mitral cells representing broadly distributed glomeruli. Different cortical areas represent the olfactory bulb input differently. For example, the cortical amygdala preferentially receives dorsal olfactory bulb input, whereas the piriform cortex samples the whole olfactory bulb without obvious bias. These differences probably reflect different functions of these cortical areas in mediating innate odour preference or associative memory. The trans-synaptic labelling method described here should be widely applicable to mapping connections throughout the mouse nervous system. The functions of mammalian brains are based on the activity patterns of large numbers of interconnected neurons that form information processing circuits. Neural circuits consist of local connections— where pre- and postsynaptic partners reside within the same brain area—and long-distance connections, which link different areas. Local connections can be predicted by axon and dendrite reconstructions1, and confirmed by physiological recording and stimulation methods2. Long-distance connections are more difficult to map, as commonly used methods can only trace bulk projections with a coarse resolution. Most methods cannot distinguish axons in passing from those that form synapses, or pinpoint the neuronal types to which connections are made1,2. Trans-synaptic tracers can potentially overcome these limitations2. Here we combine a retrograde rabies-virusdependent mono-trans-synaptic labelling technique3 with genetic control of the location, number and cell type of ‘starter’ neurons to trace their presynaptic partners. We systematically mapped longdistance connections between the first olfactory processing centre, the olfactory bulb, and its postsynaptic targets in the olfactory cortex including the anterior olfactory nucleus (AON), piriform cortex and amygdala (Supplementary Fig. 1).
Genetic control of trans-synaptic tracing Rabies virus can cross synapses from postsynaptic to presynaptic neurons with high specificity4, without notable defects in the morphology or physiology of infected neurons for extended periods of time3,5. Recent genetic modifications of rabies virus have permitted mono-trans-synaptic labelling3. Specifically, the rabies envelope glycoprotein (G) required for viral spread was replaced with a fluorescent marker6. Further, the virus was pseudotyped with EnvA, an avian virus envelope protein that lacks an endogenous receptor in mammals, and thus cannot infect wild-type mammalian cells. However, it can infect cells expressing the EnvA receptor TVA, and can subsequently produce infectious particles if TVA-expressing cells also
express G to complement the DG rabies virus (Fig. 1a, bottom). The new viral particles can cross synapses to label presynaptic partners of starter neurons. As trans-synaptically infected neurons do not express G, the modified virus cannot spread from them to other neurons. Paired recordings in cultured brain slices support the efficacy and specificity of this strategy3. To extend this method to a limited number of starter cells of a defined type and at a precise location in vivo, we combined mouse genetics and viral infections (Fig. 1a, b). We created a transgenic mouse (CAG-stop-tTA2) that conditionally expresses the tetracycline transactivator tTA2 under the control of a ubiquitous CAG promoter only upon Cre-mediated excision of a transcriptional stop cassette. After crossing these mice with transgenic mice expressing the tamoxifeninducible Cre (CreER), a small fraction of CreER1 cells also express tTA2 following tamoxifen induction. We then used stereotactic injections to deliver into specific regions of the brain an adeno-associated virus (AAV) serotype 2 expressing three proteins: histone–GFP, TVA and G, under the control of a tetracycline-response element (TRE). Expression of TVA and G allows infected, tTA21 cells to be receptive to infection by the modified rabies virus, which we injected into the same location two weeks later. We define starter cells as those infected by both AAV and rabies virus, and therefore labelled by both histone– GFP and mCherry; their presynaptic partners are infected only by rabies virus and therefore express only mCherry. We tested our strategy by using a ubiquitously expressing actinCreER7 in combination with CAG-stop-tTA2 in the neocortex. Starter cells could be unambiguously identified by histone–GFP expression (Supplementary Fig. 2). In all but one case, we observed more than one starter cell (Supplementary Fig. 3 shows the example of a single starter cell). In a typical example, 35 starter cells in the motor cortex expressed histone–GFP and mCherry (Fig. 1c (3)), demonstrating that AAV and rabies virus can infect the same cells in vivo. In addition to many locally labelled cells (Fig. 1c (1)), mCherry1 cells were
1
HHMI/Department of Biology, Stanford University, Stanford, California 94305, USA. 2Department of Electrical Engineering, Stanford University, Stanford, California 94305, USA. 3Department of Neuroscience, Children’s Hospital, Boston, Massachusetts 02115, USA. 4Systems Neurobiology Laboratory, The Salk Institute for Biological Studies and Neurosciences Graduate Program, University of California, San Diego, La Jolla, California 92037, USA. 5Cold Spring Harbor Laboratory, New York, New York 11724, USA. {Present address: HHMI/Department of Brain and Cognitive Sciences, Massachusetts Institute of Technology, Cambridge, Massachusetts 02139, USA. 0 0 M O N T H 2 0 1 0 | VO L 0 0 0 | N AT U R E | 1
©2010 Macmillan Publishers Limited. All rights reserved
RESEARCH ARTICLE a
AON maintains the dorsal–ventral topography
b promoter
promoter-CreER
CreER
pA Tamoxifen
CAG-stop-tTA2
CAGp
stop
tTA2 pA
loxP
loxP AAV
AAV-TRE-HTG TRE histone-GFP 2A TVA 2A rabiesΔG-mCherry+EnvA
c
pA
rabiesΔG-mCherry+G
TVA
ΔG mC
G
G
Rabies
ΔG mC
+
+ EnvA ΔG Infection Complementation
Trans-synaptic labelling
Injection M1
(2)
(1)
Injected side
(4)
(5)
Contralateral side Injected side
Bregma +1.50 mm (1)
Contralateral side
(2) II/III
Bregma -1.05 mm II/III
(4)
(5) IV
Barrel
IV IV (3)
V V
V (3)
nGFP
VI
mCherry
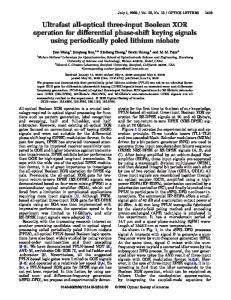
Figure 1 | Genetic control of rabies-mediated neural circuit tracing. a, b, Schematic representation of the methodology used to control the location, number and type of starter cells for rabies-virus-mediated trans-synaptic labelling. tTA2 is expressed in a small subset of CreER1 cells (grey nuclei in b). tTA2 activates an AAV-delivered transgene to express: (1) a histone–GFP marker to label the nuclei of starter cells in green; (2) EnvA receptor (TVA) to enable subsequent infection by EnvA-pseudotyped rabies virus (rabiesDGmCherry1EnvA); and (3) rabies glycoprotein (G) to initiate trans-synaptic labelling. c, Top left, a 60-mm coronal section that includes the injection site in the motor cortex (M1). Cells labelled with both histone–GFP (nGFP) and mCherry (arrowheads in c (1), magnified in c (3)) can be distinguished from cells labelled with mCherry alone, which are found near the injection site (c (1)), in the contralateral motor cortex (c (2)), in the somatosensory barrel cortex (top right; magnified in c (4)), and in the motor-specific ventrolateral nucleus of the thalamus (c (5)). Scale bars, 1 mm for low-magnification images at the top, 100 mm for high-magnification images at the bottom.
enriched in layers II, III and V in the contralateral motor cortex (Fig. 1c (2)), consistent with layer specificity of callosal projections8. mCherry1 cells were also found in layers III and V of the ipsilateral somatosensory cortex (Fig. 1c (4)) and in motor-specific thalamic nuclei (Fig. 1c (5)), which are known sources of monosynaptic inputs to the motor cortex9. In all experiments, histone–GFP1 cells were found within 450 mm of the injection sites, consistent with a previous report that AAV serotype 2 predominantly infects neurons locally10. Omitting AAV or tamoxifen yielded no trans-synaptically labelled neurons (Supplementary Fig. 4). Moreover, our strategy labelled neurons only through synaptic connections but not through axons in passage (Supplementary Fig. 5). Finally, rabies virus spread was restricted to neurons directly connected to starter cells, and only in the retrograde direction (Supplementary Fig. 6). Together, these experiments validated our genetic strategy for retrograde mono-trans-synaptic labelling in vivo.
In the mouse, olfactory receptor neurons that express a single type of odorant receptor send convergent axonal projections to a specific pair of glomeruli in the lateral and medial olfactory bulb11–13. Odorants are detected by combinations of olfactory receptor neuron classes14, and are represented as spatiotemporal activity patterns of glomeruli15. Each mitral cell sends its apical dendrite to a single glomerulus and thus receives direct input from a single olfactory receptor neuron class. Mitral cell axons relay information to the olfactory cortex (Supplementary Fig. 1a). Previous axon tracing studies showed that individual mitral cells send axons to distinct cortical areas, and that small cortical regions receive broad input from the olfactory bulb16–19. However, understanding the principles underlying odour perception and odour-mediated behaviours requires systematic and quantitative analysis of connection patterns of mitral cells with their cortical target neurons. We first established that mitral cells throughout the olfactory bulb can be infected by rabies virus via their axons (Supplementary Fig. 7). We then applied our strategy (Fig. 1a, b) to specific areas of the AON, piriform cortex and cortical amygdala (Supplementary Fig. 1b), and examined the distribution of trans-synaptically labelled mitral cells. In a typical example, 11 clustered starter cells in the AON (Fig. 2a) resulted in 69 labelled mitral cells distributed widely across the olfactory bulb (Supplementary Fig. 8 and Supplementary Movie 1). Bright mCherry fluorescence from rabies virus allowed us to unequivocally follow the primary dendrites of the labelled mitral cells to single target glomeruli (Fig. 2b). Each mitral cell sent its apical dendrite into a single glomerulus. Four glomeruli were each innervated by two labelled mitral cells (Fig. 2b, right, and Supplementary Table 1). To quantitatively compare the patterns of labelled glomeruli from different animals, we established a three-dimensional (3D) reconstruction protocol for the olfactory bulb, and aligned each olfactory bulb to a standard olfactory bulb model (Fig. 2c). To test the accuracy of this procedure, we reconstructed and aligned olfactory bulbs from three P2-IRES-tauGFP transgenic mice20. These GFP-labelled glomeruli were located within a distance of a few glomeruli from each other (Supplementary Fig. 9), consistent with the natural variability of olfactory receptor neuron axon targeting21. This precision of our 3D reconstruction enables the comparison of olfactory bulbs from different animals. The AON has been proposed to provide feedforward modification of information from the olfactory bulb to the piriform cortex22. Little is known about its organization except for a small and distinct AON pars externa, which maintains dorsal–ventral olfactory bulb topography23–25. We injected AAV and rabies virus to different areas of the AON (Supplementary Table 1), and established an AON 3D-reconstruction protocol analogous to that for the olfactory bulb (Fig. 2c, left). Labelled glomeruli from AON injections were distributed widely in the olfactory bulb (Fig. 2c, middle). However, starter cells from the ventral and dorsal AON preferentially labelled ventral and dorsal glomeruli, respectively (Fig. 2c). To quantify the spatial distributions of starter cells in the AON and trans-synaptically labelled glomeruli in the olfactory bulb, we introduced a cylindrical coordinate system into the olfactory bulb and AON models, where Z represents the position along the anterior–posterior axis and h represents the angle from the polar axis (Fig. 2c). No correlations were found between ZAON and hOB (where OB is olfactory bulb), ZAON and ZOB, or hAON and ZOB (Supplementary Fig. 10a). However, we found a strong positive correlation (R2 5 0.79) between hAON and hOB (Fig. 2d), which correspond to the dorsal–ventral axes of the AON and olfactory bulb, respectively. Thus, the AON maintains the dorsal– ventral topography of the olfactory bulb. A coarse topography exists between olfactory receptor neuron cellbody positions in the olfactory epithelium and target glomeruli in the olfactory bulb along the dorsal–ventral axis26. Specifically, the olfactory cell adhesion molecule (OCAM) is expressed in a subset of olfactory receptor neurons27 that project to the ventral ,55% of glomeruli in the olfactory bulb. In the olfactory bulb, ,25u clockwise rotation of the
2 | N AT U R E | VO L 0 0 0 | 0 0 M O N T H 2 0 1 0
©2010 Macmillan Publishers Limited. All rights reserved
ARTICLE RESEARCH a d
RMS
160
160
120
120
TOB
I
Ventral mCherry y nGFP
TdOB
Dorsal II Lateral
e
80 R2 = 0.79 P40 from the bottom panel in (a), all cells that were considered histoneGFP+ by visual inspection corresponded perfectly with cells that contained pixels with intensities of >40 (shown in blue).
WWW.NATURE.COM/NATURE | 2
doi:10.1038/nature09714
RESEARCH SUPPLEMENTARY INFORMATION
Supplementary Figure 3 ¨An example of a single starter cell in the S2 somatosensory cortex. Left, a single 60-Pm coronal section includes the starter cell (arrow; labeled with mCherry and histone-GFP) and its local presynaptic cells (labeled with mCherry alone). Right, cortical layer distribution of a total of 249 mCherry-labeled cells that span 9 anterior and 11 posterior consecutive 60-Pm sections from the section that contains the starter cell (arrow). Scale bar, 500 Pm. This sample provides an “order-of-magnitude” estimate of the false negative rate of rabies virus tracing (cells presynaptic to a starter cell that are not labeled). A typical neuron in the mouse neocortex receives on the average 2000-8000 presynaptic inputs1. Based on anatomical reconstructions of filled cortical neurons after paired recordings2, a cortical neuron is estimated to connect to each of its presynaptic cortical partner neurons by about 5 synapses. Therefore, each cortical neurons should have 400-1600 presynaptic partners. Thus, about 15-60% of presynaptic partners are labeled in this example.
WWW.NATURE.COM/NATURE | 3
doi:10.1038/nature09714
RESEARCH SUPPLEMENTARY INFORMATION
Supplementary Figure 4 ¨Negative controls for trans-synaptic labeling. All neocortical trans-synaptic labeling experiments that followed the protocol presented in Fig. 1b (n=12) resulted in the labeling of hundreds to thousands of trans-synaptically labeled neurons, many of which were located far from the injection sites (see examples in Fig. 1c and Supplementary Fig. 3). As a first negative control, we replaced the AAV with PBS (no AAV, left panel) in the protocol outlined in Fig. 1b. We did not find a single mCherry+ cell (n=3 animals), indicating that the infection by pseudotyped rabies virus ('G-mCherry+EnvA) critically depends on the functional TVA receptor supplied by the AAV. As a second negative control, we replaced tamoxifen (TM) with PBS (no CreER-induced recombination to allow tTA expression), and found no labeled cells at all in one animal, and fewer than 10 mCherry+ cells in each of the other three animals. All labeled cells were located at the injection sites (middle panel). In all cases (n=4), no labeled cells were found at a distance >450 µm. Because a very small amount of TVA receptor is sufficient to allow rabies virus infection (E.M.C. unpublished observation), it is likely that leaky expression of the TVA receptor from the AAV, independently of tTA, allows very sparse rabies infection. These cells contained no green labeling in the nucleus (right, top panel) and they did not support trans-synaptic rabies spread, presumably because they did not produce enough histone-GFP and G, respectively. Taken together, these data demonstrate that transsynaptic rabies virus spread critically depends on the presence of sufficient amounts of tTA2 (from the transgene) and TVA/G (from AAV). Scale bar, 1 mm.
WWW.NATURE.COM/NATURE | 4
doi:10.1038/nature09714
RESEARCH SUPPLEMENTARY INFORMATION
WWW.NATURE.COM/NATURE | 5
doi:10.1038/nature09714
RESEARCH SUPPLEMENTARY INFORMATION
Supplementary Figure 5 ¨ Rabies virus generated in vivo does not label axons in passage. To assess if the rabies virus spreads specifically through synapses, we tested if rabies virus particles produced by in vivo complementation (Fig. 1a-b) can infect neurons whose axons pass through the injection sites without making synapses (axons in passage). The accessory olfactory bulb (AOB) mitral cells axons form the accessory olfactory tract (aLOT), which passes close to layer Ia of the anterior piriform cortex (APC) without forming synaptic connections with the APC neurons3,4. These axons in passage, if infected, would generate false-positive labeling in our experiments. These axons eventually project to the medial amygdala (ME and PMCo, see Fig. 3a), where they make synapses with cortical neurons. a, To show that AOB mitral cells can in principle be infected by rabies virus, we injected the in vitro complemented rabies virus ('GmCherry+G) into ME (a1). This mutant rabies virus was produced from a cell line that expresses a complementing G transgene, and should infect any cells that can normally be infected by rabies virus, but cannot produce more viral particles for further trans-synaptic infection because the glycoprotein gene was deleted in the viral genome5. The AOB mitral cells ipsilateral to the injection site were intensely labeled, whereas the main olfactory bulb (MOB) mitral cells were rarely labeled (a2, magnified in a3). The labeled axons of AOB mitral cells could also be observed in the sections through the APC where they form the aLOT passing through layer Ia; the lateral olfactory tract (LOT), which contains the axons of mitral cells from the MOB, was not labeled (a4). These data not only confirm that axons of AOB mitral cells pass through the APC, but also demonstrate that rabies virus can efficiently infect AOB mitral cells. b, To test if rabies virus injected into the extracellular space can infect axons in passing, we injected rabies virus 'G-mCherry+G into the APC. We observed intense labeling of AOB mitral cells as well as MOB mitral cells (see also Supplementary Fig. 7). This observation indicates that in vitro complemented rabies virus can infect axons in passage, sharing the same drawbacks with traditional extracellular dye injection methods. c, In sharp contrast, rabies particles generated in the APC via in vivo complementation (as in Fig. 3b) did not label AOB mitral cells. In a total of 5 individual animals subjected to our trans-synaptic labeling protocol (Fig. 1a-b) using actinCreER, we observed a total of 46 starter cells in the APC, which labeled a total of 381 mitral cells in the MOB. At the same time, we did not observe a single labeled AOB mitral cell. Arrowheads represent passing axons originating from the MOB. The absence of labeled AOB mitral cells cannot be explained by the relative abundance of MOB vs. AOB mitral cells, as there are only about 10-times more MOB mitral cells6-9. Thus, this observation indicates that rabies virus particles generated in vivo do not infect axons in passage, strongly supporting synapsedependent spread of the viral particles. Scale bars, 100 Pm, except in a2, 500 Pm.
WWW.NATURE.COM/NATURE | 6
doi:10.1038/nature09714
RESEARCH SUPPLEMENTARY INFORMATION
Supplementary Figure 6 ¨ Rabies virus spreads mono-synaptically and purely retrogradely. To assess if rabies virus spread is restricted to direct connections in a purely retrograde direction, we tested if rabies particles generated in the piriform cortex (PC) in vivo can infect the granule (Gra) and periglomerular (PG) cells in the olfactory bulb. a, Connection diagrams in the olfactory bulb. Mitral cells (M) send long distance axons via the lateral olfactory tract (LOT) to the PC where they synapse with pyramidal cells. Pyramidal cells in the PC send back projections that synapse with Gra cells and other cell types in the olfactory bulb. Gra and PG cells form dendro-dendritic reciprocal connections with mitral cells10. If di-synaptic viral spread can occur, starting from the cortical pyramidal cells, rabies virus should not only label pre-synaptic mitral cells (shown in red), but also Gra and PG cells that are presynaptic to mitral cells. If the rabies virus can spread anterogradely, Gra cells in the olfactory bulb should be labeled by starter cells in the PC. b, We did not observe Gra or PG cell labeling in any of our trans-synaptic labeling experiments starting from the PC. This panel shows a single confocal image of the olfactory bulb with densely trans-synaptically labeled mitral cells starting from pyramidal cells in the anterior PC; however, none of the Gra or PG cells are labeled. This sample was not included in our quantitative analyses, as the labeling in the olfactory bulb was too dense to reconstruct. c, Summary of all 10 samples with actin-CreER+ starter cells from the piriform cortex (Supplementary Table 1). In a separate experiment, we confirmed that PG and Gra cells are competent to receive rabies virus particles from mitral cells as starter cells (unpublished data). In addition, AON pyramidal cells send axons to and synapse with neurons in the contralateral olfactory bulb11. From a total of 223 starter cells in our AON injection experiments, we detected 1046 labeled mitral cells in the ipsilateral olfactory bulb, but did not find a single labeled cell in the contralateral olfactory bulb as would be predicted if the rabies virus can spread anterogradely. Together, these observations indicate that the rabies virus spread occurs only through direct connections to the starter cells in the purely retrograde direction.
WWW.NATURE.COM/NATURE | 7
doi:10.1038/nature09714
RESEARCH SUPPLEMENTARY INFORMATION
Supplementary Figure 7 ¨ Mitral cells throughout the olfactory bulb can receive rabies virus from their axons. To test if mitral cells in different olfactory bulb areas are competent to receive rabies virus from their axon termini, we made use of the in vitro complemented rabies virus ('G-mCherry+G). This virus can infect cells that would be infected by the wild-type rabies virus, but cannot produce further viral particles for trans-synaptic transmission (see Supplementary Fig. 5 legend). 0.3 Pl of 'G-mCherry+G rabies virus was injected into the anterior piriform cortex of 4-week old wild type mice (n=3). a, A typical example of a 60-Pm coronal section at the injection site. Near the injection site, many neurons are labeled with the rabies virus (magnified on the right). b, In the olfactory bulb, mitral cells ipsilateral to the injection site were intensely labeled in all olfactory bulb regions, whereas no labeled cells could be found in the contralateral side (magnified on the right). This finding is consistent with the unilateral projection of mitral cell axons12. Importantly, this experiment validates that mitral cells throughout the entire olfactory bulb can be infected by rabies virus from their axons in the olfactory cortex without obvious bias. Scale bars, 1 mm for low-magnification images, 100 Pm for high-magnification images. The stereotactic condition for the injection site of rabies virus is shown in a, left panel (mm away from the Bregma for A and L, mm from the brain surface for V). A, anterior; L, lateral; V, ventral; LOT, lateral olfactory tract; MC, mitral cell layer; Glo, glomerular layer.
WWW.NATURE.COM/NATURE | 8
doi:10.1038/nature09714
RESEARCH SUPPLEMENTARY INFORMATION
Supplementary Figure 8 ¨Glomerular tracing from serial coronal sections of an olfactory bulb. 53 to 60 consecutive coronal sections (60 µm) that cover the entire olfactory bulb were collected for each experiment. a, For each coronal section, labeled glomeruli (in red) and unlabeled glomeruli (in white, identified by DAPI staining in blue) were individually traced in Adobe Illustrator. Unlabeled glomeruli that span more than one section might occasionally be traced twice (once in each of the two consecutive coronal sections), but each labeled glomerulus was carefully traced only once in the section where labeled dendrites were densest. b, An example of tracing the entire olfactory bulb (corresponding to Fig. 2c, red and Supplementary Movie 1) from 58 consecutive coronal sections of a single olfactory bulb. Red, singly innervated glomeruli; Cyan, dually innervated glomeruli; White, unlabeled glomeruli. A, anterior, P, posterior. Scale bar, 500 Pm.
WWW.NATURE.COM/NATURE | 9
doi:10.1038/nature09714
RESEARCH SUPPLEMENTARY INFORMATION
Supplementary Figure 9 ¨Precision of olfactory bulb 3D reconstruction. We assessed the precision of our 3D reconstruction for the olfactory bulb glomerular map using P2-IRES-tauGFP mice (n=3, obtained from the Jackson laboratory), in which glomerular targets of a single ORN class were labeled with GFP. a, A typical example of a single coronal 60-Pm section contains lateral (left) and medial (right) major target glomeruli of ORNs that express the P2 odorant receptor. Scale bar, 500 Pm. b, Independent 3D reconstructions of three olfactory bulbs (in white, green and red outlines) are shown. The surfaces represent the inner boundary of the glomerular layer for each sample. Lateral and medial major target glomeruli of P2 from each sample are shown in corresponding colors. After superimposition (rightmost panels), the corresponding labeled glomeruli are located within a distance equivalent to the diameter of several glomeruli. c, The three reconstructed olfactory bulbs shown in b were superimposed with an olfactory bulb that had been stained with an anti-OCAM antibody (Fig. 2c, Supplementary Fig. 11). OCAM- dorsal glomeruli are labeled in yellow. P2 target glomeruli are located in the OCAM+ ventral side, close to the boundary of OCAM+ and OCAM- glomeruli, consistent with P2 being a zone-2 OR gene13.
WWW.NATURE.COM/NATURE | 10
doi:10.1038/nature09714
RESEARCH SUPPLEMENTARY INFORMATION
Figure S10 ¨ Additional analyses of spatial correspondence. Correlation analysis between the location of starter cells in the AON (a), amygdala (ACo and PLCo) (b) and piriform cortex (c), and the location of labeled glomeruli in the olfactory bulb (OB). Bars represent 25%-75% of the distribution for TOB, T’OB, or ZOB. All samples were generated using actin-CreER except the blue sample, which was generated using CaMKII-CreER. In the amygdala samples, we analyzed the correlations along the medial-lateral (ML) instead of dorsal-ventral axis, due to the shape and location of this brain structure (ACo and PLCo can be approximated by a flat surface that lays in the medial-lateral/anterior-posterior plane). R2, square of Pearson’s correlation coefficient; p, statistical significance tested against the null hypothesis assuming R=0. None of these analyses exhibited statistically significant correlation, except c1, which showed positive correlation between T’OB and dorsal-ventral location in the PC, although the correlation (R2=0.47) was weak.
WWW.NATURE.COM/NATURE | 11
doi:10.1038/nature09714
RESEARCH SUPPLEMENTARY INFORMATION
Supplementary Figure 11 ¨Generation of the OCAM coordinate system for the olfactory bulb. a, A single coronal section (60 Pm) including several trans-synaptically labeled mitral cells (red) stained with an anti-OCAM antibody (green). OCAM+ ORN axons terminate in the ventral area (defined by the white dotted line in the left panel). The area covering OCAM+/OCAM- boundary is magnified in the right panels. Glo, glomerular layer, M, mitral cell layer. Scale bars, 500 Pm for the low-magnification image and 100 Pm for the high-magnification images. b, Conversion of the coronal coordinate system to the OCAM coordinate system is based on 3D reconstructions of the olfactory bulb glomerular map with OCAM staining (cyan) from 4 individual brains. The optimal angle (D) that rotates the polar axis (magenta) around the Z-axis and transforms the coronal coordinates to the OCAM coordinates (after rotation, the new polar axis is shown in green) was determined by maximizing the OCAM separation index. OCAM separation index was defined as an absolute value of average TOB for OCAM+ glomeruli subtracted from average TOB for OCAM- glomeruli. c, The OCAM separation index plotted as a function of the rotation angle D. The angle D that gave the highest OCAM separation index was 25.5°± 2.5° (SEM, n=4).
WWW.NATURE.COM/NATURE | 12
doi:10.1038/nature09714
RESEARCH SUPPLEMENTARY INFORMATION
Supplementary Figure 12 ¨Distribution of the trans-synaptically labeled glomeruli along the dorsal-ventral axis. T’OB values for all labeled glomeruli were classified into one of six 30º-bins. The Y-axis represents the frequency of T’OB for each bin after normalization for each experiment. For clarity, we show only samples with >20 labeled glomeruli. Samples from the cortical amygdala (a) and the piriform cortex (d) are color matched with Fig. 3e. The dotted horizontal line shows the frequency of T’OB if all T’OB values were evenly represented. a, Histograms of T’OB for 4 amygdala samples that exhibited a dorsal bias. All samples labeled glomeruli in all bins, with preferential labeling in dorsal bins; none of the samples showed exclusive labeling only in dorsal bins. These data exclude the possibility of a sharp boundary in glomerular labeling along the dorsal-ventral axis. b-c, Histograms for 4 samples from the AON that showed ventral bias (b) and 3 samples from the AON that showed the dorsal bias (c). In either case, an obvious sharp boundary in glomerular labeling along the dorsal-ventral axis was not evident. d, As a comparison, histograms for 4 samples from the piriform cortex (two each from anterior and posterior piriform cortex) are shown. The distribution of T’OB resembles the uniform distribution in these samples.
WWW.NATURE.COM/NATURE | 13
doi:10.1038/nature09714
RESEARCH SUPPLEMENTARY INFORMATION
Supplementary Figure 13 ¨ Trans-synaptic tracing from GABAergic neurons. a, To validate the GAD2-CreER transgene, 1 mg of tamoxifen was applied at postnatal day (PD) 6 to mice doubly heterozygous for GAD2-CreER and CAG-stop-tTA2 (n=4). AAV-TRE-HTG was injected at PD21 to the motor cortex. 10 days later, animals were sacrificed and brain sections were stained with anti-GABA antibodies. A typical example of a 60-Pm coronal section is shown. Although only a small fraction of cells in this section were GABA+, 103 out of 105 cells expressing histone-GFP (i.e., infected with AAV) were co-stained with anti-GABA antibodies (right graph). These data demonstrate that starter cells in our trans-synaptic labeling experiments using GAD2-CreER line are almost exclusively GABAergic neurons. b, A typical example of a single 60-Pm coronal section that includes two starter cells (arrows) located in layers I and II of the piriform cortex, obtained using GAD2-CreER/wt;CAG-stop-tTA2/wt mice injected with AAV-TRE-HTG and rabies virus 'G-mCherry+EnvA. The starter cell located in layer I is magnified in the panels on the right. Quantitative data from this and other experiments using GAD2-CreER, including the number of labeled mitral cells, are summarized in Fig. 4 and Supplementary Table 1. Scale bar, 50 Pm.
WWW.NATURE.COM/NATURE | 14
doi:10.1038/nature09714
RESEARCH SUPPLEMENTARY INFORMATION
Supplementary Table 1 ¨ Summary of quantitative data.
Abbreviations: AON, anterior olfactory nucleus; PLCo, posterolateral cortical amygdaloid nucleus; ACo, anterior cortical amygdaloid nucleus; APC, anterior piriform cortex; PPC, posterior piriform cortex; I-III, layer I, II, III; M/T, mitral/tufted; D-glo, dually labeled glomeruli; S-glo, singly labeled glomeruli; L, lateral; M, medial; nd, not determined.
WWW.NATURE.COM/NATURE | 15
doi:10.1038/nature09714
RESEARCH SUPPLEMENTARY INFORMATION
Supplementary Movie 1 ¨ 3D visualization of the distribution of trans-synaptically labeled glomeruli from a typical experiment. The legends are shown within the movie. References 1 2 3 4 5 6 7 8 9 10 11 12 13
Braitenberg, V. & Schuz, A., Cortex: Statistics and Geometry of Neuronal Connectivity. (Springer-Verlag, 1998). Markram, H., Lubke, J., Frotscher, M., Roth, A., & Sakmann, B., Physiology and anatomy of synaptic connections between thick tufted pyramidal neurones in the developing rat neocortex. J Physiol 500 ( Pt 2), 409-440 (1997). Scalia, F. & Winans, S.S., The differential projections of the olfactory bulb and accessory olfactory bulb in mammals. J Comp Neurol 161 (1), 31-55 (1975). Mohedano-Moriano, A. et al., Segregated pathways to the vomeronasal amygdala: differential projections from the anterior and posterior divisions of the accessory olfactory bulb. Eur J Neurosci 25 (7), 2065-2080 (2007). Wickersham, I.R., Finke, S., Conzelmann, K.K., & Callaway, E.M., Retrograde neuronal tracing with a deletion-mutant rabies virus. Nat Methods 4 (1), 47-49 (2007). Perez-Laso, C. et al., Estradiol masculinizes the number of accessory olfactory bulb mitral cells in the rat. Brain Res Bull 42 (3), 227-230 (1997). Bonthius, D.J., Bonthius, N.E., Napper, R.M., & West, J.R., Early postnatal alcohol exposure acutely and permanently reduces the number of granule cells and mitral cells in the rat olfactory bulb: a stereological study. J Comp Neurol 324 (4), 557-566 (1992). Meisami, E. & Safari, L., A quantitative study of the effects of early unilateral olfactory deprivation on the number and distribution of mitral and tufted cells and of glomeruli in the rat olfactory bulb. Brain Res 221 (1), 81-107 (1981). Rosselli-Austin, L. & Williams, J., Enriched neonatal odor exposure leads to increased numbers of olfactory bulb mitral and granule cells. Brain Res Dev Brain Res 51 (1), 135137 (1990). Shepherd, G.M., The synaptic organization of the brain, 5th ed. (Oxford University Press, Oxford ; New York, 2004). Brunjes, P.C., Illig, K.R., & Meyer, E.A., A field guide to the anterior olfactory nucleus (cortex). Brain Res Brain Res Rev 50 (2), 305-335 (2005). Nevelle, K.R. & Haberly, L.B., Olfactory Cortex in The synaptic organization of the brain, edited by G. M. Shepherd (Oxford University Press, Oxford, 2004). Mombaerts, P. et al., Visualizing an olfactory sensory map. Cell 87 (4), 675-686 (1996).
�
WWW.NATURE.COM/NATURE | 16