CA 91125. xAcknowledgments: The authors wish to thank Diana Meyers and Robin Locke for ..... objects are often de ned by spatially disjoint textural elements.
Cortical Synchronization and Perceptual Framing Stephen Grossbergy and Alexander Grunewaldz Department of Cognitive and Neural Systems and Center for Adaptive Systems Boston University 111 Cummington Street Boston, Massachusetts 02215 x May, 1994 Revised: July, 1995 Revised: February, 1996 Technical Report CAS/CNS-TR-94-025 Boston, MA: Boston University Send requests for reprints to: Professor Stephen Grossberg Boston University Center for Adaptive Systems 111 Cummington Street Boston, MA 02215 Keywords: synchronization, perceptual framing, visual cortex, neural network, boundary contour system, temporal order judgment, spatial pooling
ySupported in part by the the Advanced Research Projects Agency (ONR N00014-92-J-
4015) and the O�ce of Naval Research (ONR N00014-92-J-1309, ONR N00014-95-1-0409, and ONR N00014-95-1-0657) zSupported in part by the Air Force O�ce of Scienti c Research (AFOSR F4962092-J-0334 and AFOSR F49620-92-J-0225), the Advanced Research Projects Agency (ONR N00014-92-J-4015), and the O�ce of Naval Research (ONR N00014-91-J-4100). Present address: Division of Biology, California Institute of Technology, Mail Code 216-76, Pasadena, CA 91125. xAcknowledgments: The authors wish to thank Diana Meyers and Robin Locke for their valuable assistance in the preparation of the manuscript and Eric Schwartz for helpful discussions. i
ii
March 11, 1996
Abstract How does the brain group together di�erent parts of an object into a coherent visual object representation? Di�erent parts of an object may be processed by the brain at different rates and may thus become desynchronized. Perceptual framing is a process that resynchronizes cortical activities corresponding to the same retinal object. A neural network model is presented that is able to rapidly resynchronize desynchronized neural activities. The model provides a link between perceptual and brain data. Model properties quantitatively simulate perceptual framing data, including psychophysical data about temporal order judgments and the reduction of threshold contrast as a function of stimulus length. Such a model has earlier been used to explain data about illusory contour formation, texture segregation, shape-from-shading, 3-D vision, and cortical receptive elds. The model hereby shows how many data may be understood as manifestations of a cortical grouping process that can rapidly resynchronize image parts which belong together in visual object representations. The model exhibits better synchronization in the presence of noise than without noise, a type of stochastic resonance, and synchronizes robustly when cells that represent di�erent stimulus orientations compete. These properties arise when fast long-range cooperation and slow short-range competition interact via nonlinear feedback interactions with cells that obey shunting equations.
March 11, 1996
1
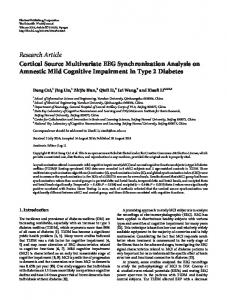
1 Introduction The primate visual system performs the complex task of analyzing the visual environment in several stages. Retinal signals are transmitted to the lateral geniculate nucleus (LGN) and from there to the striate cortex (V1). It is known that the latency of the response onset of retinal and geniculate neurons is variable, even to identical stimuli (Shapley & Victor, 1978; Sestokas & Lehmkuhle, 1986). Moreover, the latency depends on stimulus parameters. More luminant stimuli are processed faster than less luminant stimuli, and lower spatial frequencies are processed faster than higher spatial frequencies (Bolz, Rosner, & Wassle, 1982; Sestokas & Lehmkuhle, 1986). Since most images from a real environment contain a variety of luminances and spatial frequencies, processing of di�erent parts of an image may happen at di�erent rates, so that the cortical representation of the image may be desynchronized. As long as the retinal image is constant, this does not cause serious problems. However, when there is motion in the retinal image, the visual system needs to ensure that all the parts corresponding to the same retinal image are processed together, to avoid illusory conjunctions that could impair recognition of objects in a scene. This problem is illustrated in Figure 1. Under extreme conditions, such as the rapid presentation of visual stimuli, it can happen that illusory conjunctions do occur (Intraub, 1985). Perceptual framing is the process whereby the parts of an image are resynchronized (Varela, Toro, John, & Schwartz, 1981). In the present study, a neural network model is presented that exhibits perceptual framing, so that inputs to the network are resynchronized if they are temporally o�set by less than a critical delay. The present study also shows that perceptual framing can be implemented with the same type of bipole cell cooperative connections that have been postulated in a model of form perception and perceptual grouping (Cohen & Grossberg, 1984; Gove, Grossberg, & Mingolla, 1995; Grossberg, 1984, 1994; Grossberg & Mingolla, 1985a, 1985b; Grossberg, Mingolla, & Todorovi�c, 1989) and reported in neurophysiological experiments on area V2 of the primate visual cortex (von der Heydt, Peterhans, & Baumgartner, 1984; Peterhans & von der Heydt, 1989). Another issue that has to be dealt with by the visual system is that information in the visual cortex is spatially distributed. How does this information get bound together into coherent object representations? This is necessary since the interpretation of an image, which includes the recognition and spatial localization of objects in the image, requires global information. The anatomy of visual cortex suggests that horizontal connections within each area, and feedback connections between di�erent areas, occur at multiple processing stages (Felleman & Van Essen, 1991; Gilbert, 1993). The present study focuses on interactions between neighboring neurons via feedback from subsequent processing stages. It is shown that horizontal integration within the visual cortex can enhance performance of single cortical cells, and thus can form a starting point for the global grouping and understanding of visual images. The perceptual framing model is developed herein to suggest explanations of the following types of data.
2
March 11, 1996
t1
TIME t2
t3
Figure 1: An illustration of the temporal framing problem. Some stimulus attributes are processed faster than others. Since real world scenes contain a whole spectrum of attributes it is possible that di�erent parts of a single image get processed at di�erent times.
March 11, 1996
3
� Neural activities synchronize across wide regions of visual cortex in cats (Eckhorn, � � � �
Bauer, Jordan, Brosch, Kruse, Munk, & Reitboeck, 1988; Gray, Konig, Engel, & Singer, 1989) and monkeys (Freeman & van Dijk, 1987; Kreiter & Singer, 1992) with a period of about 15ms. Temporal order judgment data suggest that at about 20ms stimulus onset asynchrony (SOA) subjects begin to obtain a reliable representation of the temporal order of two brief stimuli (Hirsch & Sherrick, 1961). Spatial pooling e�ects lead to a reduction of the contrast threshold as the length of stimuli is increased up to 2.5 degrees (Essock, 1990). Stochastic resonance can improve performance in the presence of noise at small levels of noise. This improvement manifests itself in an enhanced signal{to{noise{ratio (SNR) in the output compared to that in the input (McNamara & Wiesenfeld, 1989). Synchronization also occurs in the presence of intercellular competition.
Furthermore, the model makes the following prediction about spatial pooling and temporal threshold. � Spatial pooling leads to a reduction of the minimum time necessary for detection as the length of stimuli is increased. Some of the results described here have previously been presented in abstract form (Grunewald & Grossberg, 1994a, 1994b).
2 Other models of cortical synchronization What sorts of mechanisms could, in principle, achieve cortical synchronization? Bottom{up convergence of signals in visual cortex does not su�ce as a mechanism for synchronization, if only because cortical cells have a fast rate of integration (Mason, Nicoll, & Stratford, 1991), yet the responses of cortical cells within the rst 5ms after response onset is a 95% accurate predictor of the entire response strength (Celebrini, Thorpe, Trotter, & Imbert, 1993; Oram & Perrett, 1992). It has also been shown that synchronization cannot be mediated by a clocking mechanism such as the cortical alpha{rhythm (Gho & Varela, 1989), because triggering stimuli in a temporal order judgment task (see Section 2.1) to the alpha rhythm did not a�ect performance. Here we model how synchronization of distributed cortical activities by recurrent cooperative{ competitive interactions that can temporally realign out-of-phase image parts. Cortical activities synchronize in the cat and in the monkey when a stimulus is present in the visual eld (Eckhorn et al., 1988; Gray & Singer, 1989), even when the receptive elds of the units recorded do not overlap. Speci cally, when the receptive elds of the cells from which recordings were made did not overlap, then synchronization nonetheless occurred when a bar that extended across both receptive elds was swept through the image. Weak synchronization also occurred when the bar was occluded in the middle (i.e., the area that lies between
March 11, 1996
4
the receptive elds). No synchronization occurred if two separate bars were swept through both receptive elds simultaneously in opposite directions. Similar results were also found in the awake monkey (Kreiter & Singer, 1992). Synchronization has been shown to occur across wide cortical distances (Gray et al., 1989), and even across hemispheres (Engel, Konig, Kreiter, & Singer, 1991). Initially it was postulated that synchronization occurs between oscillating cell sites (Gray & Singer, 1989), a claim that has been controversial (Ghose & Freeman, 1992; Young, Tanaka, & Yamane, 1992). These experiments have inspired a large number of models of cortical synchronization (Baldi & Meir, 1990; Eckhorn, Reitboeck, Arndt, & Dicke, 1989; Konig & Schillen, 1991). The present model di�ers from these alternative models in several important respects. First and foremost, the present model is part of a larger neural theory of visual perception that already has been used to explain and predict many psychophysical and neural data; see for example Francis et al. (1994), Field et al. (1993), Gove et al. (1995), Graham et al. (1992), Grossberg (1994), Grossberg and Mingolla (1985a, 1985b, 1987) and Lesher and Mingolla (1993). Here we show that a variant of the same boundary segmentation process that has already explained data about such varied phenomena as illusory contours, texture segregation, shape{from{shading, visual persistence, and hyperacuity can also explain data about perceptual framing and spatial pooling. Other models of cortical synchronization have not yet been used to parametrically simulate perceptual data. Without such a behavioral linking hypothesis, such models cannot be said to explain the binding problem of visual object perception. Second, the present model achieves fast synchronization of desynchronized and distributed data. Grossberg and Somers (1991) rst demonstrated this property with computer simulations, and Somers and Kopell (1993) have proved it mathematically. Fast synchronization is needed to frame together desynchronized object parts before they can be incorrectly bound with incorrect parts of other objects, as Intraub (1985) has shown can occur among image parts from di�erent images in very rapidly presented image sequences; see Section 2.1. The present work builds upon the results of Grossberg and Somers (1991). Various other synchronization models have not demonstrated fast synchronization, or do not represent neuron dynamics, but instead use formal equations for phase synchronization (Baldi & Meir, 1990; Lumer & Huberman, 1992; Niebur, Schuster, Kammen, & Koch, 1991). Terman and Wang (1995) described an oscillator that shares some mathematical properties of the Ellias and Grossberg (1975) oscillator that is the basis for the present model; see Sections 4 and 8. Their model uses local cooperation and global competition, rather than our long-range cooperation and short-range competition employed herein, to rapidly synchronize locally connected image gures and to desynchronize spatially disjoint gures. The Terman-Wang study does not attempt to explain any perceptual data or to explain how neurons with spatially separated receptive elds can synchronize. The present model does make this attempt, and provides a functional rationale for the longer-range cooperation and shorter-range competition that have been reported in both cortical area V1 and V2 (Gilbert & Wiesel, 1990; Grosof et al., 1993; Kapadia et al., 1995; Kisv�arday et al., 1995; von der Heydt et al., 1984). One reason for these gaps in other models may be that they do not view the synchronization task as one of perceptual framing, or of fast resynchronization of temporarily desynchronized object parts. Rather, they attribute all binding properties to the very existence of a synchronous oscillation between object parts. In many such models, the phase of the oscilla-
March 11, 1996
5
tion is taken to encode all the features that belong within a single object. Some models also require that attention be focused upon an object or object part before it can synchronously oscillate (Crick & Koch, 1990). It is hard to understand, however, how an object's phase can remain constant as its image size and position on the retina change radically, while the same is happening to other objects, due to changes in their distances and angles with respect to an observer. It is also well-known that segmentation of unfamiliar objects can occur preattentively before attention is engaged. In the present account, the ability to resynchronize asynchronous object parts, not the existence of oscillations per se, becomes the focus of interest. Here, key properties of framing are attributed to interactions of long-range cooperative cells that are called bipole cells. Although we simulate this model in a parameter range where oscillations occur, segmentation can also occur using the present type of model in parameter ranges where oscillations do not occur (Grossberg & Mingolla, 1985a, 1985b). In the present model, oscillations provide an extra degree of freedom that calibrates how asynchronous object parts can become and still be rapidly resynchronized, or framed, together (Grossberg & Somers, 1992). Using bipole cells, textured objects can be bound together (Gove et al., 1995; Grossberg & Mingolla, 1985b, 1987; Grossberg et al., 1995; Waxman et al., 1995). In a textured scene, objects are often de ned by spatially disjoint textural elements. Moreover, the textural elements belonging to di�erent objects may be as close together as the elements belonging to the same objects. In order to separate such objects from one another, a mechanism is needed that can bridge the featureless spaces between texture elements, and can use properties such as texture orientation, size, depth, and alignment across space to distinguish which textures belong to which objects. The Boundary Contour System model of which bipole cells form a part has been shown capable of grouping under these conditions. It is hard to see how a mechanism using unoriented nearest-neighbor cooperation and global competition, as in Terman and Wang (1995), could accomplish this. All simulations of their model use simple connected gures that are widely separated from one another. Finally, one in uential binding model, that of von der Malsburg (1981), suggests that binding requires a type of ultrafast synaptic plasticity that has not yet been experimentally observed; see also Terman and Wang (1995). The present model synchronizes without the bene t of fast plasticity. On the other hand, its synchronous, or resonant, neural states have been proposed to initiate synaptic learning on a slower time scale (Carpenter & Grossberg, 1993; Grossberg, 1976, 1980) that is consistent with known properties of long-term potentiation or LTP (Bliss & Collingridge, 1993). Perceptual framing may thus be utilized not only for perception, but also for learning about the visual environment. Indeed it is known that perceptual learning can occur within hours, with e�ects lasting for a long time (Karni & Sagi, 1993).
3 Perceptual framing and temporal order judgments This section provides a review of psychophysical data on temporal aspects of visual perception which suggests that the temporal precision of behavioral visual processing can be quite accurate. A brief review of neurophysiological data shows that early stages of neural processing are temporally inaccurate, but later stages are not. The model suggests how a
March 11, 1996
6
synchronization process can reconcile these various data. The reader can skip to Section 4 for an intuitive discussion of the model itself. The model is used to simulate data about temporal order judgments in Section 5 to illustrate its temporal synchronization properties. Data about spatial pooling are simulated in Section 6 to further test the spatial interactions that achieve temporal synchronization. The model's robustness is illustrated in Section 7 with simulations in noise or in the presence of competitive interactions. Model equations and parameters are given in Section 8.
3.1 Psychophysical data concerning of temporal dynamics
One partially informative way to study temporal dynamics in visual perception is to use reaction time studies. The reaction time paradigm has been used to study the dependence of reaction time on the contrast of a ash of light, and it was found that the reaction time decreases with increasing contrast (Burkhardt, Gottesman, & Keenan, 1987), even if the energy of the ash is kept constant, provided the ash is not too close to threshold, in which case Bloch's law holds. Similarly the reaction time depends on the wavelength of the stimulus (Ueno, Pokorny, & Smith, 1985) and the spatial frequency (Gish, Shulman, Sheehy, & Leibowitz, 1986). Such RT studies show that changing the stimulus along a feature dimension may change the rate of processing. In a display with several stimuli characterized by di�erences along the same feature dimension, these results would carry over if processing of the image were independent for each stimulus. However, spatiotemporal interactions occur during image processing, including brightness illusions and e�ects of lling-in (Arrington, 1994; Grossberg & Todorovi�c, 1988; Paradiso & Nakayama, 1991). Thus RT studies of single feature processing cannot be directly used to predict the temporal dynamics of composite images or realistic scenes. Temporal order judgment (TOJ) is another paradigm that has been used to compare the rates at which two di�erent stimuli are processed. In this paradigm, observers are presented with two ashes of light at di�erent locations in rapid succession, and they have to indicate which stimulus appeared rst. Usually the duration of the stimuli is kept constant, but the stimulus onset asynchrony (SOA) is varied. The result of such an experiment is a psychometric curve, where the probability for correct detection is given as a function of SOA. Two points of that psychometric function are of particular importance: the point of subjective simultaneity (PSS), and the threshold for accurate TOJ perception. The PSS is the point at which the psychometric function crosses the 50% level. If the two stimuli are identical, then the PSS will lie at 0 SOA, and it will shift if the two stimuli are processed at di�erent rates. By convention, the point at which the psychometric function is 75% is often used as a threshold value for simultaneity. An in uential study by Hirsch and Sherrick (1961) showed that the threshold lay at about 20ms under optimal conditions. Their subjects were highly trained, and the stimuli used were bright dots with high ambient illumination. In another study, Sternberg and Knoll (1973) developed the independent channels model of TOJs. According to this model, each stimulus is processed independently, and they only interact at the site at which the temporal order is actually determined. Several decision functions at that site distinguish between di�erent versions of the independent channels
March 11, 1996
7
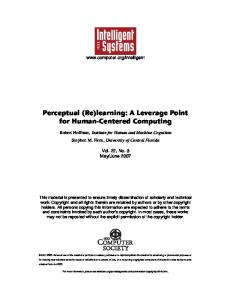
model. Recent investigations comparing RT and TOJ data have investigated whether the two paradigms yield equivalent results. Ja�skowski (1993) varied the onset rise times of visual stimuli, and compared that to a stimulus with zero rise time. The RT study showed that the rise time had only a small e�ect, while the TOJ experiments showed a clear slowing down of processing as rise time increased. Similarly, Tappe, Niepel, and Neuman (1994) found that if gratings were used as stimuli, then RT relative to a reference stimulus increased signi cantly more with spatial frequency than PSS. In summary, RT studies and TOJs do not yield the same results about relative rates of processing. It has been shown that the motor component of RT is not independent of stimulus properties (Ulrich & Stapf, 1984). Thus it is possible that the dependence of motor reaction time on the visual stimulus may corrupt RT times too much for them to be a useful tool in the present context. For this reason, TOJ results are preferable over RT results as an explanatory target. The results from TOJs suggest that temporal perception is remarkably accurate. Rapid serial visual presentation (RSVP) is a di�erent paradigm that can employ realistic scenes. Observers are presented with a sequence of visual stimuli at very high frame rates (about 10 Hz). Several tasks are used in conjunction with RSVP. Observers may be asked to detect a particular stimulus, they may be asked to identify which stimulus had a particular feature, which feature followed a particular cue, etc. The nature of the paradigm lends itself for the study of how subsequent stimuli interact when they are being rapidly processed. Intraub (1985) employed a RSVP paradigm in which observers had to recognize which object was surrounded by a frame (see Figure 2). The motivation for that study was to investigate how di�cult it is to perceive a single visual stimulus as a whole. She found that subjects were quite reliable at this task until she increased the frame rate to very high levels. In that case, observers often reported that the frame appeared around an object that preceded or followed the correct object. These illusory conjunctions do not seem to depend upon attentional manipulation. This experiment also indicates that only under very extreme conditions do the processing of the object and the surrounding frame not occur together. Similar observations using colored digits have also been reported (McLean, Broadbent, & Broadbent, 1982). These experiments, in which observers had to identify the color of a target digit in a stream of digits, showed that observers sometimes reported the color of an earlier or later digit.
3.2 Neurophysiological data concerning temporal dynamics
Latencies of neuronal responses in the retina and in the lateral geniculate nucleus (LGN) vary to a considerable extent for identical stimuli (Shapley & Victor, 1978; Sestokas & Lehmkuhle, 1986). The standard deviation of response onset latencies in the LGN has been reported to vary between 10 and 50 ms depending on the stimulus, and the standard deviation of the response peak latency has been shown to be even bigger (Bolz et al., 1982; Sestokas & Lehmkuhle, 1986). In other words, the timing of neural events at early stages of visual processing seems quite crude. If the neuronal responses in the visual cortex were independent, and only based on independent feedforward activation from the LGN, then one would expect that the variances
8
March 11, 1996
Stimulus
Percept
TIME
Figure 2: Illusory conjunctions can occur under extreme conditions, as shown by Intraub (1985). In that study, observers were shown sequences of images at high presentation rates (9 Hz). One of those images was surrounded by a frame, and observers had to report which image was surrounded by a frame. Observers often reported objects prior or after the correct object.
March 11, 1996
9
of the response onset latencies to add, thus yielding even greater uncertainty as to the precise onset of neuronal responses. Several neurophysiological studies addressed this issue and concluded that the standard deviation of response onset latencies in the visual cortex is just 10 ms (Celebrini et al., 1993; Maunsell & Gibson, 1992; Vogels & Orban, 1991). A careful analysis of the response onset latencies (Maunsell & Gibson, 1992) by cortical layer showed that the standard deviation is as small as 6ms. These data suggest that, contrary to the expected increase in variability, a decrease is taking place. In other words, the activities in visual cortex cannot be independent, and some form of interaction reduces earlier levels of temporal uncertainty. A recent study by Nowak, Munk, Girard, and Bullier (1995) reported recordings from the primate visual cortex in areas V1 and V2 in which higher values for the standard deviation were obtained, even when they took into account the cortical layer within which a neuron is situated. At rst sight, these data appear puzzling, and in direct contradiction to the above cited primate data. However, the di�erences may be accounted for by the animal preparation used. The animals in the study by Maunsell and Gibson (1992) were awake and behaving monkeys, while Nowak et al. (1995) used anesthetized monkeys. It is possible that the anesthesia had an adverse e�ect on the response accuracy of cells. Recordings from the retina and from the LGN show that processing speed also depends on stimulus characteristics. Very luminant stimuli are processed substantially faster than less luminant stimuli (Bolz et al., 1982; Sestokas & Lehmkuhle, 1986), and gratings with lower spatial frequency are processed faster than gratings with higher spatial frequencies (Sestokas & Lehmkuhle, 1986). This e�ect has been studied when only a small stimulus is in the image. This result needs to be reconciled with the perceptual constancy of PSS as spatial frequency changes (Tappe et al., 1994).
3.3 Perceptual framing as resynchronization
More generally, the upper limit within which di�erent features of an image appear simultaneous needs to be explained. The above discussion of psychophysical and neurophysiological data can be viewed very much as expressing the same result: Temporal processing of visual information can be variable, due to di�erent rates of processing for di�erent stimulus features, yet when several features belonging to the same object are presented simultaneously, that variability is reduced, except in extreme circumstances such as RSVP, through a process of perceptual framing (Varela et al., 1981). The data suggest that perceptual framing occurs only in the presence of several stimuli within the visual eld. In other words, perceptual framing is inherently a spatio-temporal phenomenon wherein spatial interactions between visual events in time somehow resynchronize them.
4 A model of perceptual framing The model we propose is an extension of a model that was introduced by Grossberg and Somers (1991) to explain how cortical activity can quickly be synchronized without a central rhythm generator. That model is a simpli cation of the Boundary Contour System (BCS) for emergent boundary segmentation of Grossberg and Mingolla (1985a, 1985b). The BCS
March 11, 1996
10
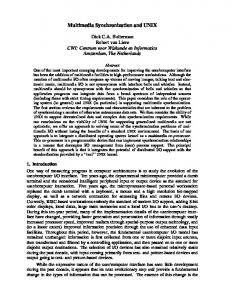
has been progressively developed over the years to explain ever larger data bases about how the interblob processing stream of the visual cortex helps to generate internal representations of Form-And-Color-And-DEpth, or FACADES, that are, predicted to be completed in area V4 of the extrastriate cortex. See Grossberg (1987), Grossberg et al. (1989) and Grossberg (1994) for reviews. Many previous BCS computer simulations have used a non-oscillatory variant of the model to suggest explanations of data on illusory contours, texture segregation, brightness perception, shape-from shading, and 3-D vision (see above references). Other studies extended this steady-state analysis to the dynamics of segmentation reset in the 100 ms range with simulations of visual persistence data that measure how long a boundary segmentation persists after stimulus o�set (Francis & Grossberg, 1995; Francis et al., 1994). The present work analyses the temporal dynamics of the faster time scale on which boundary segmentation forms. The goal of Grossberg and Somers (1991) was to simplify the BCS model as a much as possible to expose the core mathematical mechanism behind fast resynchronization. They thereby demonstrated how this key property could be used to explain cortical neural data on synchronization (e.g., Eckhorn et al., 1988; Freeman and van Dijk, 1987; Gray et al., 1989; Kreiter and Singer, 1992) using a perceptual theory that had already been used to suggest explanations of many other types of perceptual and neural data. The present work continues this strategy to strengthen the linking hypothesis between perceptual and neural data that both probe the synchronization process. To the present time this is the only model of which we are aware that makes the linking hypothesis. Indeed, the model: (1) demonstrates fast synchronization. Fast synchronization means that the model can resynchronize desynchronized cell activities within a few cycles of the oscillation. Grossberg and Somers (1991) demonstrated synchronization within a single cycle. Such rapid synchronization enables the model to carry out perceptual framing. In addition, the model provides an explanation of: (2) cortical neural data about synchronization, (3) perceptual data about synchronization, and (4) perceptual data about grouping processes other than synchronization. The BCS contains a feedforward lter followed by a feedback grouping network. The simpli ed BCS only contains a variant of the feedback grouping network. It contains three types of cells (Figure 3). The rst two cell types are fast excitatory cells (cells that react quickly) and slow inhibitory cells (cells that react slowly) that are coupled together through reciprocal pathways (Figure 3). An excitatory cell excites itself, an inhibitory interneuron, and a third type of cell, called a bipole cell, that couples excitatory cells together. An inhibitory cell inhibits only the excitatory cell from which it derives its excitation. Inputs to the excitatory cells are capable of triggering oscillations within such a network. Each excitatory cell obeys a membrane equation which includes multiplicative, or shunting, interactions between the cell potential and its input and feedback signals (Grossberg, 1973; Hodgkin, 1964). Each slow inhibitory cell obeys a simpler additive equation that linearly time-averages signals from the excitatory cell. This combination of fast shunting and slow addition was rst used in Ellias and Grossberg (1975) to simulate oscillatory dynamics. A mathematically similar type of dynamics was proposed by Morris and Lecar (1981) to explain voltage oscillations in an invertebrate preparation. Somers and Kopell (1993) have analyzed mathematically how Ellias-Grossberg and Morris-Lecar models generate fast resynchronization (e.g., synchronization within one processing cycle), whereas sinusoidal oscillators do not.
11
March 11, 1996
zi
bipole
+
+ +
+ fast
+ xi +
slow
+
+ +
yi
+
+ −
+ +
+
+
+
+ −
+
+ −
+ +
+ −
+
+ −
+
Input
Figure 3: The architecture of the fast synchronization model. A layer of fast{slow oscillators is recurrently coupled to a layer of bipole cells. The third cell type, called a bipole cell, couples the excitatory cells together via long-range cooperative feedback. Bipole cells have tripartite receptive elds. Two of these sub elds branch in a laterally oriented direction from the bipole cell body. The third inputs directly to the cell body. The bipole cell res if at least two of the three sub elds are activated by excitatory cells. If the two oriented branches are excited, then a bipole cell can help to complete a boundary between these branches. If one branch and the cell body are activated, then a bipole cell can be activated at a line end. The present study re nes that of Grossberg and Somers (1991) by using a tripartite, rather than a bipartite, bipole cell receptive eld and a sigmoidal signal function in the fastslow oscillator, rather than the threshold-linear signal function that was previously used, to quantitatively simulate psychophysical data. The tripartite bipole cell facilitates synchronization near line ends. The sigmoid function enables low levels of activity spread out over space to collectively generate su�ciently high activity in the bipole cells to trigger feedback signals. In this way, small and temporally desynchronized signals that converge on bipole cells can induce large and synchronous network responses. The model is de ned mathematically later in the article. It should also be noted that models which use similar cell dynamics do not necessarily synchronize when they are coupled in di�erent ways. Grossberg and Somers (1991, 1992) demonstrated that synchronous oscillations occur when any of several excitatory couplings are used: bipole, adaptive lter, nearest neighbor, and random. Alternative cooperativecompetitive couplings can, however, generate combinations of in-phase and anti-phase oscillations that have been used to model the control of gait changes during quadruped locomotion in vertebrates (Grossberg, Pribe, & Cohen, 1994; Pribe, Grossberg, & Cohen, 1994). Thus the present model forms part of a larger mathematical theory that is being developed to clarify how cell dynamics and geometry work together to determine the emergent oscillatory
12
March 11, 1996
structure.
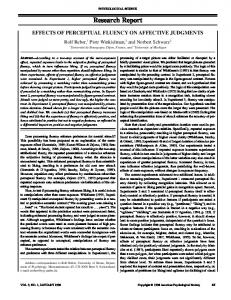
5 Simulation of temporal order judgments As noted in Section 3.1, one way to test the notion of perceptual framing is to link it to temporal order judgments (TOJs) between two visual stimuli. When perceptual framing breaks down, two stimuli can be perceived as successive, whence observers can identify their temporal order. Hirsch and Sherrick (1961) found that the point at which subjects reach threshold in a TOJ task lies at about 20ms SOA for highly trained subjects using bright stimuli with high ambient illumination. See Figure 4, which also shows that the behavior of the model closely approximates their data. Temporal order judgments Simulation
100
Experiment Percentage "left first"
50
10 0 −40
−20
0
20
40 SOA (ms)
Figure 4: Accuracy of temporal order judgments as a function of SOA. Comparison between experimental results (Hirsh & Sherrick 1961) and model simulation. SOA indicates the time by which stimulus one (e.g., the \left stimulus") leads the other stimulus in a two stimulus presentation task. The ordinate gives the percent responses that stimulus one appeared rst. Solid line: results from simulation of the model. Dashed line: results from experimental study. Positive SOA means that the \left" stimulus was presented rst, negative means that the \right" stimulus was presented rst. Figure 5 provides a ner description of how synchronization is related to the plot of Figure 4. This simulation plots the time di�erence between the peak activity of the internal representations of two external stimuli as a function of their SOA. The solid line shows the e�ects of synchrony on small SOAs. For di�erent SOAs, we found the internal time di�erence �t for the corresponding neural signals in the model. The time of the response peak corresponding to each of the two stimuli is a random variable, and the mean of the
13
March 11, 1996
di�erence between the two random variables corresponding to the two stimuli is the internal time di�erence �t. The probability that each of those neural signals occurs at any given time follows the normal distribution, where the mean of the rst signal can be set to zero, and the mean of the second can be set to �t. The standard deviation of the time of the peak response � is the same for both, and has been reported experimentally to be 6ms (Maunsell & Gibson, 1992; Zack, 1973). The probability that the signal corresponding to the rst stimulus is perceived rst can be found by taking the di�erence of the two random p variables, which is also a normal distribution, with mean �t and standard deviation 2�. Thus the probability that the rst stimulus in a two stimuli paradigm is perceived rst, and hence that the temporal order of the stimuli is perceived correctly, is given by !
(1) P = � p�t ; 2� where � is the cumulative normal distribution function, Zx 12 1 ? 2 t dt: p (2) e �(x) = 2� ?1 Each SOA leads to a di�erent value for �t, and hence a di�erent probability P . In Figure 4 the experimental results of Hirsch and Sherrick (1961) about temporal order judgments and the simulation results are compared. The simulations match the data closely.
6 Simulation of spatial pooling Spatial pooling describes the property that the contrast sensitivity for larger stimuli is lower than for smaller stimuli. For stimuli of about one degree in size, this property is often attributed to spatial summation. Generally, spatial summation depends upon the area of the image (Ricco's Law). If an object has larger area, then it will stimulate more photoreceptors, and more geniculate and striate cortical neurons, thus leading to a lower threshold. However, Thomas (1978) found that, even using lines of constant area, an increase of the line length leads to a lower detection threshold. Since the area was small enough to fall entirely within the fovea, this suggests that some form of additional spatial interaction is at work, rather than just a real summation. One interpretation is that the short lines cover only part of the receptive eld of a simple or complex cell, and that as longer lines begin to cover more and more of the receptive eld, the cells get more active. Along with this argument goes that nding that the receptive eld sizes of simple and complex cells (Hubel & Wiesel, 1968) are in line with the dimensions used in some psychophysical studies (Bacon & King-Smith, 1977; Thomas, 1978). Other studies have used gratings that are substantially longer (Essock, 1990). Here, an e�ect of spatial pooling was observed which asymptoted only after the stimulus length reached 2.5 degrees. This length is signi cantly bigger than the receptive elds size of simple and complex cells in monkey (Hubel & Wiesel, 1968), and hence speaks in favor of a process involving oriented interactions between cortical neurons. Such interactions may be mediated by horizontal connections within cortical area V1 (Gilbert, 1993) or V2 (von der Heydt et al.,
14
March 11, 1996
Perceptual Framing Coupled 8 Uncoupled Internal time difference (ms)
2 0
−6 0
5
10
20
SOA (ms)
} synchronization interval
Figure 5: Perceptual framing: The abscissa indicates the SOA (in simulated ms) between two stimuli, and the ordinate gives the resulting time di�erence (in simulated ms) between peaks of activity in the internal representations of the two stimuli. Solid line: performance in the presence of bipole coupling, dashed line: performance in the absence of bipole coupling. The oscillatory nature of the underlying network processing is re ected in the fact that both curves cross the x-axis several times for nonzero SOAs. 1984; Peterhans & von der Heydt, 1989) or by feedback of such interactions from area V2 to V1 (Alonson, Cudeiro, P�erez, Gonzalez, & Acu~na, 1993). The present study attributes spatial pooling interactions to horizontal connections mediated by bipole cells and shows that such network spatial pooling is su�cient to simulate the data beyond the range of spatial summation e�ects within single receptive elds. No t of the model was attempted for very small stimulus sizes. Figure 6 shows a comparison between the spatial pooling data of Essock (1990) and simulations of the model. This graph was obtained by increasing the contrast of the input until the minimum value was found that led to oscillations. A second way in which spatial pooling could manifest itself is by a decrease in the minimum presentation time needed for stimulus detection as stimulus length increases. The same mechanism that synchronizes activities across the network model can also lead to such spatiotemporal pooling, and thus to a reduction of the time necessary to perceive objects as the line length is increased. This prediction of the model is simulated in Figure 7. Since the model is not calibrated in space, normalized spatial variables are shown. One could argue that this spatial pooling e�ect could also be mediated by additional cortical mechanisms. The present simulation shows that the same type of bipole cell cooperation that has been used to explain other types of boundary grouping data is also su�cient to provide a quantitative explanation of spatial pooling.
15
March 11, 1996
Spatial pooling: effect on threshold contrast Simulation
2
Experiment
Normalized threshold contrast
1.5
1 0.2
1
Normalized length
Figure 6: Spatial pooling: As the stimulus size increases, the threshold contrast decreases. Size and contrast are normalized with respect to the asymptotic value for large sizes. Solid line: results from simulation of the model. Dashed line: data of Essock (1990). [Reprinted with permission from Essock (1990).] Spatial pooling: effect on threshold duration 1.2 Threshold duration (ms)
1
0.8 0.2
1
Normalized length
Figure 7: The minimal length predicted by the model for detection as a function of presentation time. At brief presentation times, long stimuli are more visible than short ones.
16
March 11, 1996
7 Stochastic resonance and competitive dynamics Stochastic resonance is a phenomenon that typically occurs when a oscillatory signal is fed into a bistable process that is capable of switching between two modes (McNamara & Wiesenfeld, 1989). The oscillations in the input entrain oscillations in the bistable unit. Stochastic resonance is said to occur when, for some noise levels, the signal{to{noise{ratio (SNR) in the output unit can be higher than in the input. Stochastic resonance was rst reported in the context of periodic variations of the climate of the earth (Benzi, Sutera, & Vulpiani, 1981). In a later study, it was suggested that neural processing might employ such a mechanism to improve performance (Longtin, Bulsara, & Moss, 1991). This suggestion has recently been con rmed in a physiological study of mechanoreceptors in the cray sh (Douglass, Wilkens, Pantazelou, & Moss, 1993). Perceptual Framing: Effects of Noise Noisy 7 Noisefree
Internal time difference (ms) 5
1 0
−3 0
5
10
20
SOA (ms)
Figure 8: Perceptual framing can improve when there is noise in the background, a type of stochastic resonance. Solid line: internal time di�erence in the presence of noise. Dashed line: internal time di�erence in the absence of noise. A simulation showing how the network maintains, and can even improve, its synchronization in noise is shown in Figure 8. As in stochastic resonance, this key functional property improves in noise. These properties continue to hold if the model neurons compete via recurrent lateral inhibition, or competition. Competition is well-known to be an essential component of visual processing (Ku�er, 1953; Ratli�, 1965). Competition tends to sharpen, or contrast-enhance, activities across a neural representation, while normalizing the network's total activity and preventing saturation of cell activities in response to variable inputs (Grossberg, 1973). Figure 9 shows how competition could occur within the model between two oscillators coding di�erent orientations at the same location. This competitive interaction is analogous to the orientational competition that is posited to occur within
17
March 11, 1996
cortical hypercomplex cells in the BCS model of Grossberg and Mingolla (1985b, 1987).
xv
xh Ih
yv
yh
Figure 9: Competition between two oscillators coding two di�erent orientations at the same location. Since only a one-dimensional simulation was used, only the horizontal oscillator produces an output that is fed into bipole cells. Hence only horizontal oscillators receive external input. Note that competition is between the slow node of one oscillator and the fast node of the other oscillator. It is not obvious that competition would not alter the ability of the entire nonlinear oscillatory system to achieve synchrony. Figure 10 shows that competition does not prevent synchronization in the present model. Here two curves of perceptual framing are plotted, one in the absence of competition, and one in its presence, with little di�erence.
8 Model equations and parameters Because bipole cells carry out oriented cooperation, the main model properties can adequately be demonstrated through one-dimensional simulations. In particular, model simulations used 64 oscillators arranged along a ring. Each oscillator consisted of two nodes each, one fast and one slow. The activity of the fast node is denoted by xi and of the corresponding slow node by yi. The index i denotes the position of the oscillator and ranges from 1 to 64. Oscillators with indices di�ering by one are neighbors. Since the oscillators are arranged as a ring, units indexed by 1 and 64 are also neighbors. This structure was chosen to avoid edge e�ects. Care was taken to ensure that input was su�ciently far removed from the wraparound position to avoid interactions around the whole ring. The input is then processed without edge e�ects or cross-talk due to spurious wrap-around interactions. The input to xi is denoted by Ii and it is position speci c. Associated with every oscillator is a bipole cell whose activity is denoted by zi. The activities xi; yi; zi can also be interpreted as the mean potential of a population of cells, which is in accord with recent evidence suggesting that
18
March 11, 1996
Perceptual Framing: Effect of Competition With Competition 6 No Competition Internal time difference (ms)
1 0
−3 0
5
10
20
SOA (ms)
Figure 10: The e�ect of competition on perceptual framing. Solid line: competition at each orientation. Dashed line: no competition. neurons that synchronize do not necessarily oscillate at each cycle (Eckhorn & Obermueller, 1993). The equations governing the oscillators are: FAST SHUNTING EXCITATORY NEURON
dxi = ?Ax + (B ? x ) (Cf (x ) + f (z ) + I ) ? Dx f (y ) i i a i a i i i a i dt
(3)
SLOW ADDITIVE INHIBITORY NEURON
dyi = E (x ? y ) i i dt
(4) where the sigmoid function fa in (3) that transforms cell activity into signals is given by na fa(x) = Qnax+ xna : a
(5)
Equation (3) is a membrane, or shunting, equation which describes the in uences of positive feedback fa(xi) from the ith excitatory cell population to itself, positive feedback fa(zi) from the ith bipole cell, input Ii, and negative feedback from the ith inhibitory interneuron; see Figure 3. The terms (B ? xi) and (?Dxi ) are the shunting terms that automatically gain control the excitatory and inhibitory inputs, respectively. Equation (4) says that the ith inhibitory interneuron slowly time-averages input from the ith excitatory cell. Quantities A; B; C; D; E; na and Qa are parameters of the network. The equation governing the bipole cells is:
19
March 11, 1996
BIPOLE NEURON
zi = [fb(Li) + fb(Ri) + Ffb(Ci) ? ?]+
(6)
nb fb(x) = Qnbx+ xnb :
(7)
where [x]+ = max(x; 0) and the bipole signal function is b
Equation (6) is expressed as an algebraic equation because it is assumed that the bipole cell responds quickly to its input signals. The terms fb(Li ) and fb (Ri) describe input signals to the ith bipole cell from its left and right receptive elds, respectively. The term Ffb(Ci) describes a direct input to the location of the cell body. Each input term in (6) has a nite maximum due to the squashing e�ect of the sigmoid signal fb. The output threshold ? is chosen so that at least two out of three of these receptive eld parts must be active before the cell could re. In principle, parameter F could be chosen so that a single input at the location of the bipole cell could also re it. The terms Li; Ri and Ci that represent these bottom-up inputs to each bipole cell are given by w X L = 1 f (x ) (8) i
w j=1
w X
a
i?j
Ri = w1 fa(xi+j ) j =1 Ci = fa(xi);
(9) (10)
where w is the halfwidth of the kernel. Taken together, equations (3)-(10) de ne a system of Ellias-Grossberg oscillators (Ellias & Grossberg, 1975) coupled together with bipole feedback. Scaling of time was done by taking into account that the period of oscillations should be about 15 ms. This is in line with the recent nding suggesting that oscillations in the primate have a considerably higher frequency (60-90 Hz) than in the cat (30-50 Hz) (Eckhorn, Frien, Bauer, Woelbern, & Kehr, 1993). It was found that putting a timestep of 1 unit in the model equal to 1 ms yielded good results. Numerical integration was performed using a xed step Runge{Kutta method. The integration stepsize used was H = 0:1 ms. The parameters used throughout this report are A = 1; B = 1; C = 20; D = 33:3; E = 0:05; F = 0:5; na = 4; Qa = 0:9; nb = 2; Qb = 0:004; ? = 1; w = 6. The initial conditions of the network were chosen to be xi = yi = zi = 0 for all i, except in the simulation showing synchronization (Figure 11), where the initial conditions were chosen at random. In the simulations of synchronization across the network (Figure 11), 20 nodes received an input of Ii = 0:5. All other nodes received background input of Ii = 0. The initial conditions of the network where chosen to lead to random phases if an input would come on. Hence xi was chosen at random between 0 and 0.15, yi was chosen at random between 0.15 and 0.55, and zi = 0 for all i. See Grossberg and Somers (1991) for additional simulations of the earlier model showing fast synchronization in response to two disjoint input bars and creation of an illusory contour between them. In the simulations of perceptual framing, two nodes received an input (Ii = 0:8) which
20
March 11, 1996
Input
Network Response
input strength
1
Uncoupled
0.2 0 1
Coupled
node
0.2 0 0
20
100 TIME (ms)
Figure 11: Simulation of synchronization of the network when the input is a bar stimulus. Initial conditions were randomly distributed. The input is shown left. The resulting network activities are shown on the right. When there is no coupling via feedback, network cells remain in random phases (top). With coupling, network cells synchronize rapidly from random initial conditions (bottom).
March 11, 1996
21
lasted for 250 ms. The rst input (i = 31) came on at simulation onset, the second input (i = 34) came on later at the SOA. The background activity of the network was zero. In Figure 5, it is shown how much time there was between the last peak of the activity (xi) corresponding to the rst stimulus, and the peak closest in time of the activity corresponding to the second stimulus. This explains why some times are negative. The simulation of TOJ was based on the simulation shown in Figure 5 and was obtained as described in the text. The outcome is shown in Figure 4. In the simulations of spatial pooling, the background activity was set again zero in order to avoid unwanted lateral interactions. For each stimulus size, all cells that received any input at all received it at the same level. In the threshold-contrast simulations, the presentation time was kept constant (20 ms), and the input strength was varied. The threshold input was the lowest value (up to 0.01) that led to oscillations. Inputs below threshold led to non-oscillatory activities. Normalization was done for comparison with psychophysical data (Essock, 1990). Both simulation results and psychophysical data were normalized. Normalization was performed by dividing the input size by the value of that size at which no further threshold reduction occurred (i.e., the asymptotic value). The contrast was normalized in a similar way. The result is shown in Figure 6. In the threshold duration simulations, the input was of high strength (Ii = 0:6). Threshold duration was the briefest period of presentation time that led to oscillations. The same normalization was used for size, and no normalization was necessary for time. The result of this simulations is shown in Figure 7. Noise was added to the system by introducing a random component in the input to each oscillator. That component was uniformly distributed between 0 and 0.2 to generate the simulation summarized in Figure 8. Competition at each location was modeled by having two oscillators at each location, one corresponding to horizontal (xh ; yh) and one to vertical (xv ; yv ) orientations. The slow node of each individual oscillator inhibits not only the fast node of the same oscillator, but also the fast node of the competing oscillator, as is shown in Figure 9. It is assumed that the only possible grouping direction, given the input distribution, is horizontal. The competition equations used are as follows:
dxhi dt dyhi dt dxvi dt dyvi dt
= ?Axhi + (B ? xhi )(Cfa(xhi) + fa(zi) + Ihi) ? D1 xhifa(yhi) ? D2xhifa(yvi)(11) = E (xhi ? yhi )
(12)
= ?Axvi + (B ? xvi )(Cfa(xvi) + Ivi) ? D1xvifa(yvi) ? D2xvi fa(yhi )
(13)
= E (xvi ? yvi ):
(14)
The inhibitory feedback to a fast node from the slow node of the same oscillator is weighted by D1, and from the other oscillator is weighted by D2, with D = D1 + D2 and D chosen as in equation (3). The ratio R = D2 =D1 indicates the strength of competition. The same parameters as before were used, and R was varied between 0 and 1. In the simulations shown in Figure 10, R = 1=9. Larger values of R lead to a decrease of oscillator frequency (Grossberg & Grunewald, 1993).
March 11, 1996
22
The network model is made up of 128 coupled di�erential equations when there is no competition, and 256 when there is competition. Such a large system can exhibit very complex dynamics. In the present simulations, network dynamics were a�ected only quantitatively, but not qualitatively, by modest changes in network parameters. In general, the network parameters (A; B; C; D; ?; w) in the present study were the same as those employed in earlier studies (Ellias & Grossberg, 1975; Grossberg & Somers, 1991), mainly to maintain continuity and to allow comparison. The slow-variable rate parameter E in equation (4) was used to calibrate time in the network. It was chosen to yield realistic oscillation frequencies. Parameter F in equation (6) allows boundaries to cooperatively complete and synchronize at the ends of input bars. The parameters na and Qa in (5) de ne the signal function fa; they were chosen to approximate the signal function used previously (Grossberg & Somers, 1991). The bipole signal function fb in equation (6) is de ned by parameters nb and Qb, to achieve a balance between allowing feedback signals to occur when the inputs to the network was small, yet not saturating the oscillators due to excess feedback when large inputs occurred. One interesting e�ect of the network dynamics is that when an input comes on, which brings one or more nodes into an oscillatory regime, then the rst oscillation takes longer than subsequent oscillations. The reason is that the slow variable requires more time to move into the range of activity that corresponds to the oscillatory regime.
9 Discussion Data about temporal order judgments and spatial pooling have been quantitatively simulated using a neural model of cortical grouping via cooperative-competitive interactions. This process leads to rapidly synchronized cortical activities that de ne a perceptual frame in which object percepts may be elaborated. The cooperative bipole interactions that comprise the model's main synchronization mechanism were predicted to exist in visual cortex in Cohen and Grossberg (1984) and (Grossberg, 1984) and were reported in cortical area V2 by von der Heydt et al. (1984). The rst BCS computer simulations of boundary segmentation used V2 model bipole cells to simulate the long-range interactions that help to form illusory contours (Grossberg & Mingolla, 1985a, 1985b). More recently, similar cooperative interactions, albeit on a smaller spatial scale, have been reported in cortical area V1 (Gilbert, 1993; Gilbert & Wiesel, 1990; Kisv�arday et al., 1995). Grosof et al. (1993) have reported, moreover, that illusory contour completion can be supported over a shorter spatial range by V1 cells. Ross et al. (1995) have described a re nement of the BCS that explains all these data sets. In this model, shorter-range bipole interactions in V1 and longer-range bipole interactions V2 coexist within cooperative-competitive feedback networks at each cortical level. As in the earlier BCS model, the model V2 bipole cells help to achieve long-range boundary completion. The model V1 bipole interactions are mediated by complex cells and are hypothesized to help stabilize the development of orientational and disparity tuning properties in V1 while suppressing network noise. The bipole cells of the present model could, in principle, act at either or both of the V1 or V2 levels, since our results explore key mathematical properties of this mechanism wherever it may be found in the brain.
23
March 11, 1996
References Alonson, J. M., Cudeiro, J., P�erez, R., Gonzalez, F., & Acu~na, C. (1993). Orientational in uences of layer V of visual area 18 upon cells in layer V of area 17 in the cat cortex. Experimental Brain Research, 96, 212{220. Arrington, K. F. (1994). The temporal dynamics of brightness lling-in. Vision Research, 34 (24), 3371{3387. Bacon, J., & King-Smith, P. E. (1977). The detection of line segments. Perception, 6, 125{131. Baldi, P., & Meir, R. (1990). Computing with arrays of coupled oscillators: An application to preattentive texture discrimination. Neural Computation, 2, 458{471. Benzi, R., Sutera, A., & Vulpiani, A. (1981). The mechanism of stochastic resonance. Journal of Physics A: Mathematics and General, 14, L453{L457. Bliss, T. V. P., & Collingridge, G. L. (1993). A synaptic model of memory: long-term potentiation in the hippocampus. Nature, 361, 31{39. Bolz, J., Rosner, G., & Wassle, H. (1982). Response latency of brisk-sustained X and brisk-transient Y cells in the cat retina. Journal of Physiology (London), 328, 171{190. Burkhardt, D. A., Gottesman, J., & Keenan, R. M. (1987). Sensory latency and reaction time: dependence on contrast polarity and early linearity in human vision. Journal of the Optical Society of America A, 4 (3), 530{539. Carpenter, G., & Grossberg, S. (1993). Normal and amnesic learning, recognition and memory by a neural model of cortico-hippocampal interactions. Trends in Neurosciences, 16 (4), 131{137. Celebrini, S., Thorpe, S., Trotter, Y., & Imbert, M. (1993). Dynamics of orientation coding in area V1 of the awake primate. Visual Neuroscience, 10, 811{825. Cohen, M., & Grossberg, S. (1984). Neural dynamics of brightness perception: Features, boundaries, di�usion, and resonance. Perception & Psychophysics, 36, 428{456. Crick, F., & Koch, C. (1990). Towards a neurobiological theory of consciousness. Seminars in the Neurosciences, 2, 263{275. Douglass, J. K., Wilkens, L., Pantazelou, E., & Moss, F. (1993). Noise enhancement of information transfer in cray sh mechanoreceptors by stochastic resonance. Nature, 365, 337{340. Eckhorn, R., Bauer, R., Jordan, W., Brosch, M., Kruse, W., Munk, M., & Reitboeck, H. J. (1988). Coherent oscillations: a mechanism of feature linking in the visual cortex? Biological Cybernetics, 60, 121{130. Eckhorn, R., & Obermueller, A. (1993). Single neurons are di�erently involved in stimulusspeci c oscillations in cat visual cortex. Experimental Brain Research, 95, 177{182. Eckhorn, R., Reitboeck, H. J., Arndt, M., & Dicke, P. (1989). A neural network for feature linking via synchronous activity. In Cotterill, R. M. J. (Ed.), Models of brain function, pp. 255{272. New York, NY: Cambridge University Press. Eckhorn, R., Frien, A., Bauer, R., Woelbern, T., & Kehr, H. (1993). High frequency (60-90 hz) oscillations in primary visual cortex of awake monkey. NeuroReport, 4, 243{246.
March 11, 1996
24
Ellias, S. A., & Grossberg, S. (1975). Pattern formation, contrast control, and oscillations in the short term memory of shunting on-center o�-surround networks. Biological Cybernetics, 20, 69{98. Engel, A. K., Konig, P., Kreiter, A. K., & Singer, W. (1991). Interhemispheric synchronization of oscillatory neuronal responses in cat visual cortex. Science, 252, 1177{1179. Essock, E. A. (1990). The in uence of stimulus length on the oblique e�ect of contrast sensitivity. Vision Research, 30, 1243{1246. Felleman, D. J., & Van Essen, D. C. (1991). Distributed hierarchical processing in the primate cerebral cortex. Cerebral Cortex, 1, 1{47. Field, D. J., Hayes, A., & Hess, R. F. (1993). Contour integration by the human visual system: Evidence for a local \association eld". Vision Research, 33, 173{193. Francis, G., & Grossberg, S. (1995). Cortical dynamics of form and motion integration: Persistence, apparent motion, and illusory contours.. Vision Research, in press. Francis, G., Grossberg, S., & Mingolla, E. (1994). Cortical dynamics of feature binding and reset: Control of visual persistence. Vision Research, 34, 1089{1104. Freeman, W. J., & van Dijk, B. W. (1987). Spatial patterns of visual cortical fast EEG during conditioned re ex in a rhesus monkey. Brain Research, 422, 267{276. Gho, M., & Varela, F. J. (1989). A quantitative assessment of the dependency of the visual temporal frame upon the cortical rhythm. Journal of Physiology (Paris), 83, 95{101. Ghose, G. M., & Freeman, R. D. (1992). Oscillatory discharge in the visual system: Does it have a functional role? Journal of Neurophysiology, 68, 1558{1574. Gilbert, C. D. (1993). Circuitry, architecture, and functional dynamics of visual cortex. Cerebral Cortex, 3, 373{386. Gilbert, C. D., & Wiesel, T. N. (1990). The in uence of contextual stimuli on the orientation selectivity of cells in primary visual cortex of the cat. Vision Rearch, 30, 1689{1701. Gish, K., Shulman, G. L., Sheehy, J. B., & Leibowitz, H. W. (1986). Reaction times to di�erent spatial frequencies as a function of detectability. Vision Research, 26, 745{747. Gove, A., Grossberg, S., & Mingolla, E. (1995). Brightness perception, illusory contours, and corticogeniculate feedback. Visual Neuroscience, 12, 1027{1052. Gove, A., Grossberg, S., & Mingolla, E. (1994). Brightness perception, illusory contours, and binocular corticogeniculate feedback. Visual Neuroscience, in press. Tech. rep. CAS/CNS-TR-94-033, Boston, MA: Boston University. Graham, N., Beck, J., & Sutter, A. (1992). Nonlinear processes in spatial-frequency channel models of perceived texture segregation: E�ects of sign and amount of contrast. Vision Research, 32, 719{743. Gray, C. M., Konig, P., Engel, A. K., & Singer, W. (1989). Oscillatory responses in cat visual cortex exhibit inter-columnar synchronization which re ects global stimulus properties. Nature, 338, 334{337. Gray, C. M., & Singer, W. (1989). Stimulus-speci c neuronal oscillations in orientation columns of cat visual cortex. Proceedings of the National Academy of Sciences USA, 86, 1698{1702. Grosof, D. H., Shapley, R., & Hawken, M. (1993). Macaque V1 neurons can signal `illusory' contours. Nature, 365, 550{552.
March 11, 1996
25
Grossberg, S., Mingolla, E., & Williamson, J. (1995). Synthetic aperture radar processing by a multiple scale neural system for boundary and surface representation. Neural Networks, 7/8, 1005{1028. Grossberg, S. (1973). Contour enhancement, short term memory, and constancies in reverberating neural networks. Studies in Applied Mathematics, LII, 213{257. Grossberg, S. (1976). Adaptive pattern classi cation and universal recoding, II: Feedback, expectation, olfaction, illusions. Biological Cybernetics, 23, 187{202. Grossberg, S. (1980). How does a brain build a cognitive code? Psychological Review, 87, 1{51. Grossberg, S. (1984). Outline of a theory of brightness, color, and form perception. In Degreef, E., & van Buggenhaut, J. (Eds.), Trends in mathematical psychology. Amsterdam: North-Holland. Grossberg, S. (1987). Cortical dynamics of three-dimensional form, color, and brightness perception, I: Monocular theory. Perception and Psychophysics, 41, 87{116. Grossberg, S. (1994). 3-D vision and gure-ground separation by visual cortex. Perception & Psychophysics, 55, 48{120. Grossberg, S., & Grunewald, A. (1993). Statistical properties of single and fast-slow oscillators in noise. In Proceedings of the World Congress on Neural Networks, Vol. IV, pp. 303{307. Hillsdale, NJ: Erlbaum Publishers. Grossberg, S., & Mingolla, E. (1985a). Neural dynamics of form perception: Boundary completion, illusory gures, and neon color spreading. Psychological Review, 92, 173{211. Grossberg, S., & Mingolla, E. (1985b). Neural dynamics of perceptual grouping: Textures, boundaries, and emergent segmentations. Perception & Psychophysics, 38, 141{171. Grossberg, S., & Mingolla, E. (1987). Neural dynamics of surface perception: Boundary webs, illuminants, and shape-from-shading. Computer Vision, Graphics, and Image Processing, 37, 116{165. Grossberg, S., Mingolla, E., & Todorovi�c, D. (1989). A neural network architecture for preattentive vision. IEEE Transactions on Biomedical Engineering, 36, 65{84. Grossberg, S., Pribe, C., & Cohen, M. A. (1994). Neural control of interlimb oscillations I: Human bimanual coordination. Tech. rep. CAS/CNS-TR-94-021, Boston University, Boston, MA. Grossberg, S., & Somers, D. (1991). Synchronized oscillations during cooperative feature linking in a cortical model of visual perception. Neural Networks, 4, 453{466. Grossberg, S., & Somers, D. C. (1992). Synchronized oscillations for binding spatially distributed feature codes into coherent spatial patterns. In Carpenter, G. A., & Grossberg, S. (Eds.), Neural Networks for Vision and Image Processing, pp. 385{405. Cambridge, MA: MIT Press. Grossberg, S., & Todorovi�c, D. (1988). Neural dynamics of 1-d and 2-d brightness perception: A uni ed model of classical and recent phenomena. Perception & Psychophysics, 43, 241{277. Grunewald, A., & Grossberg, S. (1994a). Perceptual framing through neural sycnhronization. Society for Neuroscience Abstracts, 20, 1667.
March 11, 1996
26
Grunewald, A., & Grossberg, S. (1994b). Synchronization of cortical neurons is a mechanism for perceptual framing. Investigative Ophthalmology & Visual Science, 35, 1918. Hirsch, I. J., & Sherrick, C. E. (1961). Perceived order in di�erent sense modalities. Journal of Experimental Psychology, 62, 423{432. Hodgkin, A. L. (1964). The conduction of the nervous impulse. Liverpool, UK: Liverpool University. Hubel, D. H., & Wiesel, T. N. (1968). Receptive elds and functional architecture of monkey striate cortex. Journal of Physiology (London), 195, 215{243. Intraub, H. (1985). Visual dissociation: an illusory conjunction of pictures and forms. Journal of Experimental Psychology: Human Perception and Performance, 11, 431{442. Ja�skowski, P. (1993). Temporal-order judgment and reaction time to stimuli of di�erent rise times. Perception, 22, 963{970. Kapadia, M., Ito, M., Gilbert, C., & Westheimer, G. (1995). Improvement in visual sensitivity by changes in local context: Parallel studies in human observers and in v1 of alert monkeys. Neuron, 15, 843{856. Karni, A., & Sagi, D. (1993). The time course of learning a visual skill. Nature, 365, 250{252. Kisv�arday, Z., Toth, E., Rausch, M., & Eysel, U. (1995). Comparison of lateral excitatory and inhibitory connections in cortical orientation maps of the cat. Society for Neuroscience Abstracts, 907. Konig, P., & Schillen, T. B. (1991). Stimulus-dependent assembly formation of oscillatory responses: I. Synchronization. Neural Computation, 3, 155{166. Kreiter, A. K., & Singer, W. (1992). Oscillatory neuronal responses in the visual cortex of the awake macaque monkey. European Journal of Neuroscience, 4, 369{375. Ku�er, S. (1953). Discharge patterns and functional organization of mammalian retina. Journal of Neurophysiology, 16, 37{68. Lesher, G. W., & Mingolla, E. (1993). The role of edges and line-ends in illusory contour formation. Vision Research, 33, 2253{2270. Longtin, A., Bulsara, A., & Moss, F. (1991). Time-interval sequences in bistable systems and the noise-induced transmission of information by sensory neurons. Physical Review Letters, 67, 656{659. Lumer, E. D., & Huberman, B. A. (1992). Binding hierarchies: a basis for dynamic perceptual grouping. Neural Computation, 4, 341{355. Mason, A., Nicoll, A., & Stratford, K. (1991). Synaptic transmission between individual pyramidal neurons of the rat visual cortex in vitro. Journal of Neuroscience, 11, 72{84. Maunsell, J., & Gibson, J. R. (1992). Visual response latencies in striate cortex of the macaque monkey. Journal of Neurophysiology, 68, 1332{1343. McLean, J. P., Broadbent, D. E., & Broadbent, M. H. P. (1982). Combining attributes in rapid serial visual presentation tasks. Quarterly Journal of Experimental Psychology, 35A, 171{186. McNamara, B., & Wiesenfeld, K. (1989). Theory of stochastic resonance. Physics Review A, 39, 4854{4869.
March 11, 1996
27
Morris, C., & Lecar, H. (1981). Voltage oscillations in the barnacle giant muscle ber. Journal of Biophysics, 35, 193{213. Niebur, E., Schuster, H., Kammen, D., & Koch, C. (1991). Oscillator-phase coupling for di�erent two-dimensional network connectivities. Physical Review A, 44, 6895{6904. Nowak, L. G., Munk, M. H. J., Girard, P., & Bullier, J. (1995). Visual latencies in areas V1 and V2 of the macaque monkey. Visual Neuroscience, 12, 371{384. Oram, M. W., & Perrett, D. I. (1992). Time course of neural responses discriminating di�erent views of the face and head. Journal of Neurophysiology, 68, 70{84. Paradiso, M. A., & Nakayama, K. (1991). Brightness perception and lling-in. Vision Research, 31, 1221{1236. Peterhans, E., & von der Heydt, R. (1989). Mechanisms of contour perception in monkey visual cortex. II. Contours bridging gaps. Journal of Neuroscience, 9, 1744{1763. Pribe, C., Grossberg, S., & Cohen, M. (1994). Neural control of interlimb oscillations II: Biped and quadruped gaits and bifurcations. Tech. rep. CAS/CNS-TR-94-022, Boston University, Boston, MA. Ratli�, F. (1965). Mach Bands: Quantitative studies on neural networks in the retina. New York, NY: Holden Publishing. Ross, W., Grossberg, S., & Mingolla, E. (1995). A neural model of illusory contour formation in areas V1 and V2. Investigative Ophthalmology and Visual Science, 21, 689.6. Sestokas, A. K., & Lehmkuhle, S. (1986). Visual response latency of X- and Y-cells in the dorsal lateral geniculate nucleus of the cat. Vision Research, 26, 1041{1054. Shapley, R. M., & Victor, J. D. (1978). The e�ect of contrast on the transfer properties of cat retinal ganglion cells. Journal of Physiology (London), 285, 275{298. Somers, D. C., & Kopell, N. (1993). Rapid synchronization through fast threshold modulation. Biological Cybernetics, 68, 393{407. Sternberg, S., & Knoll, R. L. (1973). The perception of temporal order: fundamental issues and a general model. In Kornblum, S. (Ed.), Attention and performance IV, pp. 629{685. Academic Pess, New York. Tappe, T., Niepel, M., & Neuman, O. (1994). A dissociation between reaction time to sinusoidal gratings and temporal order judgment. Perception, 23, 335{347. Terman, D., & Wang, D. (1995). Global competition and local cooperation in a network of neural oscillators. Physica D, 81, 148{176. Thomas, J. P. (1978). Spatial summation in the fovea: asymmetrical e�ects of longer and shorter dimensions. Vision Research, 18, 1023{1029. Ueno, T., Pokorny, J., & Smith, V. C. (1985). Reaction times to chromatic stimuli. Vision Research, 25, 1623{1627. Ulrich, R., & Stapf, K. H. (1984). A double-reponse paradigm to study stimulus intensity e�ects upon the motor system in simple reaction time experiments. Perception & Psychophysics, 36, 545{558. Varela, F. J., Toro, A., John, E. R., & Schwartz, E. L. (1981). Perceptual framing and cortical alpha rhythm. Neuropsychologia, 19, 675{686.
March 11, 1996
28
Vogels, R., & Orban, G. A. (1991). Quantitative study of striate single unit responses in monkeys performing an orientation discrimination task. Experimental Brain Research, 84, 1{11. von der Heydt, R., Peterhans, E., & Baumgartner, G. (1984). Illusory contours and cortical neuron responses. Science, 224, 1260{1262. von der Malsburg, C. (1981). The correlation theory of brain function. Tech. rep. 81-2, Gottingen, DE: Max-Planck-Institute. Waxman, A., Seibert, M., Bernardon, A., & Fay, D. (1993). Neural systems for automatic target learning and recognition. Lincoln Laboratory Journal, 6, 77{116. Waxman, A., Seibert, M., Gove, A., Fay, D., Bernardon, A., Lazott, C., Stelle, W., & Cunningham, R. (1995). Neural processing of targets in visible, multispectral IR and SAR imagery. Neural Networks, 8, 1029{1051. Special issue on Automatic Target Recognition. Young, M. P., Tanaka, K., & Yamane, S. (1992). On oscillating neuronal responses in the visual cortex of the monkey. Journal of Neurophysiology, 67, 1464{1474. Zack, J. L. (1973). Estimation of the variability of the latency of responses to brief ashes. Vision Research, 13, 829{835.