Proceedings of the International Symposium on Distributed Computing and Applications to Business, Engineering and Science, pp. x-xx, Wuxi, China, December 2002.
Cost-based Proxy Caching Rassul AYANI Royal Institute of Technology Department of Microelectronics and Information Technology 164-40, Kista, Stockholm, SWEDEN email:
[email protected] Yong Meng TEO and Peng CHEN Department of Computer Science National University of Singapore 3 Science Drive 2 SINGAPORE 117543 email:
[email protected] has been hit-ratio (HR), which is defined as the number of requests satisfied by the cache divided by the total number of requests. Obviously, HR is not an appropriate metric to measure performance of proxy caches, because of the non-uniformity of object sizes and non-uniformity cost of misses. Some researchers have suggested byte hit ratio (BHR), which is defined as the number of bytes found in the cache divided by the total number of bytes requested within the observation period. The BHR takes into consideration the non-uniformity of the object sizes, but it fails to consider the nonuniformity cost of misses. Similar to the Delay Saving Ratio (DSR), which was suggested by Shim [18], we introduce Cost Reduction Ratio (CRR) to measure caching efficiency in reducing the overall cost of data retrieval. We propose a cost efficient proxy caching algorithm (CERA) and compare its performance with several of the other caching algorithms in the literature, including the Greedy Dual-Size (GDS) described in [4].
Abstract Caching has been used for decades as an effective performance enhancing technique in computer systems, among others. However, the traditional cache replacement algorithms are not easily applicable to WWW applications. Moreover, the frequently used hit-ratio and byte-hit ratio are not appropriate measures in WWW applications, because non-uniformity of the object sizes and non-uniformity cost of cache misses in WWW traffic. In this paper, we propose a cost efficient cache replacement algorithm, CERA. We define Cost Reduction Ratio (CRR), as the cost saved by using a cache divided by the total cost if no cache was used. We compare performance of CERA with other caching algorithms using CRR, hitratio and byte-hit ratio as performance metrics. Our experimental results indicate that CERA outperforms LRU, LFU and GDS.
1.
The rest of the paper is organized as following: In section 2 we discuss some metrics for measuring performance of Proxy caches are discussed and in Section 3 we propose a cost efficient caching algorithm. In section 4 we compare performance of our algorithm with LRU, LFU and GDS. Some conclusions are given in section 5.
Introduction
Caching is an effective performance enhancing technique that has been used in computer systems for decades. However, proxy caching differs substantially from the traditional ones. Two main features of the World Wide Web applications that differ from the traditional caching are (i) nonuniformity of the object sizes and (ii) nonuniformity of the cost of cache misses (as opposed to the traditional caching where all cache blocks have the same size and require the same amount of time to be retrieved in case of cache misses). The tradition metrics for measuring caching efficiency
2. Cost Based Caching Generally, the users of Internet can be grouped as: (i) Clients who are looking for a shorter response time, and (ii) Clients who seek to maximize
1
utilization of the bandwidth (for instance an Internet Service Provider, ISP). For the former group the average response time should be minimized, whereas in the latter case the throughput must be maximized. Thus, we employ two cost models to optimize proxy caching for the two targeted user groups. Firstly, a latency model that would measure the download latency perceived by the end users, and secondly a traffic model that would measure the generated network traffic.
misses [3]. However, in the web context, the nonuniformity of object sizes and the non-uniform cost of misses make the LRU algorithm less attractive. We have developed a Cost Effective Replacement Algorithm (CERA) to reduce the overall retrieval cost. We define cost as the download latency perceived by the end user in our latency model, and the amount of generated network traffic in our traffic model. In this paper, CERA(L) and CERA(P) denote CERA using latency model and packet model respectively.
A cache miss incurs a cost for fetching the missing object from its source server. The cost can be measured in two different ways, namely by: (i) the amount of traffic generated to retrieve the missing objects, and (ii) the download latency experienced by the end users to retrieve the missing objects. We define the cost reduction ratio (CRR) in Equation 1.
∑ H * C * 100%, where H = ∑C i
CRR =
i
In CERA, a benefit value (BV) is assigned to each object representing its importance in the cache. When the cache is full, the object with the lowest BV is replaced. Unlike caching in operating systems, web requests refer to objects with varying size and varying retrieval cost of retrieval cost. Hence, CERA considers miss cost, object (or file) size, and access frequency. As shown in equation 2, the BV consists of three parts: normalized cost, re-accessing probability (denoted by Pr) and dynamic aging.
1, if request I is a HIT
i
i
0,
3.1 Re-accessing Probability
Otherwise
The normalized cost of an object is the download latency per byte for the latency model and the amount of communication per byte in the packet model. The re-accessing probability, Pr, indicates the object’s future popularity. The computation of Pr is rather complicated and will be discussed in the full paper. We consider frequency, size and Zipf’s law to estimate Pr, where frequency is defined as the number of previous accesses to an object.
where Ci is the cost for retrieving object i using the “traffic” or the “download latency” definition.
Equation 1: Definition of Cost Reduction Ratio
It should be noted that HR, BHR and CRR measure different aspects of using a proxy cache in a network. A high HR demonstrates that fewer requests being retrieved from the original servers (i.e., more clients experienced shorter response time). However, a high HR does not mean necessarily a lower cost because of the nonuniformity of objects sizes and retrieval costs. A high BHR indicates that fewer bytes have been retrieved from the sources and thus less traffic has been generated, but it doesn’t mean necessarily a lower cost because of the non-uniform cost of retrieval. But CRR measures the cost saving as a result of caching; higher CRR means lower cost (in term of network traffic or perceived latency, depending on which definition of cost being applied).
BV = (Cost / Size) * Pr + Age Cost
Cost of retrieving the object from the original server. It is measured as the download latency or the amount of generated traffic: Latency model Packet model
Pr
Probability of re-accessing an object Pr = Pf Df
3. CERA: A Cost Effective Replacement Algorithm
α b
The LRU is a well performing cache replacement algorithm for applications exhibiting good locality with uniform object size and uniform cost of
SERVER_DURATION field in DEC trace Cost = 2 + Size / 536, SJ trace
Pf (Log10 Size)b
1/α
, where Pf = Df+1 / Df
Conditional probability of re-accessing an object that has been accessed f times Number of documents which have been accessed at least f times Characteristic value of Zipf’s-like distribution; set to 0.77 for DEC and SJ A constant that weights the effect of Size factor; set to 1.3 for DEC and SJ
Size
Size of the requested object
Age
Age of the cache defined as the minimum BV of all objects in the cache
Equation 2: The Complete Expression of Benefit Value for CERA
2
the BV is set equal to its retrieval cost + H. In this way, whenever an object is accessed its BV is updated (its BV is increased), but the BV of those objects that are not accessed remains unchanged.
If an objects has been accessed f times up to now, we estimate the probability of being re-accessed again in the future, Pf, as D f + 1 D f , where Df is the number of documents accessed at least f time. In our simulation, a background process collects the number of accesses to each object and then the new Pf values are calculated periodically. Although Pf values are not accurate, they should represent good estimates for Pr in the steady state.
3.2 Impact of Probability
Size
on
4.
In this section, we compare the performance of CERA with LRU, LFU [16] and the GDS (Greedy Dual Size) [4] using a trace driven simulator. We selected three traces collected by different sources to test the performance of proxy cache replacement algorithms. Since small and large traces exhibit different behavior, we chose a short 3-day trace and two longer 30-day traces. The 3-day trace (referred to as DEC) was collected by Digital Equipment Corp [10], the other two are downloaded from the National Laboratory for Applied Network Research, NLANR [10], and are referred to as SJ and BO respectively. These traces represent different types of workload.
Re-accessing
It has been shown that Web requests have a strong preference for smaller files [6, 7, 8, 13, 15]. Furthermore, it has been advocated that the average access rate of an object can be estimated given its size. Let R be the average access rate to an object and S is its size. R can be estimated as R=C/Sb, where C and b are two constant factors [18, 19]. However, it is well known small files often dominate that web workload. Consequently, using the size of the object directly to estimate its reaccessing probability may over-compensate the small files. To avoid such situations, a logarithmic scale is often used to estimate the average access rate [1]. Hence, we estimate the re-accessing probability considering object’s size in Equation 3. Ps =
C (Log 10 Size)b
Performance Measurement
The proxy server for DEC trace is a corporate proxy with heavy web traffic servicing over 10,000 clients. The original DEC trace contained four weeks of data, but we extracted three days of the requests. Unlike DEC trace, SJ trace was collected for a regional proxy server at MAE-West Exchange Point in San Jose, California [10]. Table 1 illustrates major characteristics of DEC, SJ and BO traces.
, where b = 1.3 and C is a constant Property
DEC Trace
SJ Trace
BO Trace
Equation 3: Re-accessing Probability Considering Size
Trace size
262.4 MB
292.4 MB
658.5 MB
It has been shown that web requests do not follow exactly Zipf’s law. Brelau introduces a model for web requests, shown in equation 4, which follows a Zipf’s-like behavior [6, 7].
Duration
3 days
30 days
30 days
No. of all requests
2,133,953
2,163,985
4,716,277
No. of distinct requests
857,914
960,818
2,480,375
Size of all requests
21.1 GB
41.6 GB
81.5 GB
Size of distinct requests
11.1 GB
19.3 GB
37.8 GB
Average size of distinct requests
12,880 Byte
20,071 Byte
15,241 Byte
Standard deviation of distinct requests
99,551 Byte
215,887 Byte
601,202 Byte
P=
K , where R is the page’s popularity ranking, Rα
and K and α are two workload dependent parameters Equation 4: A General Model representing a Zipf’s-like Behavior
Table 1: Major Characteristics of the Three Traces
3.3 Aging Policy
We have used three traces, but only the results of two of them are presented in this report. The results of DEC trace are shown in Figures 1 to 3 and the results of BO trace in Figures 4 to 6.
In CERA, we use a dynamic aging policy similar to the one proposed by Arlitt and Dilley [5]. In our aging scheme, the cache age is the time of the latest access. When an object is brought to the cache its BV is set to its retrieval cost plus H (initially H=0). In case of cache hit, H is set to the current time and
In our performance evaluation, CERA(L) and CERA(P) denote CERA for latency and packet cost
3
model respectively, and similarly GDS(L) and GDS(P) denote the GDS algorithm for latency and packet cost model respectively.
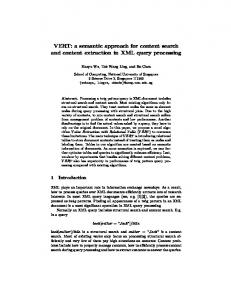
CERA(L) does not illustrate any impressing performance in term of BHR.
Hit Ratio %
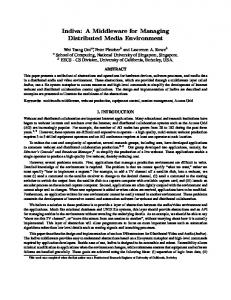
4.1 DEC Trace Figure 1 compares the cache performance for cost based algorithms (CERA and GDS), LRU and LFU in term of CRR. CERA(L) outperforms the other replacement algorithms in term of CRR for all cache sizes. The CRR obtained by CERA is up to 140% better than LFU and LRU for a 10MB cache. While in a 1GB cache CERA(L) performs 23 % better than LFU. GDS, which considers cost, size and aging policy, performs much better than LRU and LFU. But, CERA(L) performs better than GDS(L) and its relative improvement ranges from 24% for small cache to 5% for the largest cache size.
0
200
CERA(L)
CERA(P)
GDS(L)
GDS(P)
LFU
LRU
400
600
800
1000
Cache Size (MB)
Figure 2: DEC Trace - Hit Ratio 40
Byte Hit Ratio %
35
45 40 35 CRR (in percent)
60 55 50 45 40 35 30 25 20 15 10
30
30 25 20 15
CERA(L)
CERA(P)
10
GDS(L)
GDS(P)
LFU
LRU
5
25
0
20 15 10
CERA(L)
CERA(P)
GDS(L)
GDS(P)
LFU
LRU
0
200
400
600
800
1000
Cache Size (MB)
Figure 3: DEC Trace - Byte Hit Ratio
5 0 0
200
400
600
800
4.2 SJ Trace
1000
Cache Size (MB)
Since the download latency for each request is not included in this trace [10], we are not able to calculate the BV for CERA(L). Hence, for this trace we measure performance of CERA(P) and compare it with GDS(P) , LRU and LFU. The performance results are shown in Figure 4, Figure 5 and Figure 6.
Figure 1: DEC Trace - Cost Reduction Ratio CERA(P) is also better at reducing cost than LRU, LFU and GDS. More concretely, performance of CERA(P) is 67% higher than LRU for a 50MB cache and 50% higher for 100 MB cache . Figure 2 compares performance of the algorithms in term of HR. With moderate cache sizes (200MB and 400MB), CERA(P) gives about 50% HR improvement compared to LRU and LFU. The HR of GDS(P) is a little better than LRU and LFU. GDS(P) does not consider cold cache pollution, therefore its performance is not well optimized.
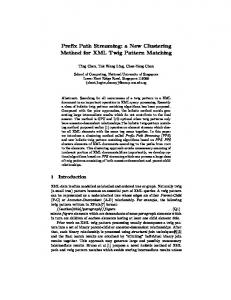
Similar to the DEC trace, CERA(P) consistently performs best in reducing the cost of retrieval (see Figure 4). However, the degree of improvement is not as high as for the DEC trace. When the cache size is small (18MB), CERA(P) outperforms GDS(P) by around 5% and exceeds LFU by around 13%. In terms of HR ( Figure 5) and BHR ( Figure 6), CERA(P) still outperforms the other replacement algorithms as it did for DEC trace.
Figure 3 compares performance of the algorithms in term of BHR. CERA(P) is about 10% better than LRU and 20%-30% better than LFU. However,
4
In CERA, one important component of the BV is the predicted re-accessing probability. With CERA, objects that are predicted be accessed again in the future stay in the cache for a longer time. Consequently, if the workload demonstrates a high short-term temporal locality, there will be more hits in a cache with CERA.
Cost Reduction Ratio %
55 50 45 40 CERA(P)
35
GDS(P) LFU
30
LRU
25 0
500
1000
4.3 BO Trace
1500
Cache Size (MB)
The simulation results for the BO trace are similar to those for the SJ trace because they represent similar workload characteristics. In term of CRR, CERA(P) is the best of the four algorithms (see Figure 7). When the cache size is set to 5% and 10% of the total size of the distinct objects, CERA(P) is only 3 - 4% less than its upper bound (i.e.., the 54.3% improvement achieved for infinite cache size).
Figure 4: SJ Trace - Cost Reduction Ratio 55
Hit Ratio %
50 45 40 35
CERA(P)
30
Similar to DEC and SJ trace, CERA(P) performs best in term of CCR and HR. The superiority is even more significant than the previous traces. With 180MB cache size, CERA(P) has a HR that is 70% higher than LRU, 35% higher than LRU and 24% higher than GDS(P). The improvements are remarkable for other cache sizes too (see Figure 8). However, CERA(P) is not always the best in term of BHR for BO trace (see Figure 9) . For larger cache sizes it has the best BHR, but not for small caches. Considering the performance improvements of CERA in term of CRR and HR, the slight decrease in BHR for smaller cache sizes is negligible.
GDS(P) LFU
25
LRU
20 0
450
900
1350
1800
Cache Size (MB)
Figure 5: SJ Trace - Hit Ratio 50
Byte Hit Ratio %
45 40 CERA(P)
35
GDS(P)
55
LFU
30
Cost Reduction Ratio %
LRU
25 0
500
1000
1500
Cache Size (MB)
Figure 6: SJ Trace - Byte Hit Ratio Note that there are two main differences between the SJ and DEC results. First, GDS(P) does not show significant improvements in reducing the cost for SJ Trace ( Figure 4). Second, CERA(P) has the best BHR but the performance improvement is small compared to the improvement in DEC trace (compare Figure 3 and Figure 6).
50 45 40 35 30 25
CERA(P)
GDS(P)
LFU
LRU
20 0
600
1200
1800
2400
3000
Cache Size (MB)
Figure 7: BO Trace - Cost Reduction Ratio
5
3600
50
•
CERA(P) outperforms the other algorithms in term of BHR for large caches, but it shows slightly lower performance for small caches.
•
The performance improvement of CERA over the other algorithms depends on the workload characteristics, but it performs best for workloads exhibiting good short-term temporal locality.
45 Hit Ratio %
40 35 30 25 20
CERA(P)
GDS(P)
15
LFU
LRU
10 0
600
1200
1800
2400
3000
3600
Acknowledgements
Cache Size (MB)
This project is supported by a joint research grant from Fujitsu Computers (Singapore) Pte Ltd and the National University of Singapore.
Figure 8: BO Trace - Hit Ratio
References
55
1. A. Iuutonen, “Web Proxy Servers”, Prentice Hall, December 1997.
Byte Hit Ratio %
50
2. P. Lorenzetti and L. Rizzo, “Replacement Policies for A Proxy Cache”, http://www.iet.unipi.it/~luigi/caching.ps.gz, 1998.
45 40
CERA(P) GDS(P)
35
LFU 30
3. P. Cao and S. Irani, “Cost-Aware Proxy Caching Algorithm”, Proceedings of the 1997 USENIX Symposium on Internet Technology and Systems, December 1997.
LRU
25 0
600
1200
1800
2400
3000
3600
Cache Size (MB)
4. A. Bestavros and S. Jin, “Greedy Dual* Web Caching Algorithm, Exploiting the Two Sources Of Temporal Locality in Web Request Streams”, 5th International Web Caching and Content Delivery Workshop, Lisbon, Portugal, 22-24 May 2000.
Figure 9: BO Trace - Byte Hit Ratio
5. Conclusions We proposed a proxy cache replacement algorithm CERA, which consists of three parts: cost, reaccessing probability and aging. We conducted several experiments using three traces and compared performance of CERA with LRU, LFU and GDS. As metrics we used hit-ratio (HR), bythit-ratio (BHR) and cost reduction rate (CRR) to measure and compare performance of these algorithms. Our experimental results show that:
5. M. Arlitt and J. Dilley, “Improving Proxy Cache Performance: Analysis of Three Replacement Policies”, IEEE Internet Computing, November/December 1999.
•
CERA with the latency model, denoted as CERA(L) consistently outperforms the other algorithms in term of CRR.
•
CERA with the packet model, denoted as CERA(P) consistently outperforms the other algorithms in term of HR.
7. L. Brelau, P. Cao, F. Li, G. Phillips and S. Shenker, “On the Implications of Zipf’s Law for Web Caching”, http://www.cs.wisc.edu/~cao/papers/zipfimplication/.
6. L. Brelau, P. Cao, F. Li, G. Phillips and S. Shenker, “Web Caching and Zipf-Like Distributions: Evidence and Implication”, IEEE Infocom, Vol. XX, No. Y, Month 1999.
8. M. Arlitt and C. Williamson, “Web Server Workload Characterization: the Search for Invariant”, SIGMETRICS 96, May 1996, PA, USA
6
9. M. Abrams and R. Wooster, “Proxy Caching that estimates page load delays”, Technical Paper 24061-0106, Virginia tech Network Research Group, Computer Science Dept, Blacksburg, VA, December 1999.
Traces”, Technical Report TR-95-010, Boston University, Apr. 1995. 16. Z. Liu,, N. Niclausse, and P. Nain, “A New Efficient Caching Policy for WWW”, Proceedings of the 1998 Internet Server Performance Workshop (WISP ’98), Madison, WI, pp.119-128, June 1998.
10. Digital Equipment Cooperation, Digital Web Proxy Traces, ftp://ftp.digital.com/pub/DEC/traces/proxy/we btraces.html.
17. R. Karedla, J.S. Love, B.G. Wherry, "Caching Strategies to Improve Disk System Performance”, IEEE Computer, pp. 38-46, Vol. 27, No. 3, March 1994.
11. National Laboratory for Applied Network Research, Squid 2.0 Web Proxy Traces, ftp://ircache.nlanr.net/Traces/. 12. P. Barford, A. Bestavros, A. Bradely and M. Vrovella, “Changeds in Web Client Access Patterns, Characteristics and Caching Implications”, BUCS-TR-1998-023, November 1998.
18. J. Shim, P. Scheumermann and R. Vingralek, “Proxy Cache Algorithms: Design, Implementation, and Performance”, IEEE Transactions on Knowledge and Data Engineering, Vol. 11, No. 4, July/August 1999.
13. A. Mahanti, “Web Proxy Workload Characterization and Modeling”, A thesis submitted in Dept. of Comp., Univ. of Saskatchewan, September 1999.
19. C. Cunha, A. Bestavros and M. Crovella, “Characteristics of WWW Client-Based Traces”, Technical Report TR-95-010, Boston Univ. Apr. 1995.
14. E.J. O’Neil, P.E. O’Neil, G. Weikum, “The LRU-K page replacement algorithm for database disk buffering”, Proceedings of ACM SIGMOD, 1993.
20. G. K. Zipf. “Relative Frequency as A Determinant of Phonetic Change”, Reprinted form the Harvard Studies in Classical Philology, Vol XL, 1992.
15. A. Bestavros, M. Crovella and C. Cunha, “Characteristics of WWW Client-Based
7