735
Journal of Alzheimer’s Disease 26 (2011) 735–744 DOI 10.3233/JAD-2011-110065 IOS Press
Cost-Effectiveness of a Health Intervention Program with Risk Reductions for Getting Demented: Results of a Markov Model in a Swedish/Finnish Setting Yanlei Zhanga,b , Miia Kivipeltoc,d , Alina Solomonc,d and Anders Wimoc,e,∗ a Department
of Public Health Sciences, Karolinska Institutet, Stockholm, Sweden of Public Health, Hjelt Institute, University of Helsinki, Helsinki, Finland c Aging Research Center (ARC), Department of Neurobiology, Care Sciences and Society Karolinska Institutet, Stockholm, Sweden d Department of Neurology, University of Eastern Finland, Kuopio, Finland e Alzheimer Disease Research Center (KI-ADRC), Department of Neurobiology, Care Sciences and Society, Karolinska Institutet, Stockholm, Sweden b Department
Accepted 10 May 2011
Abstract. Risk scores based on modifiable factors have recently been developed for dementia. This study aims to estimate the cost-effectiveness of a potential preventive intervention program meant to lower the score related to increased dementia risk. Analyses were based on a Markov model adapted to Swedish circumstances. Risk score categories and risk probabilities were derived from the Cardiovascular Risk Factors, Aging and Incidence of Dementia (CAIDE) study in Finland. Figures of costs, utilities, and mortality were obtained from literature or databases. One-way sensitivity analysis and probabilistic sensitivity analysis were carried out to investigate the robustness of the model and to identify which model inputs had most impact on the results. In the base case, the usual care had a cost of 621,000 SEK and utilities of 11.8438 quality-adjusted life year (QALYs). The intervention had a cost of 599, 026 SEK and utilities of 11.8950 QALYs. The cost was 21,974 SEK lower in the intervention with 0.0511 QALYs gained over a 20 years horizon, indicating absolute dominance. The support for cost-effectiveness was insensitive to changes in the value of QALY for demented, mortality, and risk of dementia. If the intervention program was assumed to run every year, the incremental cost-effectiveness ratio did not show absolute dominance but was still under the willingness-to-pay level. The probabilistic sensitivity analysis indicated cost effectiveness in 67% of the samplings given a willingness-to-pay level of 600,000 SEK/year. This is a promising outlook for future research on preventive interventions in dementia, emphasizing the need of conducting multi-domain randomized trials. Keywords: Cost and cost analysis, dementia, economics, risk, risk reduction behavior
INTRODUCTION ∗ Correspondence
to: Professor Anders Wimo, Alzheimer Disease Research Center (KI-ADRC), Department of Neurobiology, Care Sciences and Society, Novum 5th floor, SE-14157, Huddinge, Sweden. Tel.: +46 705795383; Fax: +46 8 585 836 10; E-mail:
[email protected].
Dementia is one of the most frequent causes of disability and mortality among elderly, representing a major public health challenge in the context of worldwide population aging. In the European Health Report
ISSN 1387-2877/11/$27.50 © 2011 – IOS Press and the authors. All rights reserved
736
Y. Zhang et al. / Dementia Risk Reduction
2009 (WHO), dementia/Alzheimer’s disease (AD) was the 12th leading cause of disease burden, accounting for 2.03% of disability adjusted life years (DALYs) lost in the European Region, and expected to increase [1]. About 35 million people worldwide currently have dementia, with societal costs estimated to 604 billion US$ [2]. No disease-modifying treatment is currently available for dementia, and drugs approved for AD have mainly symptomatic effects [3]. Finding effective preventive interventions is thus particularly important. Delaying AD onset with 5 years has been estimated to halve the prevalence of the disease [4, 5]. Several modifiable vascular and lifestyle-related risk factors have been suggested for dementia/AD [6]. Many such risk factors (hypertension, hyperlipidemia, obesity, diabetes, etc.) are shared with cardiovascular and cerebrovascular conditions, which themselves seem to increase dementia risk [7, 8]. Derived from the model of risk scores currently used for cardiovascular events, stroke, or diabetes, an estimation tool has been developed to predict dementia risk 20 years later based on midlife risk profiles in the Cardiovascular Risk Factors, Aging, and Incidence of Dementia (CAIDE) population-based study in Finland [6]. The CAIDE Dementia Risk Score includes age, gender, education, and several midlife factors (systolic blood pressure, BMI, total cholesterol, and physical activity), with a range of 0 to 15 points, where an increasing score indicates increasing dementia risk. Although reducing the risk of chronic diseases has the potential to be cost-effective in many cases, for instance cardiovascular disease and type 2 diabetes [9–11], no studies have so far investigated whether preventive interventions in dementia can be cost-effective. Previous dementia prevention trials with single agents (i.e., cholesterol, estrogen, NSAIDs, vitamin E, etc) or single-domain interventions (i.e., physical activity, cognitive training) in elderly or already cognitively impaired persons had either disappointing or modest results [12]. As multi-domain strategies are only beginning to be applied [13, 14], and no economic or empirical intervention data are yet available, economic simulation analyses can be used to estimate cost-effectiveness as an alternative to running a large intervention study with a long follow-up [15]. There is a similar focus on simulations in the pharmacoeconomics of AD [16, 17]. The present study aims to evaluate the potential cost-effectiveness of a previously used multi-domain cardiovascular disease prevention program. We assume it would reduce the number of points on the CAIDE Dementia Risk Score [18] and
thus reduce the number of incident cases of dementia. METHODS The markov model To estimate the societal disease-related costs and health utilities, a Markov model adapted to Swedish circumstances was constructed. Data used in this study were derived from a number of sources. The main source of risk scores categories and risk probabilities was CAIDE Dementia Risk Score [6]. The score (0–15) was divided into 5 categories. The risk of dementia according to the categories was 1.0% for those with a score of 0–5, 1.9% for a score of 6–7, 4.2% for a score of 8–9, 7.4% for a score of 10–11, and 16.4% for a score of 12–15. Similar occurrence rates of dementia and risk factor –dementia associations have been reported in Finland and Sweden [19] and thus, we assumed that these risk scores categories and risk of dementia were adoptable in Sweden as well. The score of 8–9 points was chosen as base case for comparisons (“usual care”) because of the similarity of dementia risk with the incidence of dementia during the 20 years of follow up (4%), and the score of 0–5 points was chosen as comparator (“intervention”). The justification for this assumption is that we wished to see whether strong health trends, which are in focus in public policy making, could have an impact on dementia (but we also included the weaker option 6–7 points) in the sensitivity analysis. We developed a Markov model to characterize dementia in three health stages: (I) no dementia; (II) dementia; (III) dead. For dementia and no dementia, individuals can be assigned a probability of surviving or dying. Surviving individuals may have no dementia or may transit to dementia; however, it is assumed that once an individual is diagnosed with dementia, he or she cannot remit from this state to a state without dementia (giving a transition probabilities of 0 for that branch) (Fig. 1). The length of the cycle is 1 year and the time horizon is 20 years, which is in line with the follow-up time in the CAIDE study. The probability of getting dementia was calculated from the score categories in the CAIDE Dementia Risk Score. As estimated risks were based on a 20 years follow-up in the CAIDE study, the 20 years rate was converted into annual risk and linear risk, by using the equation: p1year = 1 − (1 − p20 year )1/20. (Table 1). From the literature, it is known that the incidence and prevalence of dementia increase exponentially with
Y. Zhang et al. / Dementia Risk Reduction
737 Not demented
Survive Have dementia
No dementia Die
Not demented Have dementia
Dementia Die
Dementia
Dead
Survive
Usual care
No dementia
No dementia Dementia
Dead
Dead Not demented
Dementiariskreduction
No dementia
Survive Have dementia
No dementia
Dementia Die
Dead Not demented No dementia
Survive
Intervention
Have dementia
Dementia
Dementia Die
Dead
Dead
Fig. 1. Markov model structure (The transition to the state of Not demented from being in the state of Dementia have a probability of zero in both arms). Table 1 Risk of dementia in different scores Risk* 20 Years
Annual risk p 1 year = 1−(1−p20 year )1/20
SE
Risk Score 0–5 6–7 8–9** 10–11 12–15
1% 1.90% 4.20% 7.40% 16.40%
0.00050239 0.00095868 0.00214308 0.00383667 0.00891634
0.0002588 0.0004189 0.000591 0.0008929 0.0021077
*In core paper [6]; ** Base case in model.
age, with a doubling of risk for every 5th year of increased age [3, 20–22]. The annual risk was used as the risk at year 10 (age = 60), assuming that it is halved at year 5 (expressed as 5 year classes, age = 55) and doubled year 15 (age = 65), thus intrapolating the risks for the whole 20 years period (the parameters and the assumptions of the Markov model are summarized in Table 2). The mortality figures are derived from the Swedish death register in 2005 by Statistics Sweden (Statistiska centralbyr˚an) [23]. It includes an average death risk depending on age for both men and women but not for dementia specifically. So far, published intervention studies of dementia have not shown any statistically significant differences in mortality (even if there have
been trends for a lower mortality in some drug trials [3]). We thus assumed the same mortality for both demented and non-demented subjects in the base case. However, epidemiological studies have shown an increased (roughly doubled) mortality of people with dementia, so there are several options with increased mortality for persons with dementia in the sensitivity analysis. However, since the people in the epidemiological studies are older than 50–70 years as in this model [24], we did not consider this as the main option. Costs Costs for people with and without dementia are mainly derived from a comprehensive report by the Swedish National Broad of Health and Welfare (Socialstyrelsen) [25, 26] where the number of people with dementia, as well as the societal costs of dementia (including i.s. costs of informal care), were estimated. For people without dementia, the costs fall within the daily care of elderly. A regression model was used to test whether age had a significantly contribution to the costs. Included parameters were age, gender, living situation (institutionalized or not), cognitive status, and ADL-capacity. The data used in this regression
738
Y. Zhang et al. / Dementia Risk Reduction Table 2 Assumptions and parameter values for the Markov model (base case)
Parameter
Value(Range)
Description
Duration Cycle StartAge Risk of dementia Prob Base Prob Ris Tdemriskbase Tdemriskint Mortality TMortRisk Cost’ CDementia cnoDementia cIntervention tCostbaseDem tCostbasenoDem tCostrisDem tCostrisnoDem Health utility eQALYdem eQALYnondem Others UDR CDR
20 years 1 year 50
Model length Length of 1 cycle Initial age to start the model
Reference
0.00214308 0.00050239 0.000535769–0.008572302 0.000125598–0.002009562
Risk of getting dementia with usual care (non-intervention) Risk of getting dementia in intervention case Risk varied by age with usual care for 20 years Risk varied by age in intervention case for 20 years
[6] [6] [6] [6]
0.002122744–0.015021042
Mortality varied by age, similarly in both arms for 20 years
[23]
352,300 76,891 1,187 289,645–328,048 17,959–69,819 290,832–329,235 19,146–71,006
Cost per demented person for 1 year in core paper Cost per non demented person for 1 year in core paper Cost per person for intervention Table of cost varied by age of dementia with usual care Table of cost varied by age of no dementia with usual care Table of cost varied by age of dementia with intervention Table of cost varied by age of no dementia with intervention
[25] [25] [27, 29–31] [39, 40] [39, 40] [27, 29–31] [39, 40] [27, 29–31] [39, 40]
0.486–0.457 0.845–0.795
Quality-of-life weight for 20 years in dementia state Quality-of life weight for 20 years in no dementia state
[33] [32]
0–5% 0–5%
Discount rate for utility Discount rate for costs
[41]
*1US$ ≈7.50 SEK and 1D ≈ 9.30 SEK.
model derive from a bottom-up cost database from the Nordanstig-Kungsholmen project in Sweden [26]. The yearly cost of a person with dementia in the report was 352,300 SEK, and 76,891 SEK for a person without dementia. However, age contributed significantly to the regression model both for dementia and lack thereof, with coefficients of 2,357 SEK per year for no dementia and 1,746 SEK per year for dementia. Since the age of people in the report [25, 26] was higher, the basic yearly costs in the model were adjusted downwards and intrapolated to simulate yearly costs from age 50 to 70. In the intervention case, the cost of the intervention health program was added (see below). Future costs were discounted at 3% and all costs represent the levels from 2005 (1US$ ≈ 7.50 SEK and 1D ≈ 9.30 SEK)
Table 3 The multi domain health promotion program [27] Cost (SEK)* Screening Labor and laboratory costs Participation time cost Population measures Dietician Marking of groceries The local authorities Study circles Total
877 751 1,141 275 688 283 4,017
*1US$ ≈7.50 SEK and 1D ≈ 9.30 SEK.
studied in the WHO MONICA project [28], on which the CAIDE study is also based [6]. The assumed drug treatment costs (Table 4) were based on the figures of prevalence, estimated propor-
Cost of the intervention The prevention program consisted of two main components, a health promotion program and pharmacological treatment of cardiovascular risk factors. Since there are no intervention costs available from the CAIDE study, we used the cost figures from the community-based cardiovascular disease prevention program (Table 3) in Norsj¨o, V¨asterbotten county, Sweden [27]. V¨asterbotten was one of the populations
Table 4 Costs of drug treatment per year Condition Hypertension Hyperlipidemia Diabetes Total Drug costs
Prevalence* Proportion of treated 40% 90% 6%
50% 20% 90%
Drug
Cost (SEK)*
Enalapril Simvastatin Metformin
80 72 31 183
*Prevalence at age 50; **1US$ ≈ 7.50 SEK and 1D ≈ 9.30 SEK.
Y. Zhang et al. / Dementia Risk Reduction
tion of treated patients with cardiovascular risk factors and costs of the most common recommended drugs from various Swedish reports [29–31]. We have not included drugs that are available for specific treatment of AD (e.g., acetylcholine esterase inhibitors and memantine). As the effects of the risk factors intervention program are expected to decrease with time, we assumed that the health promotion program was run five times during 20 years, giving an average annual cost of 1,187 SEK per person (((5*4,017 SEK) + (20*183 SEK))/20). In the sensitivity analysis, however, we assumed that the health promotion program was run every year. Utilities The health utilities are expressed as quality adjusted life years (QALYs), discounted at 3%. The QALYs of people with and without dementia were derived from two different sources, both in terms of EQ5D [32], which is based on the following dimensions: mobility, self-care, usual activities (e.g., work, study, homework or leisure activities), pain/discomfort, and anxiety/depression. The source of QALYs for dementia was a Swedish cross-sectional observational study [33], while for no dementia, the utility figures were derived from a population based study in Stockholm, Sweden [32]. As we only had the empirical age dependent data for people with no dementia, we assumed for the QALYs of people with dementia that the age dependency trends as well as variability followed the same patterns as for QALYs of people with no dementia. Sensitivity analysis Since this study involves synthesizing data from a number of sources and several assumptions, it is important to assess the uncertainties in the model under varying assumptions. One-way sensitivity analysis evaluated the robustness of single variables. We thus tested various mortality risks for people with dementia versus people with no dementia. The base case figures were discounted by 3% but in the sensitivity analysis, discount rates of 0 and 5% were also used. We also tested a less effective risk score of 6–7 points as intervention effect, and in another option, we assumed that the intervention program was running every year. Finally, the QALYs of demented were ad hoc increased and decreased by 20%. Second order probabilistic sensitivity analysis of the uncertainty of parameters was undertaken by Monte
739
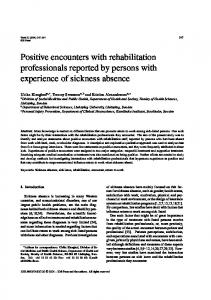
Carlo simulation [34]. These parameters included the risks of dementia, costs and QALYs. Since costs are skewed, gamma distributions were used for the costs in the model. The results were plotted on an incremental cost-effectiveness ratio (ICER) scatterplot. The willingness to pay (WTP) level was set to 600,000 SEK per gained QALY, which roughly reflects an accepted WTP level in Sweden, although there is a great range between SEK 40,000 and 1,300,000 in the level underlying decisions by the Swedish reimbursement authority TLV [35]. Ethical considerations The economic model is based on previously published papers and reports. No new study persons or patients or similar has been involved in the project. Thus, there is no need for additional ethical permissions. RESULTS Base-case analysis After 20 cycles (years), 4.8% of the simulated population with usual care had converted to dementia, 83.1% was still in the no dementia state and 12.1% had died. In contrast, 1.2% of the population with the intervention had converted to dementia. The mortality was as assumed the same. The incremental cost-effectiveness ratio (ICER), represents the additional cost of one unit of outcome gained (QALY) by the intervention, when compared to usual care. In the base case analysis, the intervention shows lower costs and gained QALYs compared with usual care (non-intervention), indicating absolute dominance since the intervention is both cheaper and better (Table 5). In all scenarios of the one-way sensitivity analyses except one, the results still supported absolute dominance (Table 6). The mortality is low in all scenarios and different mortality assumptions do not influence on the results. The smaller intervention effect (a reduction of the risk score to 6–7 instead of 0–5 as in the base case) still indicates absolute dominance, although with a smaller margin. When the intervention was assumed to run every year, there was an extra cost of 21,822 SEK to gain 0.0511 utilities, corresponding to an ICER of 426,901 SEK per gained QALY (but still below the WTP level of 600,000 SEK per gained QALY). The probabilistic Monte Carlo simulation in Fig. 2 illustrates the 95% confidence ellipse for the ICER.
740
Y. Zhang et al. / Dementia Risk Reduction
With a WTP of 600,000 SEK per gained QALY, there is a probability of 67% for cost-effectiveness with the intervention (67% of the dots are in components C1C3 in Fig. 2, are under the WTP-line). An acceptability analysis shows that with a WTP of 185,000 SEK, the probability of cost effectiveness is equal between the two options. DISCUSSION This is the first analysis showing cost-effectiveness of a dementia risk reduction strategy that combines multi-domain lifestyle and pharmacological interven-
tions. After 20 years, the proportion of subjects with dementia in the usual care group was, although on a low level in terms of percentages, four times higher than in the intervention group. Since the absolute risk levels are small between 50–70 years of age and a large population is exposed to the intervention, it is interesting that the intervention simulation nevertheless indicated cost effectiveness. The number of people in core paper by Kivipelto et al. (n = 2000) is big enough due to the definitions of the underlying diseases and life style factor of the risk scores. As we used the standard risks of developing dementia in comparison with the low absolute risks of
Table 5 Results of Cost Effectiveness Analysis (base case) Strategy
Cost (SEK)*
Incremental Cost
Effect (QALYs)
Incremental effectiveness
Incr C/E(ICER)
Intervention Usual care
599,026 621,000
21,974
11.8950 11.8438
–0.0511
Dominated**
QALY = quality-adjusted life year, C/E = cost effectiveness; ICER = incremental cost-effectiveness ratio; *1US$ ≈7.50 SEK and 1D ≈ 9.30 SEK; **Intervention is both cheaper and better.
Table 6 Result of one-way sensitivity analysis Alternative
Strategy
Base case
Usual care (UC) Intervention Difference Usual care Intervention Difference Usual care Intervention Difference Usual care Intervention Difference Usual care Intervention Difference Usual care Intervention Difference Usual care Intervention Difference Usual care Intervention Difference Usual care Intervention Difference Usual care Intervention Difference
Mortality in dementia 1.5x versus base case Mortality in dementia 2x versus base case Mortality in dementia 4x versus base case QALYs – 20%
QALYs + 20%
Discount rate 0%
Discount rate 5%
Risk score 6–7
Program every year
*1US$ ≈7.50 SEK and 1D ≈ 9.30 SEK.
Cost (SEK)* 621,000 599,026 21,974 620,067 598,805 21,262 619,156 598,589 20,567 615,722 597,775 –17,947 621,000 599,026 21,974 621,000 599,026 21,974 875,582 837,901 37,681 503,943 488,699 15,244 621,000 610,013 10,986 621,000 642,822 21,822
Effect (QALY) 11.8438 11.8950 –0.0511 11.8425 11.8946 –0.0521 11.8412 11.8943 –0.0531 11.8362 11.8932 –0.0569 11.8257 11.8907 –0.0649 11.8620 11.8992 –0.0373 15.530 15.609 –0.079 10.081 10.120 –0.039 11.8438 11.8806 –0.0368 11.8438 11.8950 –0.0511
ICER
UC dominated
UC dominated
UC dominated
UC dominated
UC dominated
UC dominated
UC dominated
UC dominated
UC dominated
426,901
Y. Zhang et al. / Dementia Risk Reduction
741
Fig. 2. The incremental cost effectiveness scatter plot. WTP = Willingness to pay. Dots in Components C1–C3 under the WTP line indicates cost effectiveness.1US$ ≈7.50 SEK and 1D ≈ 9.30 SEK.
developing dementia during the model period, many people without a risk of dementia will be exposed to the intervention. Even if there were positive effects because the intervention affects lifestyle choices, it would be of interest to make the intervention even more cost-effective. One option is to enrich the population at risk by focusing only on the highest risk score group as target for the intervention, similar to the risk scores for cardiovascular disease [36]. Another option is to focus the intervention mainly on older people (for example age of 70–80) with higher risk. However, the CAIDE Dementia Risk Score was formulated specifically for predictions based on midlife risk profiles, and such risk profiles may be different at older ages [37]. The results were insensitive to changes in the value of QALY for demented subjects, mortality and risk of getting dementia in the model. Particularly of interest is that the conservative approach of a modest risk score reduction (to 6–7) still indicated cost effectiveness of the intervention. However, if the program would run every year the cost of intervention would increase and result in a cost per gained QALY but still under the WTP level.
We assumed no mortality differences in the base option, due to the lack of support in literature. Neither did we simulate effects on progression or mortality of established dementia. Effects on mortality are complex. One hand, a decreased mortality as a consequence of an intervention in established dementia may actually increase costs, but on the other hand also result in positive outcomes (in terms of e.g., QALYs), still supporting cost effectiveness versus a societal WTP. However, if the effect is an increased survival that prolong the period in a severe state of dementia, the suffering will increase (less QALYs) and the program will probably not be cost-effective. In this model, the simulated cohort was rather young (50–70 years) and thus the mortality effects were rather small, which the different options in the sensitivity analysis showed. The use of QALYs is not uncontroversial, particularly regarding the elderly. One advantage with QALYs is that comparisons with other disorders are possible. On the other hand, this makes the figures abstract and it may be difficult to intuitively feel what a figure of, say 0.567 means in terms of functional capacity. Based
742
Y. Zhang et al. / Dementia Risk Reduction
on the five dimensions in EQ5D, 243 states can be described and transformed to QALYs with an algorithm, so for a deeper analysis it is possible to link QALYs to real world function capacity based on the underlying dimensions in EQ5D. However, QALYs may disfavor chronic, incurable, progressive disorders when these are compared with e.g., curative surgical treatment, such as cataract or hip replacement surgery. A model like this can only serve as a source for a discussion about potential effects, given a set of assumptions with their limitations and uncertainties. The robustness of a model and the uncertainties can partly be addressed in a sensitivity analysis. In real life, there would of course not be a homogeneous shift between the different risk scores on a population level. Some people may also get worse in the intervention group. The basic epidemiological assumption for the model, that the risk reductions can be directly transferred to an intervention effect, has so far no empirical support. Such effects must be confirmed in randomized controlled trials. The first multi-domain preventive intervention trial, Finnish Geriatric Intervention Study to Prevent Cognitive Impairment and Disability (FINGER), is currently ongoing in Finland [13, 14]. Furthermore, the transformation of a 20-year period result to annual figures may also be questioned. One option could be to make cost effectiveness estimates for one cycle of 20 years, but it would not reflect the dynamics of health promotion programs. The model is based on one core study from Finland. The risk score has been validated in a large multi-ethnic population in US [38] and thus, we have assumed that the risk score model is adoptable in Sweden as well. All costs and utilities were collected in Sweden from the societal perspective, which is realistic and applicable in a Swedish setting. The dropout rate was not considered in our analysis. It may be high in long-term health promotion programs. The cost of intervention program was derived from the health intervention program in Norsj¨o for the participants aged 30 to 60, while the participants in our model were assumed to be between 50 and 70 years old. A small increase in the cost would be expected. For people with no dementia, we used EQ5D data from Stockholm while the EQ5D figures for people with dementia were based on a Swedish sample (including persons from Stockholm). By doing so, there is a risk of imbalances in the QALY estimates, since the intervention is assumed to influence on the
proportions between people with and without dementia in the different arms. Ideally, it should have been the same source for the EQ5D figures but we think that the crucial thing is that the same QALY instrument is used. The model of our study has only one state of dementia because the underlying basic paper did not include data on dementia progression from mild to moderate and severe states. The prevention model was assumed as a multidomain intervention to control several risk factors simultaneously. It is not possible to determine which of the approaches (parts of the health promotion program and different drug treatments) are most effective in reducing dementia risk. Most persons who develop dementia pass the state of mild cognitive impairment (MCI), which would have been of value to include in the model. However, the core paper did not include the risk for developing MCI from normal cognition or the risk for convert to dementia from MCI, and thus it was not possible to include MCI in the model. While the base case analysis indicated absolute dominance for the program, given the base case assumptions (the program is cheaper and better, and thus no WTP discussion is needed), the probabilistic sensitivity analysis (where several assumptions were varied) showed a more complex pattern. Thus, the results must in light of that be interpreted with caution. However, the effects of the program are from another viewpoint probably underestimated since the model only focused on dementia. The intervention program may also include positive effects on the prevention of cardiovascular and cerebrovascular conditions such as ischemic heart disease or stroke. These effects are perhaps even stronger in terms of cost effectiveness, but were not included in the model. In conclusion, the multi-domain preventive intervention was less costly and had better dementia-related outcomes compared with “usual care”, supporting cost-effectiveness. This is a promising outlook for future research on preventive interventions in dementia, emphasizing the need of conducting multi-domain randomized trials.
ACKNOWLEDGMENTS Swedish Brain Power (SBP) provided unrestricted financial support in the work of this study. Authors’ disclosures available online (http://www.jalz.com/disclosures/view.php?id=879).
Y. Zhang et al. / Dementia Risk Reduction
REFERENCES [1] [2] [3]
[4]
[5]
[6]
[7] [8]
[9]
[10]
[11]
[12]
[13]
[14] [15]
[16]
[17]
WHO (2010) The European Health report 2009, Health and health systems. 2010. Wimo A, Prince M. World Alzheimer report 2010. The global economic impact of dementia. SBU (2008) Dementia. A systematic review. Stockholm. Statens beredning f¨or medicinsk utv¨ardering (SBU) (The Swedish Council on Technology Assessment in Health Care). Report No.: 172E/1-3. Brookmeyer R, Gray S, Kawas C (1998) Projections of Alzheimer’s disease in the United States and the public health impact of delaying disease onset. Am J Public Health 88, 1337-1342. Jorm AF, Dear KB, Burgess NM (2005) Projections of future numbers of dementia cases in Australia with and without prevention. Aust N Z J Psychiatry 39, 959-963. Kivipelto M, Ngandu T, Laatikainen T, Winblad B, Soininen H, Tuomilehto J (2006) Risk score for the prediction of dementia risk in 20 years among middle aged people: a longitudinal, population-based study. Lancet Neurol 5, 735-741. Skoog I (2000) Vascular aspects in Alzheimer’s disease. J Neural Transm Suppl 59, 37-43. Aguero-Torres H, Kivipelto M, von Strauss E (2006) Rethinking the dementia diagnoses in a population-based study: what is Alzheimer’s disease and what is vascular dementia? A study from the Kungsholmen project. Dement Geriatr Cogn Disord 22, 244-249. Wheeler MT, Heidenreich PA, Froelicher VF, Hlatky MA, Ashley EA (2010) Cost-effectiveness of preparticipation screening for prevention of sudden cardiac death in young athletes. Ann Intern Med 152, 276-286. Bellomo A, Mancinella M, Troisi G, Marigliano V (2009) Relationship between atrial fibrillation and other cardiovascular risk factors in Alzheimer’s disease. New prevention opportunities. Recenti Prog Med 100, 124-126. Jacobs-van der Bruggen MA, van Baal PH, Hoogenveen RT, Feenstra TL, Briggs AH, Lawson K, Feskens EJ, Baan CA (2009) Cost-effectiveness of lifestyle modification in diabetic patients. Diabetes Care 32, 1453-1458. National Institutes of Health. NIH State-of-the-Science Conference Statement on Preventing Alzheimer’s disease and Cognitive Decline [database on the Internet]. National institutes of health (NIH), 2010. Available from: http://consensus. nih.gov/2010/docs/alz/ALZ Final Statement.pdf. Ahtiluoto S, Ngandu T, Rauramaa R, Soininen H, Laatikainen T, Sulkava R, Strandberg T, Tuomilehto J, Kivipelto M (2010) Finnish Geriatric Intervention Study to Prevent Cognitive Impairment and Disability (FINGER) (abstract). 10th International Conference of Alzheimer’s Disease (ICAD); 2010; Honolulu, USA 2010. FINGER. (in Finnish) 2010 [updated 2010]; Available from: http://www.thl.fi/fi FI/web/fi/tutkimus/hankkeet/finger. Buxton MJ, Drummond MF, Van Hout BA, Prince RL, Sheldon TA, Szucs T, Vray M (1997) Modelling in economic evaluation: an unavoidable fact of life. Health Econ 6, 217-227. Gustavsson A, Jonsson L, Fillit H, Johansson G, Wimo A, Winblad B (2010) IPECAD5-Fifth International PharmacoEconomic Conference on Alzheimer’s Disease. J Nutr Health Aging 14, 358-360. Wimo A, Winblad B (2004) Economic aspects on drug therapy of dementia. Curr Pharm Design 10, 295-301.
[18]
[19]
[20]
[21]
[22]
[23]
[24]
[25]
[26]
[27]
[28]
[29]
[30]
[31]
743
Zhang YL (2010) Potential cost-effectiveness of a health intervention program with risk reductions for being demented. Department of Public Health Sciences, Karolinska Intstitutet, Stockholm, Sweden. Fratiglioni L, Launer LJ, Andersen K, Breteler MM, Copeland JR, Dartigues JF, Lobo A, Martinez-Lage J, Soininen H, Hofman A (2000) Incidence of dementia and major subtypes in Europe: A collaborative study of population-based cohorts. Neurologic Diseases in the Elderly Research Group. Neurology 54(11 Suppl 5), S10-S15. Ferri CP, Prince M, Brayne C, Brodaty H, Fratiglioni L, Ganguli M, Hall K, Hasegawa K, Hendrie H, Huang Y, Jorm A, Mathers C, Menezes PR, Rimmer E, Scazufca M (2005) Alzheimer’s disease international. Global prevalence of dementia: a Delphi consensus study. Lancet 366, 21122217. Hofman A, Rocca WA, Brayne C, Breteler MM, Clarke M, Cooper B, Copeland JR, Dartigues JF, da Silva Droux A, Hagnell O, et al. (1991) The prevalence of dementia in Europe: a collaborative study of 1980-1990 findings. Eurodem Prevalence Research Group. Int J Epidemiol. 20, 736748. Jorm AF, Korten AE, Henderson AS (1987) The prevalence of dementia: a quantitative integration of the literature. Acta Psychiatr Scand 76, 465-479. Deaths by region, age (the year of birth) and sex [database on the Internet]. Statistiska Centralbyran SCB (statistics Sweden). 2010 [Accessed 2010-03-14]. Available from: http://www.ssd.scb.se. Aguero-Torres H, Fratiglioni L, Guo Z, Viitanen M, Winblad B (1999) Mortality from dementia in advanced age: a 5-year follow-up study of incident dementia cases. J Clin Epidemiol 52, 737-743. Wimo A, Johansson L, Joumlnsson L. Demenssjukdomarnas samh¨allskostnader och antalet dementa i Sverige 2005 (The societal costs of dementia and the number of demented in Sweden 2005) (in Swedish). Stockholm: Socialstyrelsen; 2007. Report No.: 2007-123-32. Wimo A, Johansson L, Jonsson L (2009) [Prevalence study of societal costs for dementia 2000-2005. More demented people-but somewhat reduced costs per person] (abstract in English). Lakartidningen 106, 1277-1282. Lindholm L, Rosen M, Weinehall L, Asplund K (1996) Cost effectiveness and equity of a community based cardiovascular disease prevention programme in Norsjo, Sweden. J Epidemiol Community Health 50, 190-195. Richard JL (1988) [The MONICA project. A WHO research project in cardiovascular diseases]. Rev Epidemiol Sante Publique 36, 325-334. SBU. M˚attligt f¨orh¨ojt blodtryck, volym 1 (2004) En systematisk litteratur¨oversikt (Moderate increased blood pressure. Volyme 1. A systematic literature review) (in Swedish). Statens beredning f¨or medicinsk utv¨ardering (SBU) (The Swedish Council on Technology Assessment in Health Care), Stockholm. L¨akemedelsverket (2009) (Swedish Medical Products Agency). L¨akemedelsboken 2009-2010 (in Swedish). Stockholm. Centrum F¨or Folkh¨alsa (2009) Diabetes i Stockholms l¨an: f¨orekomst och tidstrender (Diabetes in the county council of Stockholm: occurrence and time trends) (in Swedish). Stockholm: Epidemiologiska enheten, Centrum f¨or, Folkh¨alsa, Stockholms l¨ans landsting och Diabetespreventiva enheten, Karolinska Universitetsjukuset.
744 [32]
[33]
[34]
[35]
[36]
Y. Zhang et al. / Dementia Risk Reduction Burstrom K, Johannesson M, Diderichsen F (2001) Swedish population health-related quality of life results using the EQ5D. Qual Life Res 10, 621-635. Mesterton J, Wimo A, By A, Langworth S, Winblad B, Jonsson L (2010) Cross sectional observational study on the societal costs of Alzheimer’s disease. Curr Alzheimer Res 7, 358-367. Briggs AH, Gray AM (1999) Handling uncertainty in economic evaluations of healthcare interventions. BMJ 319, 635-638. TLV (2009) (The Dental and Pharmaceutical Benefits Agency). Till¨agg till uppdrag ang˚aende f¨orberedande a˚ tg¨arder med anledning av omregleringen av apoteksmarknaden (Addition to comission regarding preparatory actions because of the reregulation of the pharmaceutical market) (in Swedish). Stockholm. Conroy RM, Py¨or¨al¨a K, Fitzgerald AP, Sans S, Menotti A, De Backer G, De Bacquer D, Ducimeti`ere P, Jousilahti P, Keil U, Njølstad I, Oganov RG, Thomsen T, Tunstall-Pedoe H, Tverdal A, Wedel H, Whincup P, Wilhelmsen L, Graham IM (2003). SCORE project group. Estimation of ten-year risk of fatal cardiovascular disease in Europe: the SCORE project. Eur Heart J 24, 987-1003.
[37]
[38]
[39]
[40]
[41]
Barnes DE, Covinsky KE, Whitmer RA, Kuller LH, Lopez OL, Yaffe K (2009) Predicting risk of dementia in older adults: The late-life dementia risk index. Neurology 73, 173-179. Whitmer R, Barnes D, Kivipelto M, Ngandu T, Yaffe K, editors (2007) Validation and development of the midlife dementia risk score in the Kaiser Permanente Population (abstract). Gerontological Society of America Annual Scientific Meeting. San Francisco. Nordberg G, Wimo A, J¨onsson L, K˚areholt I, Sj¨olund BM, Lagergren M, von Strauss E (2007) Time use and costs of institutionalised elderly persons with or without dementia: results from the Nordanstig cohort in the Kungsholmen project-a population based study in Sweden. Int J Geriatric Psychiatry 22, 639-648. Wimo A, Johansson L, LJ (2009) [Prevalence study of societal costs for dementia 2000-2005. More demented people–but somewhat reduced costs per person (in Swedish)]. Lakartidningen 106, 1277-1282. Siegel JE, Torrance GW, Russell LB, Luce BR, Weinstein MC, Gold MR (1997) Guidelines for pharmacoeconomic studies. Recommendations from the panel on cost effectiveness in health and medicine. Panel on Cost Effectiveness in Health and Medicine. Pharmacoeconomics. 11, 159-168.