Hindawi Publishing Corporation Mathematical Problems in Engineering Volume 2015, Article ID 232184, 8 pages http://dx.doi.org/10.1155/2015/232184
Research Article Cost-Sensitive Estimation of ARMA Models for Financial Asset Return Data Minyoung Kim Department of Electronics & IT Media Engineering, Seoul National University of Science & Technology, Seoul 139-743, Republic of Korea Correspondence should be addressed to Minyoung Kim;
[email protected] Received 11 June 2015; Revised 30 August 2015; Accepted 2 September 2015 Academic Editor: Meng Du Copyright © 2015 Minyoung Kim. This is an open access article distributed under the Creative Commons Attribution License, which permits unrestricted use, distribution, and reproduction in any medium, provided the original work is properly cited. The autoregressive moving average (ARMA) model is a simple but powerful model in financial engineering to represent timeseries with long-range statistical dependency. However, the traditional maximum likelihood (ML) estimator aims to minimize a loss function that is inherently symmetric due to Gaussianity. The consequence is that when the data of interest are asset returns, and the main goal is to maximize profit by accurate forecasting, the ML objective may be less appropriate potentially leading to a suboptimal solution. Rather, it is more reasonable to adopt an asymmetric loss where the model’s prediction, as long as it is in the same direction as the true return, is penalized less than the prediction in the opposite direction. We propose a quite sensible asymmetric cost-sensitive loss function and incorporate it into the ARMA model estimation. On the online portfolio selection problem with real stock return data, we demonstrate that the investment strategy based on predictions by the proposed estimator can be significantly more profitable than the traditional ML estimator.
1. Introduction In modeling time-series data, capturing the underlying statistical dependency of the variables of interest at current time on the historic data is central to accurate forecasting and faithful data representation. For financial time-series data especially (e.g., daily asset prices or returns) where a large amount of potential prognostic indicators is available, the development/analysis of sensible dynamic models as well as effective parameter estimation algorithms has been investigated significantly. To account for statistical properties specific to financial sequences, several sophisticated dynamic time-series models have been developed: fairly natural autoregressive and/or moving average models [1], the conditional heteroscedastic models that represent dynamics of volatilities (variances) of the asset returns [2–4], and nonlinear models [5, 6] including bilinear models [7], threshold models [8], and regime switching models [9, 10]. Among those, the autoregressive moving average (ARMA) model [1] is the simplest while essential in the sense that most other models are equipped with at least the basic
ARMA components. The ARMA models appear in a wide spectrum of applications recently including filter design in signal processing [11], time-series analysis and model selection in computational statistics [12], and jump (large changes) modeling for asset prices in quantitative finance [13], to name just a few. For a time-series y = 𝑦1 , . . . , 𝑦𝑇 (e.g., 𝑦𝑡 is the asset return at the 𝑡th day), the ARMA(𝑝, 𝑞) determines 𝑦𝑡 by 𝑡−1 𝑡−1 𝑦𝑡 = 𝛼⊤ 𝑦𝑡−𝑝 + 𝛽⊤ 𝑒𝑡−𝑞 + 𝛽0 𝑒𝑡 + 𝜌,
(1)
where 𝑥𝑎𝑏 indicates the vector [𝑥𝑎 , 𝑥𝑎+1 , . . . , 𝑥𝑏 ]⊤ . Here 𝑒𝑡 ∼ N(0, 𝛾2 ) is the stochastic Gaussian error term at time 𝑡 where we assume iid across 𝑡’s. In (1) 𝛼, 𝛽, 𝛽0 , and 𝜌 are the model parameters. That is, 𝑦𝑡 is dependent on 𝑝 previous asset returns, 𝑞 historic errors, and the current error 𝑒𝑡 . In this paper we consider a more general, recent stochastic extension of ARMA (abbreviated as sARMA) [14] (in contrast to the deterministic equation (1)) that adds a Gaussian noise to (1). Moreover, the extra covariates 𝑐𝑡 (called cross predictors) are assumed available at time 𝑡; for instance, they are typically economic indicators, market indices, and/or the previous
2
Mathematical Problems in Engineering
returns of other related assets. The sARMA(𝑝, 𝑞) model can be specifically written as 𝑡−1 𝑡 𝑦𝑡 | 𝑦𝑡−𝑝 , 𝑒𝑡−𝑞 , 𝑐𝑡 ∼ N (𝑢𝑡 , 𝜎2 ) ,
(2)
𝑡−1 𝑡−1 𝑢𝑡 = 𝛼⊤ 𝑦𝑡−𝑝 + 𝛽⊤ 𝑒𝑡−𝑞 + 𝛽0 𝑒𝑡 + 𝜂⊤ 𝑐𝑡 + 𝜌.
(3)
where
Here 𝜂 is the weight vector (model parameters) for the cross predictor. Hence, sARMA deals with Gaussian noisy observation (with variance 𝜎2 ), and it exactly reduces to the ARMA model in the limiting case 𝜎 → 0. The noisy observation modeling of sARMA is beneficial in several aspects: not only does it merely account for the underlying noise process in the observation but also the model becomes fully stochastic, which allows principled probabilistic inference and model estimation even with missing data [14]. Given the observed sequence data, the parameters 𝜃 = {𝛾2 , 𝛼, 𝛽, 𝛽0 , 𝜂, 𝜌, 𝜎2 } of the sARMA model can be estimated by the expectation maximization (EM) algorithm [15]. Compared to the traditional Levenberg-Marquardt method for ARMA model estimation [1], the EM algorithm is beneficial for dealing with latent variables (i.e., the error terms) as well as any missing observations in an efficient and principled way. However, both estimators basically aim to achieve data likelihood maximization (ML) under the Gaussian model (2) [14] (with 𝜎 → 0 corresponding to ARMA). Due to the Gaussian observation modeling in sARMA, the ML estimation inherently aims to minimize a symmetric loss. In other words, letting 𝑦̂𝑡 and 𝑦𝑡 be the model forecast and the true value at time 𝑡, respectively, incorrect prediction 𝑦̂𝑡 with the prediction error 𝜉 = |𝑦̂𝑡 − 𝑦𝑡 | incurs the same amount of loss for both 𝑦̂𝑡 = 𝑦𝑡 + 𝜉 and 𝑦̂𝑡 = 𝑦𝑡 − 𝜉 (i.e., regardless of over- or underestimation). This strategy is far from being optimal especially for the asset return data as argued in the following. The main goal is to maximize profit by accurate forecasting with the asset return data that encode signs (directions) toward profits. Traditional maximum likelihood (ML) estimator aims to minimize a loss function that is inherently symmetric and hence unable to exploit the property of the asset return data, leading to a suboptimal solution. Suppose that our data y forms a sequence of daily stock log-returns, encoded as 𝑦𝑡 > 0 ( 0) because the former does not incur any loss in revenue but the latter does. To address this issue, we propose a reasonable cost function that effectively captures the above idea of the intrinsic asymmetric profit/loss structure regarding asset return
data. Our cost function effectively encodes the goodness of matching in directions between true and model predicted asset returns, which is directly related to ultimate profits in the investment. We also provide an efficient optimization strategy based on the subgradient descent using the trustregion approximation, whose effectiveness is empirically demonstrated for the portfolio selection problem with realworld stock return data. It is worth mentioning that there have been several other asymmetric loss functions proposed in the literature similar to ours. However, existing loss models merely focus on the asymmetry with respect to the ground-truth value point. For instance, the linex function [16, 17] is defined to be linear-exponential function of difference between predicted and ground-truth values. The linlin method [18] adopts a piecewise linear function where the change point is simply the ground-truth value. To the best of our knowledge, we are the first to derive the loss based on the matching the directions (signs) of the predicted and ground-truth returns. This effectively enables incorporating the critical information about directions of profits/losses, in turn leading to a more accurate forecasting model. The rest of the paper is organized as follows. In the next section we suggest a novel sARMA estimation algorithm based on the cost-sensitive loss function: beginning with the overall objective, we derive the one-step predictor for the sARMA model in Section 2.1, provide details of the proposed cost function in Section 2.2, and state the optimization strategy in Section 2.3. The statistical inference algorithm for the sARMA model is also provided in full derivations in Section 2.4. In the empirical study in Section 3, we demonstrate the effectiveness of the proposed algorithm on the online portfolio selection problem with real data, where the significantly higher total profit is attained by the proposed approach than the investment based on the traditional MLestimated sARMA model.
2. Cost-Sensitive Estimation The proposed estimator for sARMA is based on the costsensitive loss of the model predicted one-step forecast value (denoted by 𝑦̂𝑡 ) at each time 𝑡 with respect to the true one (denoted by 𝑦𝑡 ) available from data. More specifically, for a given data sequence y = 𝑦1 , . . . , 𝑦𝑇 , we aim to solve the optimization problem: 𝑇
min ∑ 𝐶 (𝑦̂𝑡 (𝜃) , 𝑦𝑡 ) + 𝜆𝑁 (𝜃) , 𝜃
𝑡=𝑅+1
(4)
where 𝑅 = max (𝑝, 𝑞) . Here 𝐶(𝑦̂𝑡 , 𝑦𝑡 ) is the cost of predicting the asset return as 𝑦̂𝑡 when the true value is 𝑦𝑡 . In Section 2.2 we define a reasonable cost function that faithfully incorporates the idea of asymmetric cost-sensitive loss discussed in the introduction. In the objective, we also simultaneously minimize 𝑁(𝜃), the parameter regularizer that typically penalizes a nonsmooth sARMA model while preferring a smooth model (effectively achieved by encouraging the regression
Mathematical Problems in Engineering
3
parameters in 𝜃 close to 0) model. Specifically we use the L2 penalty, 𝑁(𝜃) = ‖𝛼‖2 + ‖𝛽‖2 + 𝛽02 + ‖𝜂‖2 . The constant 𝜆 (>0) trades off the regularization against the prediction error cost. Note also that in (4) we use the notation 𝑦̂𝑡 (𝜃) to emphasize the dependency of the model predicted 𝑦̂𝑡 on 𝜃. We use the principled maximum a posteriori (MAP) predictor estimated under the sARMA model, which is fully described in Section 2.1. The predictor is evaluated based on the inference on the latent error terms, which can be computed recursively where we give detailed derivations for the inference in Section 2.4.
𝑡 are partitioned into (𝑅 + 1 < 𝑡 ≤ 𝑅 + 𝑞 + 1), the terms 𝑒𝑡−𝑞 𝑡−1 𝑅 (𝑒𝑡 , 𝑒𝑅+1 , 𝑒𝑡−𝑞 = 0), and we have 𝑡 𝑃 (𝑦𝑡 | 𝑦1𝑡−1 , 𝑒1𝑅 , 𝑐1𝑡 ) = ∑ 𝑃 (𝑦𝑡 , 𝑒𝑅+1 | 𝑦1𝑡−1 , 𝑒1𝑅 , 𝑐1𝑡 )
(8)
𝑡−1 𝑡 𝑡 = ∑ 𝑃 (𝑦𝑡 | 𝑦𝑡−𝑝 , 𝑒𝑡−𝑞 , 𝑐𝑡 ) ⋅ 𝑃 (𝑒𝑅+1 | 𝑦1𝑡−1 , 𝑒1𝑅 , 𝑐1𝑡 )
(9)
𝑡 𝑒𝑅+1
𝑡 𝑒𝑅+1
𝑡−1 + 𝛽0 𝑒𝑡 , 𝜎2 ) ⋅ 𝑃 (𝑒𝑡 ) = ∑ N (𝑦𝑡 ; 𝑏𝑡 + 𝛽⊤ 𝑒𝑡−𝑞 𝑡 𝑒𝑅+1
⋅
2.1. One-Step Predictor for sARMA. Under the sARMA model, the predictive model at time 𝑡, given all available information (𝑦1𝑡−1 , 𝑒1𝑅 , 𝑐1𝑡 ), is 𝑃(𝑦𝑡 | 𝑦1𝑡−1 , 𝑒1𝑅 , 𝑐1𝑡 ) for 𝑡 = 𝑅 + 1, 𝑅 + 2, . . .. From this predictive model, one can make deterministic decision on the asset return at 𝑡, typically as the maximum-a-posteriori (MAP) estimation: 𝑦̂𝑡 = arg max 𝑃 (𝑦𝑡 | 𝑦1𝑡−1 , 𝑒1𝑅 , 𝑐1𝑡 ) .
Note that in the sARMA model, it is always assumed that we have at least 𝑅 previous observations 𝑦1𝑅 and 𝑅 previous error terms 𝑒1𝑅 . The error terms are simply assumed to be 𝑒1 = ⋅ ⋅ ⋅ = 𝑒𝑅 = 0 throughout the paper. Due to the linear Gaussianity of the sARMA’s local conditional densities, we have Gaussian 𝑃(𝑦𝑡 | 𝑦1𝑡−1 , 𝑒1𝑅 , 𝑐1𝑡 ), and the MAP predictor (5) exactly coincides with the mean E[𝑦𝑡 | 𝑦1𝑡−1 , 𝑒1𝑅 , 𝑐1𝑡 ]. In this section we derive the MAP (or mean) prediction 𝑦̂𝑡 as a function of the sARMA model parameters 𝜃, which can then be used in gradient evaluation for the optimization in (4). As is shown, the predictive distributions heavily resort to 𝑡 | the posterior distributions of the error terms, namely, 𝑃(𝑒𝑅+1 𝑡 𝑅 𝑡 𝑦1 , 𝑒1 , 𝑐1 ) for 𝑡 = 𝑅 + 1, . . . , 𝑇. They are also Gaussians, and we denote them by (𝜇𝑡 , Σ𝑡 ) in 𝑡 | 𝑦1𝑡 , 𝑒1𝑅 , 𝑐1𝑡 ) = N (𝜇𝑡 , Σ𝑡 ) , 𝑃 (𝑒𝑅+1
(6)
for 𝑡 = 𝑅 + 1, . . . , 𝑇. Note that 𝜇𝑡 and Σ𝑡 have dimensions ((𝑡 − 𝑅) × 1) and ((𝑡 − 𝑅) × (𝑡 − 𝑅)), respectively. The full derivation of the error term posteriors is provided in Section 2.4. In deriving 𝑃(𝑦𝑡 | 𝑦1𝑡−1 , 𝑒1𝑅 , 𝑐1𝑡 ), one may need to differentiate three cases for 𝑡: (i) 𝑡 = 𝑅 + 1, (ii) 𝑅 + 1 < 𝑡 ≤ 𝑅 + 𝑞 + 1, and (iii) 𝑡 > 𝑅 + 𝑞 + 1. The first case simply forms the initial condition which immediately follows from the local conditional model with marginalization of 𝑒𝑅+1 . That is, when 𝑡 = 𝑅 + 1, 𝑃 (𝑦𝑅+1 |
𝑦1𝑅 , 𝑒1𝑅 , 𝑐1𝑅+1 )
=
N (𝑏𝑅+1 , 𝛽02 𝛾2
𝑡−1 2 2 , 𝛽0 𝛾 + 𝜎2 ) = ∑ N (𝑦𝑡 ; 𝑏𝑡 + 𝛽⊤ 𝑒𝑡−𝑞 𝑡 𝑒𝑅+1
⋅
2
+ 𝜎 ),
(7)
𝑡−1 where we define 𝑏𝑡 = 𝛼⊤ 𝑦𝑡−𝑝 + 𝜂⊤ 𝑐𝑡 + 𝜌 for 𝑡 = 𝑅 + 1, . . . , 𝑇. We distinguish the second and third cases for the following reason: at time 𝑡, the previous 𝑞 error terms are fully included in the time window [𝑅 + 1, 𝑡] in the latter case, while they are partially included in the former. Hence in the 𝑅 second case, we additionally deal with the error terms 𝑒𝑡−𝑞 which are always given as 0. Specifically, in the second case
(11)
𝑡−1 ; 𝜇𝑡−1 , Σ𝑡−1 ) N (𝑒𝑅+1
= N (𝑦𝑡 ; 𝑏𝑡 + 𝛽2⊤ 𝜇𝑡−1 , 𝛽2⊤ Σ𝑡−1 𝛽2 + 𝛽02 𝛾2 + 𝜎2 ) .
(5)
𝑦𝑡
(10)
𝑡−1 ; 𝜇𝑡−1 , Σ𝑡−1 ) N (𝑒𝑅+1
(12)
𝑡−1 In (12), we let 𝛽2 be the subvector of 𝛽 corresponding to 𝑒𝑅+1 . In the third case (𝑡 > 𝑅 + 𝑞 + 1), we only need to deal 𝑡 , and the predictive density is derived as with error terms 𝑒𝑡−𝑞 follows: 𝑡−1 𝑡 𝑃 (𝑦𝑡 | 𝑦1𝑡−1 , 𝑒1𝑅 , 𝑐1𝑡 ) = ∑ 𝑃 (𝑦𝑡 | 𝑦𝑡−𝑝 , 𝑒𝑡−𝑞 , 𝑐𝑡 ) ⋅ 𝑃 (𝑒𝑡 ) 𝑡 𝑒𝑡−𝑞
⋅
𝑡−1 𝑃 (𝑒𝑡−𝑞
|
(13)
𝑦1𝑡−1 , 𝑒1𝑅 , 𝑐1𝑡−1 )
𝑡−1 ̃ 𝑡−1 ) = ∑ N (𝑒𝑡−𝑞 ; 𝜇̃𝑡−1 , Σ 𝑡 𝑒𝑡−𝑞
⋅ N (𝑦𝑡 ; 𝑏𝑡 +
(14) 𝑡−1 2 2 𝛽⊤ 𝑒𝑡−𝑞 , 𝛽0 𝛾
2
+𝜎 )
̃ 𝑡−1 𝛽 + 𝛽2 𝛾2 + 𝜎2 ) . = N (𝑦𝑡 ; 𝑏𝑡 + 𝛽⊤ 𝜇̃𝑡−1 , 𝛽⊤ Σ 0
(15)
̃ 𝑡−1 as submatrices of 𝜇𝑡−1 and In (14), we introduce 𝜇̃𝑡−1 and Σ Σ𝑡−1 taking the indices from (𝑡 − 𝑞) to (𝑡 − 1) only. In summary, the one-step predictor 𝑦̂𝑡 (𝜃) at 𝑡 with all available information (𝑦1𝑡−1 , 𝑒1𝑅 , 𝑐1𝑡 ) can be written as 𝑦̂𝑡 (𝜃) 𝑡−1 + 𝜂⊤ 𝑐𝑡 + 𝜌 𝛼⊤ 𝑦𝑡−𝑝 { { { { 𝑡−1 + 𝜂⊤ 𝑐𝑡 + 𝜌 + 𝛽2⊤ 𝜇𝑡−1 = {𝛼⊤ 𝑦𝑡−𝑝 { { ⊤ 𝑡−1 { ⊤ ⊤ {𝛼 𝑦𝑡−𝑝 + 𝜂 𝑐𝑡 + 𝜌 + 𝛽 𝜇̃𝑡−1
if 𝑡 = 𝑅 + 1 if 𝑅 + 1 < 𝑡 ≤ 𝑅 + 𝑞 + 1
(16)
if 𝑡 > 𝑅 + 𝑞 + 1.
Note here that the means of the error term posteriors 𝜇𝑡−1 (and their subvectors 𝜇̃𝑡−1 ) have also dependency on the model parameters 𝜃. 2.2. Proposed Cost Function. In this section we propose a cost function 𝐶(𝑦̂𝑡 , 𝑦𝑡 ) (used in (4)) that effectively encodes the intrinsic asymmetric profit/loss structure regarding asset return data. To meet the motivating idea discussed in Section 1, we deal with two outstanding cases: the case when
4
Mathematical Problems in Engineering
the true 𝑦𝑡 is positive and the case when 𝑦𝑡 is negative. In each case, we further consider a certain margin 𝜖 (small positive, e.g., 𝜖 = 0.005), where observing 𝑦𝑡 > 𝜖 indicates positive return with high certainty; on the other hand, having 0 ≤ 𝑦𝑡 ≤ 𝜖 can be regarded differently as weak positivity and might be considered as noise. For the negative return, we have similar two regimes of different certainty levels. We discuss the first case, 𝑦𝑡 > 𝜖. Depending on the value of 𝑦̂𝑡 , the cost functional changes over the four intervals: (i) 𝑦̂𝑡 < 0 incurs the highest loss with a super-linear penalty along the magnitude of 𝑦̂𝑡 (we particularly choose a convex quadratic function), (ii) 𝑦̂𝑡 ≥ 𝑦𝑡 , that is, overestimation, should be penalized the least, and we opt for an increasing linear function with a small slope, (iii) 𝜖 ≤ 𝑦̂𝑡 < 𝑦𝑡 is an underestimation, but the prediction has certainty greater than a margin and thus is penalized less (we choose a linear function with slope slightly higher than the second case), and (iv) 0 ≤ 𝑦̂𝑡 < 𝜖 makes prediction in correct direction, but due to the weak certainty below the margin, we penalize it more severely than previous two regimes. Our specific cost definition for 𝑦𝑡 > 𝜖 is as follows: 1 2 𝑠 𝑦̂ − 𝑠0 𝑦̂𝑡 + 𝑔1 { { { 2 𝑎 𝑡 { { { {−𝑠0 (𝑦̂𝑡 − 𝜖) + 𝑔0 𝐶 (𝑦̂𝑡 , 𝑦𝑡 ) = { { { −𝑠in (𝑦̂𝑡 − 𝑦𝑡 ) { { { { {𝑠out (𝑦̂𝑡 − 𝑦𝑡 )
if 𝑦̂𝑡 < 0 if 0 ≤ 𝑦̂𝑡 < 𝜖 if 𝜖 ≤ 𝑦̂𝑡 < 𝑦𝑡
(17)
if 𝑦̂𝑡 ≥ 𝑦𝑡
where we choose the constants as follows: 𝑠𝑎 = 4, 𝑠0 = 2, 𝑠in = 0.5, 𝑠out = 0.3. To make the cost function continuous, we define two offsets as follows: 𝑔0 = −𝑠in (𝜖 − 𝑦𝑡 ) and 𝑔1 = 𝑔0 + 𝜖𝑠0 . In the case of 𝑦𝑡 < −𝜖, we exactly penalize the prediction in the same way as the first situation. Specifically, the cost definition for 𝑦𝑡 < −𝜖 is if 𝑦̂𝑡 > 0 if − 𝜖 < 𝑦̂𝑡 ≤ 0 if 𝑦𝑡 < 𝑦̂𝑡 ≤ −𝜖
1 2 𝑠𝑎 𝑦̂𝑡 − 𝑠0 𝑦̂𝑡 + 𝑘1 { { { {2 𝐶 (𝑦̂𝑡 , 𝑦𝑡 ) = {−𝑠0 (𝑦̂𝑡 − 𝑦𝑡 ) { { { {𝑠out (𝑦̂𝑡 − 𝑦𝑡 )
if 𝑦̂𝑡 < 0 if 0 ≤ 𝑦̂𝑡 < 𝑦𝑡 if 𝑦̂𝑡 ≥ 𝑦𝑡
(18)
if 𝑦̂𝑡 ≤ 𝑦𝑡 (when 𝑦𝑡 < −𝜖) ,
where the same constants are used, and the offsets are now set as ℎ0 = −𝑠in (𝜖 + 𝑦𝑡 ) and ℎ1 = ℎ0 + 𝜖𝑠0 . For the uncertain (within the margin 𝜖) return, we still conform to the strategy of encouraging the same direction as the true return. In the case of 0 < 𝑦𝑡 ≤ 𝜖, we assign small penalty for overestimation as long as it is in the correct direction, while rapidly growing quadratic loss for the
(19)
(when 0 < 𝑦𝑡 ≤ 𝜖) ,
where we set (for continuity) 𝑘1 = 𝑠0 𝑦𝑡 . The other case of −𝜖 ≤ 𝑦𝑡 < 0 is similarly defined as 1 2 𝑠𝑎 𝑦̂𝑡 + 𝑠0 𝑦̂𝑡 + 𝑙1 { { { {2 𝐶 (𝑦̂𝑡 , 𝑦𝑡 ) = {𝑠0 (𝑦̂𝑡 − 𝑦𝑡 ) { { { {−𝑠out (𝑦̂𝑡 − 𝑦𝑡 )
if 𝑦̂𝑡 > 0 if 𝑦𝑡 < 𝑦̂𝑡 ≤ 0 if 𝑦̂𝑡 ≤ 𝑦𝑡
(20)
(when − 𝜖 ≤ 𝑦𝑡 < 0) ,
where 𝑙1 = −𝑠0 𝑦𝑡 for continuity of the cost function. Finally when 𝑦𝑡 = 0, we can have a symmetric loss; for instance, 𝐶(𝑦̂𝑡 , 𝑦𝑡 = 0) = 𝑠0 |𝑦̂𝑡 |. 2.3. Optimization Strategy. In this section we briefly describe the optimization strategy for (4). We basically follow the subgradient descent [19, 20] where the derivative of the cost function with respect to 𝜃 can be derived as 𝜕𝐶 (𝑦̂𝑡 , 𝑦𝑡 ) 𝜕𝑦̂𝑡 𝜕𝐶 (𝑦̂𝑡 , 𝑦𝑡 ) . = ⋅ 𝜕𝜃 𝜕𝜃 𝜕𝑦̂𝑡
(when 𝑦𝑡 > 𝜖) ,
1 2 𝑠 𝑦̂ + 𝑠0 𝑦̂𝑡 + ℎ1 { { { 2 𝑎 𝑡 { { { {𝑠0 (𝑦̂𝑡 + 𝜖) + ℎ0 𝐶 (𝑦̂𝑡 , 𝑦𝑡 ) = { { { 𝑠in (𝑦̂𝑡 − 𝑦𝑡 ) { { { { {−𝑠out (𝑦̂𝑡 − 𝑦𝑡 )
prediction toward opposite direction. To summarize, the cost for 0 < 𝑦𝑡 ≤ 𝜖 is
(21)
Here, due to the nondifferentiability of the cost function (albeit continuous), we use the subgradient in place of the second part of RHS of (21). Evaluating the first part, that is, the gradient of 𝑦̂𝑡 with respect to 𝜃, requires further endeavor. According to the functional form of 𝑦̂𝑡 in (16), it has complex recursive dependency on 𝜃 mainly due to the error posterior means 𝜇𝑡−1 . Instead of exactly computing the derivative of 𝜇𝑡−1 , we address this issue by evaluating an approximate gradient by treating 𝜇𝑡−1 as a constant (constant evaluated at the current iterate 𝜃). In consequence, we have a linear function of 𝜃, and the gradient can be computed easily. However, the approximation (i.e., constant 𝜇𝑡−1 with respect to 𝜃) is only valid in the vicinity of the current 𝜃. Hence, to reduce the approximation error, we restrict the search space to be not much different from the current iterate (i.e., we search the next 𝜃 within the small-radius ball centered at the current 𝜃, specifically ‖𝜃 − 𝜃curr ‖ ≤ 𝜅 for some small 𝜅 > 0). Our optimization strategy is closely related to the trust-region method [21], where the objective is approximated in the vicinity of the current parameters. 2.4. Inference in sARMA. In this section we give full deriva𝑡 tions for statistical inference on the latent error variables 𝑒𝑅+1 𝑡 for each 𝑡, conditioned on the historic observations 𝑦1 and the cross predictors 𝑐1𝑡 in the sARMA model. That is, the posterior
Mathematical Problems in Engineering
5
𝑡 densities 𝑃(𝑒𝑅+1 | 𝑦1𝑡 , 𝑒1𝑅 , 𝑐1𝑡 ) for 𝑡 = 𝑅 + 1, . . . , 𝑇 are fully derived. In essence, these are all Gaussians, and as denoted in (6), we find the recursive formulas for the means and covariances (𝜇𝑡 , Σ𝑡 ). We also denote the inverse covariance Σ−1 𝑡 by 𝑆𝑡 . Similarly as one-step predictive distributions, we consider three cases: (i) initial 𝑡 = 𝑅 + 1, (ii) 𝑅 + 1 < 𝑡 ≤ 𝑅 + 𝑞 + 1 where 𝑡 𝑡 fully contains what we need to infer, that is, 𝑒𝑅+1 , and (iii) 𝑒𝑡−𝑞 𝑡 > 𝑅 + 𝑞 + 1 where we have to infer three groups of variables 𝑡−𝑞−1 𝑡−1 , 𝑒𝑡 ). The initial case (𝑡 = 𝑅+1) is straightforwardly (𝑒𝑅+1 , 𝑒𝑡−𝑞 derived as follows:
𝑃 (𝑒𝑅+1 | 𝑦1𝑅+1 , 𝑒1𝑅 , 𝑐1𝑅+1 ) 𝑅 𝑅+1 , 𝑒𝑅+1−𝑞 , 𝑐𝑅+1 ) ∝ 𝑃 (𝑦𝑅+1 | 𝑦𝑅+1−𝑝
2 1 1 𝛽 ∝ exp (− ( 2 + 02 ) 𝐸32 2 𝛾 𝜎
𝛽 𝛽⊤ 𝛽𝛽 1 − 𝐸2⊤ (𝑆𝑡−1 + 2 2 2 ) 𝐸2 − 𝐸2⊤ ( 2 2 0 ) 𝐸3 2 𝜎 𝜎 + (𝑆𝑡−1 𝜇𝑡−1 +
𝛽2 𝑎𝑡 ⊤ 𝛽𝑎 ) 𝐸2 + 0 2 𝑡 𝐸3 ) . 𝜎2 𝜎
To derive 𝜇𝑡 and 𝑆𝑡 , we rearrange the exponent of (28) as a canonical quadratic form in terms of (𝐸2 , 𝐸3 ). It is not difficult to have the following formulas after some algebra:
(22)
𝑍1
𝜇𝑡 = 𝑆𝑡−1 [
⋅ 𝑃 (𝑒𝑅+1 | 𝑦1𝑅 , 𝑒1𝑅 , 𝑐1𝑅 ) = N (𝑦𝑅+1 ; 𝑏𝑅+1 +
𝑅 𝛽⊤ 𝑒𝑅+1−𝑞
2
+ 𝛽0 𝑒𝑅+1 , 𝜎 )
⋅ N (𝑒𝑅+1 ; 0, 𝛾2 ) = N (𝑒𝑅+1 ;
𝑆𝑡 = [
(23)
𝛽0 𝛾2 𝜎2 𝛾2 (𝑦 − 𝑏 ) , ) . (24) 𝑅+1 𝑅+1 𝛽02 𝛾2 + 𝜎2 𝛽02 𝛾2 + 𝜎2
𝜇𝑅+1 𝑆𝑅+1 (=
Σ−1 𝑅+1 )
𝛽2 𝛾2 + 𝜎2 = 0 2 2 . 𝜎𝛾
𝐸2 𝐸3
∝ N (𝑦𝑡 ; 𝑏𝑡 + 𝛽1⊤ 𝐸1 + 𝛽2⊤ 𝐸2 + 𝛽0 𝐸3 , 𝜎2 ) ⋅ N (𝐸2 ;
(26)
−1 ) ⋅ N (𝐸3 ; 0, 𝛾2 ) 𝜇𝑡−1 , 𝑆𝑡−1
∝
𝐸2 exp (− 32 2𝛾
−
1 ⊤ (𝐸 − 𝜇𝑡−1 ) 𝑆𝑡−1 (𝐸2 − 𝜇𝑡−1 ) 2 2 2
𝑡
𝑍2 =
(29) ],
𝛽2 𝑎𝑡 , 𝜎2
𝛽0 𝑎𝑡 , 𝜎2 𝛽2 𝛽2⊤ , 𝜎2
𝑄12 =
𝛽2 𝛽0 , 𝜎2
𝑄22 =
2 1 𝛽0 + 2. 2 𝛾 𝜎
(30)
Finally, for the third case (𝑡 > 𝑅 + 𝑞 + 1), the variables 𝑡 to be inferred (i.e., 𝑒𝑅+1 ) are partitioned into three groups of 𝑡−𝑞−1 𝑡−1 variables: 𝐸1 = 𝑒𝑅+1 , 𝐸2 = 𝑒𝑡−𝑞 , and 𝐸3 = 𝑒𝑡 . Here, 𝐸1 and 𝐸2 , when concatenated, yield a vector of the same dimension as 𝜇𝑡−1 , and we partition 𝜇𝑡−1 accordingly as 𝜇𝑡−1 (1) and 𝜇𝑡−1 (2). Similarly, 𝑆𝑡−1 is partitioned into (2×2) blocks, and we denote them by 𝑆𝑡−1 (𝑖, 𝑗) for 𝑖, 𝑗 ∈ {1, 2}. The posterior can then be written as
𝑡 𝑃 (𝑒𝑅+1
1 ⊤ − 2 ((𝑦 ⏟⏟⏟⏟⏟⏟⏟⏟⏟⏟⏟⏟⏟⏟⏟ 𝑡 − 𝑏𝑡 ) − 𝛽2 𝐸2 − 𝛽0 𝐸3 ) ) 2𝜎 =𝑎
⊤ 𝑄12 𝑄22
𝑍1 = 𝑆𝑡−1 𝜇𝑡−1 +
(25)
] | 𝑦1𝑡 , 𝑒1𝑅 , 𝑐1𝑡 )
],
𝑄11 𝑄12
𝑄11 = 𝑆𝑡−1 +
We next deal with the second case; that is, 𝑅 + 1 < 𝑡 ≤ 𝑅 + 𝑡 𝑅 𝑡−1 𝑞 + 1. We partition 𝑒𝑡−𝑞 into three parts: 𝐸1 = 𝑒𝑡−𝑞 , 𝐸2 = 𝑒𝑅+1 , 𝑡−1 and 𝐸3 = 𝑒𝑡 . The parameter vector 𝛽 for 𝑒𝑡−𝑞 is accordingly divided into subvectors 𝛽1 (for 𝐸1 ) and 𝛽2 (for 𝐸2 ). We only 𝑡 ; thus 𝐸2 and 𝐸3 and the conditional density need to infer 𝑒𝑅+1 can be derived as follows: 𝑡 | 𝑦1𝑡 , 𝑒1𝑅 , 𝑐1𝑡 ) = 𝑃 ([ 𝑃 (𝑒𝑅+1
𝑍2
where
𝑡−1 𝑅 In (23), 𝑏𝑡 = 𝛼⊤ 𝑦𝑡−𝑝 +𝜂⊤ 𝑐𝑡 +𝜌 as before, and we use 𝑒𝑅+1−𝑞 = 0. The theorem of product of two Gaussians is applied to yield (24) from (23). This forms the initial posterior mean and inverse covariance as follows:
𝛽 𝛾2 (𝑦 − 𝑏𝑅+1 ) = 0 2 𝑅+1 , 𝛽0 𝛾2 + 𝜎2
(28)
|
𝑦1𝑡 , 𝑒1𝑅 , 𝑐1𝑡 )
𝐸1 [𝐸 ] 𝑡 𝑅 𝑡 = 𝑃 ([ 2 ] | 𝑦1 , 𝑒1 , 𝑐1 ) [𝐸3 ]
(27)
𝐸1 (31) ∝ N (𝑦𝑡 ; 𝑏𝑡 + 𝛽⊤ 𝐸2 + 𝛽0 𝐸3 , 𝜎2 ) ⋅ N ([ ] ; 𝜇𝑡−1 , 𝐸2 −1 ) ⋅ N (𝐸3 ; 0, 𝛾2 ) 𝑆𝑡−1
6
Mathematical Problems in Engineering
∝
𝐸2 exp (− 32 2𝛾 −
2
1 ⊤ − 2 ((𝑦 ⏟⏟⏟⏟⏟⏟⏟⏟⏟⏟⏟⏟⏟⏟⏟ 𝑡 − 𝑏𝑡 ) − 𝛽 𝐸2 − 𝛽0 𝐸3 ) 2𝜎 =𝑎 𝑡
1 2 2
𝑄23 =
𝛽𝛽0 , 𝜎2
𝑄33 =
2 1 𝛽0 + . 𝛾2 𝜎2
(32) 2
3. Empirical Study
⊤
⋅ ∑ ∑ (𝐸𝑖 − 𝜇𝑡−1 (𝑖)) 𝑆𝑡−1 (𝑖, 𝑗) (𝐸𝑗 − 𝜇𝑡−1 (𝑗))) 𝑖=1 𝑗=1
2 1 1 1 1 𝛽 ∝ exp (− ( 2 + 02 ) 𝐸32 − 𝐸1⊤ 𝑆𝑡−1 (1, 1) 𝐸1 − 2 𝛾 𝜎 2 2
⋅ 𝐸2⊤ (𝑆𝑡−1 (2, 2) + − 𝐸2⊤ (
𝛽𝛽⊤ ) 𝐸2 − 𝐸1⊤ 𝑆𝑡−1 (1, 2) 𝐸2 𝜎2
𝛽𝛽0 ) 𝐸3 + (𝑆𝑡−1 (1, 1) 𝜇𝑡−1 (1) 𝜎2
(33)
⊤
+ 𝑆𝑡−1 (1, 2) 𝜇𝑡−1 (2)) 𝐸1 + (𝑆𝑡−1 (2, 2) 𝜇𝑡−1 (2) + 𝑆𝑡−1 (2, 1) 𝜇𝑡−1 (1) +
𝛽𝑎 𝛽𝑎𝑡 ⊤ ) 𝐸2 + 0 2 𝑡 𝐸3 ) . 𝜎2 𝜎
Similar to the second case, we derive 𝜇𝑡 and 𝑆𝑡 by rearranging the exponent of (33) as a canonical quadratic form in terms of (𝐸1 , 𝐸2 , 𝐸3 ). The resulting formulas are as follows:
𝜇𝑡 =
𝑆𝑡−1
𝑍1 [𝑍 ] [ 2] , [𝑍3 ]
(34)
𝑄11 𝑄12 𝑄13
] [ ⊤ ] 𝑆𝑡 = [ [𝑄12 𝑄22 𝑄23 ] , ⊤ ⊤ [𝑄13 𝑄23 𝑄33 ] where 𝑍1 = 𝑆𝑡−1 (1, 1) 𝜇𝑡−1 (1) + 𝑆𝑡−1 (1, 2) 𝜇𝑡−1 (2) , 𝑍2 = 𝑆𝑡−1 (2, 2) 𝜇𝑡−1 (2) + 𝑆𝑡−1 (2, 1) 𝜇𝑡−1 (1) + 𝑍3 =
𝛽0 𝑎𝑡 , 𝜎2
𝑄11 = 𝑆𝑡−1 (1, 1) , 𝑄12 = 𝑆𝑡−1 (1, 2) , 𝑄13 = 0, 𝑄22 = 𝑆𝑡−1 (2, 2) +
𝛽𝛽⊤ , 𝜎2
𝛽𝑎𝑡 , 𝜎2
(35)
In this section we empirically test the effectiveness of the proposed sARMA estimation method. In particular we deal with the task of portfolio selection on the real-world dataset comprising daily closing prices from Dow Jones Industrial Average (DJIA). We consider the task of online portfolio selection (OLPS) problem with real stock return data. We begin with a brief description of the OLPS problem. Assuming there are 𝑀 different stocks to invest in daily basis, at the beginning of day 𝑡, the historic closing stock prices up to day 𝑡 − 1, denoted by {𝑃𝜏 }𝑡−1 𝜏=0 , are available, where 𝑃𝜏 is 𝑀-dim vector whose 𝑗th element 𝑃𝜏 (𝑗) is the price of the 𝑗th ticker. Using the information, you decide the portfolio allocation vector 𝑥𝑡 , a nonnegative 𝑀-dim vector that sums to 1 (i.e., ∑𝑀 𝑗=1 𝑥𝑡 (𝑗) = 1). Assuming no short positioning is allowed, 𝑥𝑡 (𝑗) is the proportion of the whole budget to be invested in the 𝑗th stock for 𝑗 = 1, . . . , 𝑀. The portfolio strategy is thus a function that maps the historic market information (say {𝑃𝜏 }𝑡−1 𝜏=0 ) to the price prediction 𝑃𝑡 . The sARMA-based portfolio strategy can be built by estimating sARMA models, one for each stock ticker 𝑗, for the stock log-return data; namely, 𝑦𝑡 = log 𝑃𝑡 − log 𝑃𝑡−1 (here, we drop the dependency on 𝑗 for simplicity). Then the predicted 𝑦̂𝑡 can be used to decide the proportion of the budget to be invested in the 𝑗th ticker at time 𝑡. A reasonable strategy is to make no investment (i.e., 𝑥𝑡 (𝑗) = 0) if 𝑦̂𝑡 < 0, while forcing 𝑥𝑡 (𝑗) to be proportional to 𝑦̂𝑡 if 𝑦̂𝑡 > 0. To evaluate the performance of a portfolio strategy, we use the popular (running) relative cumulative wealth (RCW) defined as RCW(𝑡) = 𝐴 𝑡 /𝐴 0 , where 𝐴 𝑡 is the total budget at time 𝑡. Thus RCW(𝑡) indicates the total budget return at time 𝑡 compared to the initial budget, and the portfolio strategy that yields high RCW(𝑡) for many epochs 𝑡’s is regarded as a good strategy. Assuming that there is no transaction cost, it is not difficult to see that RCW(𝑡) = ∏𝑡𝜏=1 𝑟𝜏⊤ 𝑥𝜏 where we define the price relative vector 𝑟𝑡 = 𝑃𝑡 /𝑃𝑡−1 (division element-wisely). Hence, in the sARMA model, it is crucial to accurately forecast the returns, and we compare the model estimated by our cost-sensitive loss with the one using traditional ML estimation. For each approach, we estimate 𝑀 sARMA models, one for each stock return, and once the predicted returns 𝑦̂𝑡 (𝑗)’s at 𝑡 are obtained, 𝑥𝑡 (𝑗)’s are decided as follows: 𝑥𝑡 (𝑗) = 0 if 𝑦̂𝑡 (𝑗) < 𝜖 and 𝑥𝑡 (𝑗) = 1/𝑀1 where 𝑀1 is the number of 𝑗’s with 𝑦̂𝑡 (𝑗) ≥ 𝜖. We also contrast them with the fairly standard market portfolio strategy which sets 𝑥𝑡 (𝑗) to be proportional to the total market volume (i.e., the product of the price and the total number of shares) of the ticker 𝑗. We test the above-mentioned three portfolio strategies on the real-world data, the 30 tickers’ daily closing prices from
Relative cumulative wealth (RCW)
Mathematical Problems in Engineering
7 for the financial asset return data. The proposed cost function effectively encodes the goodness of matching in directions between true and model predicted asset returns, which is directly related to ultimate profits in the investment. We have provided the subgradient-based optimization using the trustregion approximation, where it has been empirically shown to work well for the portfolio selection problem in a real-world situation.
1.1 1 0.9 0.8 0.7 0.6 0.5
Conflict of Interests 50
100
150 200 Trading days
250
300
Market strategy sARMA-ML sARMA-cost
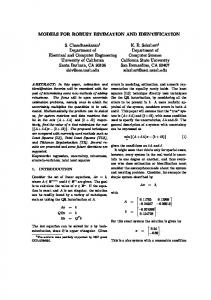
Figure 1: Running relative cumulative wealth for three competing portfolio selection strategies on the DJIA stock return data.
Dow Jones Industrial Average (DJIA) for about 15 months beginning on January 14, 2001, which amounts to about 340 daily records. The dataset is available publicly (http://www .mysmu.edu.sg/faculty/chhoi/olps/datasets.html, http://www .cs.technion.ac.il/∼rani/portfolios), and the detailed description can be found in [22]. The stock tickers appear to be considerably correlated with one another and include GE, Microsoft, AMEX, GM, COCA-COLA, and Intel. In the sARMA estimation, we set 𝑝 = 𝑞 = 2, and the cross predictors 𝑐𝑡 are defined to be the returns of the other 29 stocks at day 𝑡 − 1. The parameter 𝜆 in our costsensitive estimation is empirically chosen. First, the average costs attained, that is, (1/𝑇) ∑𝑇𝑡=1 𝐶(𝑦̂𝑡 , 𝑦𝑡 ), which are further averaged over 𝑀 different models, are 114.0994 for the MLestimated sARMA and 0.0030 for the proposed cost-sensitive sARMA. This implies that the proposed estimation method yields a far more accurate prediction performance than the traditional ML method in terms of the proposed cost function. Next, we depict the running RCW scores for three competing portfolio strategies in Figure 1. As shown, the proposed approach (sARMA-cost) achieves the highest profits consistently for almost all 𝑡’s during the time horizon, significantly outperforming the market strategy. The MLbased sARMA estimator performs the worst, which can be explained by its attempt at fitting a model to overall data, not accounting for the asymmetric loss structure for the asset return data, especially regarding the directions of return predictions. In the end, for 𝑡 > 250, the proposed method indeed gives positive return (i.e., RCW(𝑡) > 1) whereas the other two methods suffer from substantial budget loss (RCW(𝑡) < 1). This again signifies the effectiveness of the cost-sensitive loss minimization in the return prediction.
4. Conclusion In this paper we have introduced a novel ARMA model identification method that exploits the asymmetric loss structure
The author declares that there is no conflict of interests regarding the publication of this paper.
Acknowledgment This study is supported by National Research Foundation of Korea (NRF-2013R1A1A1076101).
References [1] G. Box, G. M. Jenkins, and G. Reinsel, Time Series Analysis: Forecasting & Control, Prentice Hall, Upper Saddle River, NJ, USA, 1994. [2] R. F. Engle, “Autoregressive conditional heteroscedasticity with estimates of the variance of United Kingdom inflation,” Econometrica, vol. 50, no. 4, pp. 987–1007, 1982. [3] T. Bollerslev, “Generalized autoregressive conditional heteroskedasticity,” Journal of Econometrics, vol. 31, no. 3, pp. 307– 327, 1986. [4] D. B. Nelson, “Conditional heteroskedasticity in asset returns: a new approach,” Econometrica, vol. 59, no. 2, pp. 347–370, 1991. [5] M. B. Priestley, Non-Linear and Non-Stationary Time Series Analysis, Academic Press, London, UK, 1988. [6] H. Tong, Non-Linear Time Series: A Dynamical System Approach, Oxford University Press, Oxford, UK, 1990. [7] J. Liu and P. J. Brockwell, “On the general bilinear time-series model,” Journal of Applied Probability, vol. 25, no. 3, pp. 553– 564, 1988. [8] H. Tong, Threshold Models in Nonlinear Time Series Analysis, vol. 21 of Lecture Notes in Statistics, Springer, New York, NY, USA, 1983. [9] J. D. Hamilton, “A new approach to the economic analysis of nonstationary time series and the business cycle,” Econometrica, vol. 57, no. 2, pp. 357–384, 1989. [10] C. J. Kim and C. R. Nelson, State Space Models with Regime Switching, Academic Press, New York, NY, USA, 1999. [11] J. T. Olkkonen, S. Ahtiainen, K. Jarvinen, and H. Olkkonen, “Adaptive matrix/vector gradient algorithm for design of IIR filters and ARMA models,” Journal of Signal and Information Processing, vol. 4, no. 2, pp. 212–217, 2013. [12] P. X.-K. Song, R. K. Freeland, A. Biswas, and S. Zhang, “Statistical analysis of discrete-valued time series using categorical ARMA models,” Computational Statistics & Data Analysis, vol. 57, no. 1, pp. 112–124, 2013. [13] S. Laurent, C. Lecourt, and F. C. Palm, “Testing for jumps in conditionally Gaussian ARMA-GARCH models, a robust approach,” Computational Statistics & Data Analysis, 2014.
8 [14] B. Thiesson, D. M. Chickering, D. Heckerman, and C. Meek, “ARMA time-series modeling with graphical models,” in Proceedings of the 20th Conference on Uncertainty in Artificial Intelligence (UAI ’04), pp. 552–560, 2004. [15] A. P. Dempster, N. M. Laird, and D. B. Rubin, “Maximum likelihood from incomplete data via the EM algorithm,” Journal of the Royal Statistical Society, vol. 39, pp. 1–38, 1977. [16] H. Varian, “A Bayesian approach to real estate assessment,” in Studies in Bayesian Econometrics and Statistics in Honor of L.J. Savage, S. E. Feinberg and A. Zellner, Eds., North-Holland, Amsterdam, The Netherlands, 1974. [17] A. Zellner, “Bayesian estimation and prediction using asymmetric loss functions,” Journal of the American Statistical Association, vol. 81, no. 394, pp. 446–451, 1986. [18] C. W. J. Granger, “Prediction with a generalized cost of error function,” Journal of the Operational Research Society, vol. 20, pp. 199–207, 1969. [19] N. Z. Shor, Minimization Methods for Non-Differentiable Functions, Springer, Berlin, Germany, 1985. [20] D. P. Bertsekas, Nonlinear Programming, Athena Scientific, Belmont, Mass, USA, 1999. [21] D. C. Sorensen, “Newton’s method with a model trust region modification,” SIAM Journal on Numerical Analysis, vol. 19, no. 2, pp. 409–426, 1982. [22] B. Li and S. C. Hoi, “On-line portfolio selection: a survey,” Tech. Rep., Nanyang Technological University, Singapore, 2012.
Mathematical Problems in Engineering
Advances in
Operations Research Hindawi Publishing Corporation http://www.hindawi.com
Volume 2014
Advances in
Decision Sciences Hindawi Publishing Corporation http://www.hindawi.com
Volume 2014
Journal of
Applied Mathematics
Algebra
Hindawi Publishing Corporation http://www.hindawi.com
Hindawi Publishing Corporation http://www.hindawi.com
Volume 2014
Journal of
Probability and Statistics Volume 2014
The Scientific World Journal Hindawi Publishing Corporation http://www.hindawi.com
Hindawi Publishing Corporation http://www.hindawi.com
Volume 2014
International Journal of
Differential Equations Hindawi Publishing Corporation http://www.hindawi.com
Volume 2014
Volume 2014
Submit your manuscripts at http://www.hindawi.com International Journal of
Advances in
Combinatorics Hindawi Publishing Corporation http://www.hindawi.com
Mathematical Physics Hindawi Publishing Corporation http://www.hindawi.com
Volume 2014
Journal of
Complex Analysis Hindawi Publishing Corporation http://www.hindawi.com
Volume 2014
International Journal of Mathematics and Mathematical Sciences
Mathematical Problems in Engineering
Journal of
Mathematics Hindawi Publishing Corporation http://www.hindawi.com
Volume 2014
Hindawi Publishing Corporation http://www.hindawi.com
Volume 2014
Volume 2014
Hindawi Publishing Corporation http://www.hindawi.com
Volume 2014
Discrete Mathematics
Journal of
Volume 2014
Hindawi Publishing Corporation http://www.hindawi.com
Discrete Dynamics in Nature and Society
Journal of
Function Spaces Hindawi Publishing Corporation http://www.hindawi.com
Abstract and Applied Analysis
Volume 2014
Hindawi Publishing Corporation http://www.hindawi.com
Volume 2014
Hindawi Publishing Corporation http://www.hindawi.com
Volume 2014
International Journal of
Journal of
Stochastic Analysis
Optimization
Hindawi Publishing Corporation http://www.hindawi.com
Hindawi Publishing Corporation http://www.hindawi.com
Volume 2014
Volume 2014