ssp p p p d to ssp p p d d . These effects cause the prominent anticrossings in the data. It should be noted that the crossing points are quite strongly influenced by ...
PHYSICAL REVIEW B
VOLUME 58, NUMBER 24
15 DECEMBER 1998-II
Coulomb interactions in small charge-tunable quantum dots: A simple model R. J. Warburton, B. T. Miller, C. S. Du¨rr, C. Bo¨defeld, K. Karrai, and J. P. Kotthaus Sektion Physik der Ludwig-Maximilians-Universita¨t Mu¨nchen, Geschwister-Scholl-Platz 1, 80539 Mu¨nchen, Germany
G. Medeiros-Ribeiro and P. M. Petroff Materials Department and QUEST, University of California–Santa Barbara, Santa Barbara, California 93106
S. Huant Sektion Physik der Ludwig-Maximilians-Universita¨t Mu¨nchen, Geschwister-Scholl-Platz 1, 80539 Mu¨nchen, Germany and Laboratoire de Spectrometrie Physique, Universite´ Joseph Fourier de Grenoble and Centre National de la Recherche Scientifique, Boıˆte Postal 87, F-38402 Saint Martin d’Heres, France ~Received 9 April 1998; revised manuscript received 7 July 1998! We present perturbation theory results for the Coulomb interactions between electrons, and between electrons and holes, in small quantum dots. The results are used to model both capacitance and interband spectroscopy on charge-tunable, self-assembled dots. At the level of the experimental resolution, currently limited by the inhomogeneous broadening in the dot ensemble, the model calculations reproduce the experimental results extremely well. @S0163-1829~98!05747-6#
I. INTRODUCTION
The study of semiconductor quantum dots is motivated in part by interest in the Coulomb interactions between carriers confined on very small length scales. For quantum dots defined by lithographic techniques, for instance post-growth processing of a two-dimensional electron gas in GaAs, it is possible to design highly tunable systems.1,2 Coulomb blockade can be observed in the tunneling spectrum of such a quantum dot as the potential of the dot is changed with respect to the contact region. However, such dots are typically hundreds of nm in size so that the contribution of the quantization energy to the addition energies is very small. Although quantum mechanical effects are visible, much of the physics can be described by a classical model of the electrostatics.1,2 A recent approach has been to contact small mesas in vertical tunneling structures.3,4 In this case, the quantization energy and the Coulomb interaction energy are comparable and the tunneling spectrum exhibits strong quantum effects, notably highly nonequidistant charging peaks. This phenomenon can be explained by the level structure of the dot and the effects of the direct and exchange interactions.5 It is of considerable interest to see how the optical response, both for interband and intraband excitations, changes with the electron occupancy. It is difficult to measure the optical response of a single dot and an ensemble of dots is generally required. The challenge here is to make the dots homogeneous enough so that the dots all have the same electron occupation. With a lithographically defined system, this has only been achieved for dots a few 100 nm in size and for electron occupancies up to three per dot.6 Self-assembled quantum dots have much to offer this field. First, they are small with a lateral extent of ;20 nm ~Ref. 7!, which cannot be realized lithographically. This small lateral size leads to large quantization energies, typically tens of meV. The Coulomb interaction energy between two electrons confined in such a dot can be smaller than the 0163-1829/98/58~24!/16221~11!/$15.00
PRB 58
quantization energy which means that a quantum mechanical description of the Coulomb effects is important. Second, the dots are highly homogeneous7 so that simultaneous charging of many 106 dots can be achieved.8,9 This is ideal for optical experiments. We have incorporated InAs self-assembled quantum dots in a field-effect structure.8 We have already reported the results of capacitance10 and interband transmission experiments.11 The capacitance spectrum shows single electron charging peaks for the first eight electrons. However, although the effects of exchange and changes in the single particle configuration in a magnetic field could be inferred from the data,10 no detailed comparison with a model calculation was presented. In interband spectroscopy, shifts of higher transitions were observed on occupation of the first electron state. This is also a consequence of the Coulomb interaction, in this case an interaction between the electrostatically stored charge and the optically excited electronhole pair. Some numerical results were presented in Ref. 11 but without derivation. We present here also results of photoluminescence experiments that show very clearly the effects of the Coulomb interaction. The purpose of the present paper is to describe calculations of the Coulomb interactions in self-assembled quantum dots with simple perturbation theory. The calculations give a convincing description of our experiments. The results are listed in a series of tables so that they can be applied to other dot systems. It should be appreciated that the major limitation is the inhomogenous broadening in the experimental spectra due to dot to dot fluctuations. This limits the resolution of our experiments, and obscures any fine structure on the meV scale. It also limits the accuracy with which we can determine the dots’ parameters. The calculations do not take into account mixing of single particle configurations through the Coulomb interaction, and therefore, also ignore any structure on the meV scale. However, since our approach verifies that Cou16 221
©1998 The American Physical Society
R. J. WARBURTON et al.
16 222
PRB 58
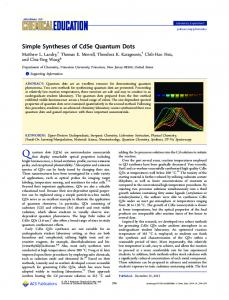
FIG. 1. Capacitance against gate voltage for a sample with gate area 89 mm2 at 23 T. The prominent maxima occur when electron tunneling from the back contact into the InAs dots takes place.
lomb interactions are important one can expect a rich structure at the meV scale in the interband optics. Calculations of photoluminescence from InAs dots as a function of electron occupation show a variety of polarization-dependent splittings,12 but this fine structure has not yet been observed. Our results seem to describe the ensemble properties, but they should be taken as a rough guide for spectroscopy on single dots. II. EXPERIMENTAL DETAILS
The samples, InAs dots on GaAs, were grown in the Stranski-Krastanov mode, with dot densities in the range 109 21010 cm22 . 7 The dots are separated by a tunnel barrier of undoped GaAs from an n 1 -type layer that serves as a back contact. A GaAs/AlAs superlattice acts as a barrier to prevent electron tunneling to the surface. The coupling between the dots and a metal electrode on the sample surface is then purely capacitive. We present results from three experiments. First, we have measured the capacitance between back contact and gate in a magnetic field applied along the growth direction. With gate areas of a few mm2 we can resolve the single electron charging of the first electron state ~the s state!.13 However, the inhomogeneous broadening is too large for us to resolve the single electron charging of the second state ~the p state!. We have, therefore, developed an on-chip capacitance bridge14 so that the capacitance from smaller dot arrays can be detected. With this method, the Coulomb blockade of the s, p, and d states can be resolved. A trace taken at 23 T for a sample with 89 mm2 gate area ~about 3500 dots! is shown in Fig. 1. The maxima occur at gate voltages where electron tunneling takes place. We can convert the gate voltage into an energy by assuming that the energetic position of the dots changes linearly with respect to the Fermi energy, which is pinned by the high doping level in the back contact. In other words, a change in gate voltage DV g implies a change in energy DE5l 21 eDV g where l, the lever arm, is 7 for the present devices. In this way we can generate the fan diagram shown in Fig. 2, a plot of the energies at which tunneling occurs ~after subtracting a constant offset!. The interest here is that the addition energies are not constant, or more pre-
FIG. 2. A fan diagram of the charging maxima for the sample with 89 mm2 gate area. The gate voltages at which tunneling occurs have been converted into energy with the lever arm, E5l 21 eV g , and a constant offset has been subtracted ~symbols!. The solid lines show the results of the modeling of the addition energies, treating the Coulomb interactions with perturbation theory. The parameters c used are E ss 518.9 meV, m * 50.057m 0 , and \ v 549.7 meV.
cisely, do not vary monotonically as they would in a purely classical picture of the charging. Instead, they depend significantly on the electron occupation. Second, we have measured the transmission of the devices in the near infrared in order to detect excitonic transitions. Although the changes in transmission from the excitonic absorptions are very small, ;0.01%, we have managed to detect them by using a system with a very high dynamic range and by removing the spectral response of the system with a reference spectrum taken at a large and positive gate voltage. At a large V g we can infer from the capacitance that the dots are completely occupied with electrons and, therefore, that the interband transitions are blocked. The capacitance of the large area sample used for the optical measurements is shown in Fig. 3. Figure 4 shows a set of transmission spectra taken at various voltages. It can be seen that the transitions disappear according to occupation simply from the Pauli exclusion principle. Furthermore, however, it can be seen that the peaks move in energy with electron occupation, as plotted in Fig. 5. This is a consequence of an interaction between the exciton and the electrons and is the focus of the present work. Finally, we present in Fig. 6 photoluminescence ~PL! as a function of gate voltage excited with 7.2 W cm22 of 633 nm light. At large negative V g the PL is suppressed because the excitons are ionized by the electric field.15 At higher V g , the in-built field is screened out so that the dots fill with electrons from the back contact. We can deduce this by simultaneously measuring the transmission: we measured a sample spectrum without laser light, and a reference spectrum at the same V g with laser light. The resulting transmission spectrum is almost identical to the spectrum obtained with a reference spectrum taken without laser light at V g 50.5 V. Un-
PRB 58
COULOMB INTERACTIONS IN SMALL CHARGE- . . .
16 223
FIG. 3. The capacitance of the device with gate area ;3 mm2 that was used for the interband transmission experiments. The electron occupation per dot N is labeled at the appropriate gate voltages.
der these conditions, the PL is strong, but redshifted. At higher V g still, the first excited transition is also observed, implying that the first excited-hole state is populated. This occurs presumably because the hole capture probability has increased. The fundamental PL first blueshifts and then redshifts as more holes are added. The excited peak is redshifted with respect to the corresponding feature in transmission but then shifts slightly to the blue as additional holes are added. All these shifts are consequences of the Coulomb interaction. III. CALCULATIONS
There are four major premises to the calculations we present. First, the quantization energies of both electrons (\ v ) and holes (\ v h ) are larger than the Coulomb energies. By Coulomb energies we mean the interaction energy be-
FIG. 4. Transmission spectra taken at a series of gate voltages V g for a sample with gate area ;3 mm2 . ;0.8 mm2 was illuminated. The curves are labeled with V g , and also with the electron occupation per dot N when this is single valued, and are offset from 1 for clarity.
FIG. 5. Interband energy for the three transitions s-s, p- p, and d-d against the occupation number. The solid lines are the results of the perturbation theory calculations; the symbols the results of the experiments. For s-s, the transition is clearly blocked for N.2. We have plotted here the photoluminescence energies. To be consistent with the transmission experiment, N refers to the total number of electrons after the photon is emitted. For the d-d transition, only those transitions with u m u 52 are shown.
tween either two electrons, or between an electron and a hole, in a single dot. The electron quantization energy has been measured to be 49 meV for the electrons by intraband spectroscopy,13 and the Coulomb interaction between two s electrons has been estimated as 20 meV from capacitance measurements.10 This implies that the Coulomb effects can be treated as perturbations to the single particle structure. In
FIG. 6. Photoluminescence spectra taken at various V g using 7.2 W cm22 of 633 nm excitation. The arrows are a guide to the eye showing how the first peak, the s-s transition, first moves to the red (a2d), then to the blue (d2h) and then to the red again (h2 j). V g 521.5, 21.2, 21.0, 20.85, 20.77, 20.66, 20.45, 20.06, 0.29, and 0.45 V for curves a2 j.
16 224
R. J. WARBURTON et al.
fact, detailed calculations of charging of InAs dots show that the configuration mixing through the Coulomb interaction is weak.16 Second, the lateral quantization energy is much smaller than the vertical quantization energy. The dots are about 6 nm thick yet some 20 nm in diameter, which results in vertical confinement energies almost an order of magnitude larger than the lateral confinement energies. We therefore assume that the dots are two dimensional. Third, the confining potentials are parabolic. This can be justified from the energies of far infrared absorption on these dots that show only a weak dependence on electron occupation.13 ~For a purely parabolic potential there is no dependence of the resonance energy on electron occupation.17! Also, calculations predict close to parabolic potentials,18 although these should be taken with some caution in the absence of detailed information on the exact makeup of the dots. Finally, we neglect any dot-dot interactions. This is likely to be a very good approximation for modeling the interband properties, as in this case the light excites neutral electron-hole pairs that interact weakly when confined in different dots. Dot-dot interactions have a modest effect on the Coulomb blockade,9,19 broadening the peaks slightly, and also increasing the separation of the peaks slightly. However, for the separation between back contact and dots used here, the effects are very small. The average dot-dot separation is larger than the distance from each dot to the back contact so that the highly conductive back contact tends to screen the dot-dot interaction. A typical state involves N electrons in a dot. Our approach is to construct an antisymmetric wave function for the electrons for a particular configuration from the single particle states and then to include the Coulomb interactions with first-order perturbation theory. When exciting an electronhole pair in a dot occupied by N electrons, we construct an antisymmetrized wave function C e for the N11 electrons, and a total wave function by C5C e ~ r1 , . . . ,rN11 ! c h ~ rh ! ,
PRB 58
p2 ,
1 2\ v 8 2 \ v c ; 2
p1 ,
1 2\ v 8 1 \ v c ; 2 3\ v 8 2\ v c ;
d2 ,
v 8 5 Av 2 1 v 2c /4, with v c 5eB/m * , the cyclotron frequency. In magnetic field, the single particle states have the following energies:
3\ v 8 ;
d0 ,
3\ v 8 1\ v c ;
d1 ,
i.e., the magnetic field lifts the degeneracies with respect to m at B50.20 We note at this point that, even at 20 T, the cyclotron resonance frequency is still considerably less than the single-particle energy. The consequence is that the magnetic field is a modest perturbation on the dots’ structure. The single-particle wave functions c , conveniently listed in Ref. 21, are parametrized by an effective length, which we denote as l e for the electrons and l h for the holes. For instance, the s-state electron wave function is
c es ~ r! 5
1
Ap l e
exp~ 2r 2 /2l 2e ! .
The effective length l e is related to the effective mass m * and frequency v by l e5
A
\
~2!
m *v
with, obviously, a similar equation for the holes: l h5
~1!
where c h (rh ) is the single-particle wave function for the hole. This means essentially that any exchange interaction between the electrons and the hole has been omitted. With the assumption of two-dimensional harmonic oscillator wave functions, we can calculate the perturbation theory integrals analytically. We consider here the first three harmonic oscillator states, which we label as s, p, and d. At zero magnetic field, the s level is twofold degenerate, the p level fourfold, and the d level sixfold with single particle energies \v, 2\v, and 3\v, respectively. For the p and d levels we classify the states with the quantum number m, corresponding to eigenvalues of the L z angular momentum operator, as this is the natural basis to use in a magnetic field applied along the z direction. For p, m561; for d, m562,0; we refer in the following to the states as p 2 , p 1 , d 2 , d 0 , and d 1 . In a magnetic field, it is convenient to define an effective frequency v 8 where
\ v 8;
s,
A
\ m* h vh
~3!
.
The lateral potentials of the dots are, therefore, specified by four parameters, e.g., v, v h , m * , and m * h . The matrix element of the Coulomb interaction for a particular state C reduces to a sum of integrals involving the basis states. For the interaction between two electrons in basis states c ei (r) and c ej (r), the integrals are of the form E ci j 5
e2 4 p « 0« r
EE
u c ei ~ r1 ! u 2 u c ej ~ r2 ! u 2 u r1 2r2 u
dr1 dr2
for the direct interactions, and E xi j 5
e2 4 p « 0« r
EEc
e e e e i ~ r1 ! * c j ~ r2 ! * c i ~ r2 ! c j ~ r1 !
u r1 2r2 u
dr1 dr2
for the exchange. These integrals can be evaluated analytically;22 we proceeded for instance by transforming to center-of-mass coordinates r1 2r2 and r1 1r2 in which the integrals separate and become straightforward. We find for example that the direct interaction between two s electrons is E css 5
e2 4 p « 0« r
A
p1 2 le
~4!
PRB 58
COULOMB INTERACTIONS IN SMALL CHARGE- . . .
TABLE I. The direct Coulomb energies E icj 5(e 2 /4p « 0 « r ) **u c i (r1 ) u 2 u c j (r2 ) u 2 / u r1 2r2 u dr1 dr2 where the c i are the eigenstates of the two-dimensional harmonic oscillator. The units are (e 2 /4p « 0 « r ) Ap /2/l where l is the effective length.
c i2 c j
E icj
s-s
1
s-p 1
3 4
s-d 1
19 32
s-d 0
11 16
p 1 -p 1
11 16
p 1 -d 1
77 128
p 1 -d 0
37 64
d 1 -d 1
585 1024
d 0 -d 0
153 256 273 512
d 1 -d 0
in agreement with Ref. 23. In Tables I and II we list the direct and exchange interactions between the various basis states in terms of E css . Similarly, for the interaction between an electron in state c ei (r) and a hole in state c hj (r), the matrix element of the Coulomb interaction is
E eh ij 5
e2 4 p « 0« r
EE c u
e 2 h 2 i ~ re ! u u c j ~ rh ! u
u re 2rh u
TABLE II. The exchange Coulomb energies c i ~ r1 ! * c j ~ r2 ! * c i ~ r2 ! c j ~ r1 ! dr1 dr2 Eijx5~e2/4p « 0 « r ! u r1 2r2 u where the c i are the eigenstates of the two-dimensional harmonic oscillator. The units are (e 2 /4p « 0 « r ) Ap /2/l where l is the effective length.
EE
c i2 c j
E ixj
s-p 1
1 4 3 32 3 16 3 16 31 128 7 64 15 128 57 512 105 1024
s-d 1 s-d 0 p 1 -p 2 p 1 -d 1 p 1 -d 0 p 1 -d 2 d 1 -d 0 d 1 -d 2
TABLE III. The electron-hole energies E iehj e h 2 2 2 5(e /4p « 0 « r ) **u c i (re ) u u c j (rh ) u / u re 2rh u dre drh where the c i are the eigenstates of the two-dimensional harmonic oscillator. The units are e 2 Ap /4p « 0 « r . l e and l h are the effective lengths for the electrons and holes, respectively.
c ei (re )2 c hj (rh ) s-s
E iehj 1 ~l2e 1l2h!1/2
s-p 1
1 2l2e 1l2h 2 ~l2e 1l2h!3/2
s-d 1
1 8l4e 18l2e l2h13l4h 8 ~l2e 1l2h!5/2
s-d 0
1 4l4e 14l2e l2h13l4h 4 ~l2e 1l2h!5/2
p 1 -p 1
1 2l4e 17l2e l2h12l4h 4 ~l2e 1l2h!5/2
p 1 -d 1
1 8l6e 140l 4e l 2h 123l 2e l 4h 16l 6h 16 ~ l 2e 1l 2h ! 7/2
p 1 -d 0
1 4l6e 120l 4e l 2h 17l 2e l 4h 16l 6h 8 ~ l 2e 1l 2h ! 7/2
d 1 -d 1
3 8l8e 140l 6e l 2h 199l 4e l 4h 140l 2e l 6h 18l 8h 64 ~ l 2e 1l 2h ! 9/2
dre drh .
This energy can be interpreted as an exciton binding energy: if an electron is in state c ei in one dot and a hole in state c hj in an identical but well separated dot, the total energy is reduced by E eh i j on confining the two carriers in the same dot. Results for the direct electron-hole interactions are given in Table III. It is particularly straightforward to incorporate the magnetic field: one must simply include the B dependence of
16 225
d 0 -d 0
3 4l8e 14l6e l2h135l 4e l 4h 14l 2e l 6h 14l 8h 16 ~ l 2e 1l 2h ! 9/2
l e and l h by replacing v and v h with v 8 and v 8h in the expressions for l e and l h , respectively.22 The advantage of the present approach is simplicity. We can compare experimental results with analytic expressions for the Coulomb terms. The results are listed in Tables I–III largely because they will also be useful for other semiconductor quantum-dot systems where the dot parameters will change but the basic form of the confining potential will stay the same. Furthermore, it is very hard at present to construct more accurate single particle states as the composition and strain distributions in the dots are not known with any precision. Detailed calculations of the strain depend inevitably on assumptions on the shape and composition of the dots, which are hard to justify. Calculations of the addition energies5 and exciton binding energies24,25 exist in which a summation is performed over many states of a parabolic potential. The use of just the first few states of a parabolic potential, as used here, may well be just as good for our dots because the higher order states do not exist. The dots studied here have three to four bound electron states, and this is representative: dots in other self-assembled systems may have only a single bound electron state,26 or a maximum of five,27 depending on the system. The disadvantage of the present approach is that we have not found the true eigenstates of the system. In Coulomb
16 226
R. J. WARBURTON et al.
blockade, which measures differences in ground-state energies, subtle shifts have, therefore, been neglected. In interband spectroscopy, several transitions are expected for each transition considered here, split by ; meV. These effects are obscured in the experiment by the inhomogeneous broadening. Both the experiments and the theory should be understood as providing information on the Coulomb interactions with limited resolution. IV. MODELING OF THE COULOMB BLOCKADE
The ground-state energy for the N electron state is E N 5E sp ~ N ! 1E C ~ N ! 2l 21 NeV g where E s p (N) is the sum of the single-particle energies, E C (N) the matrix element of the Coulomb interaction, and 2l 21 NeV g expresses the electrostatic energy due to the electric field between gate and back contact. The energy is measured from the Fermi energy pinned by the back contact ~neglecting a constant confinement energy!. We have neglected here the interaction between the electron in the dot and its images in the back contact and in the gate, and also any dot-dot interactions. For the one-electron state, E 1 5\ v 2l 21 eV g . Tunneling of an electron into an empty dot occurs at a particular gate voltage V 1g for which E 1 50, i.e., for l 21 eV 1g 5\ v . For two electrons, the ground-state energy is E 2 52\ v 22l 21 eV g 1E css . E css expresses the Coulomb repulsion between the two s electrons. Tunneling of the second electron into the dot occurs at V 2g for which E 2 5E 1 , i.e., for l 21 eV 2g 5\ v 1E css . For three electrons, E 3 54\ v 23l 21 eV g 1E css 12E csp 2E xsp , where now the exchange energy E xsp between an s and a p electron plays a role. Using the results listed in Tables I and II, we find that the tunneling condition E 2 5E 3 occurs at l 21 eV 3g 52\ v 1 45 E css . In this way it is possible to calculate the gate voltages V ig at which tunneling occurs. The first two addition energies are, therefore, l 21 e ~ V 2g 2V 1g ! 5E css , 1 l 21 e ~ V 3g 2V 2g ! 5\ v 1 E css . 4 We have determined which configurations of single particle states form the N electron ground states as a function of magnetic field. There are abrupt changes in the configurations at critical magnetic fields, as listed in Table IV. The resulting ground-state energies are plotted as straight lines in Fig. 2 and can be seen to reproduce the experimental data extremely well. We make the following comments. We have adjusted all three parameters l e , \v, and m * to fit the data. The addition energy l 21 e(V 2g 2V 1g ) determines the Coulomb energy E css , and hence with Eq. ~4! the effective length l e . We find E css 518.9 meV, and hence l e 576 Å.
PRB 58
TABLE IV. The cyclotron energies \ v c of the magnetic-fieldinduced transitions. \vc
i 1:
ssp 2 p 1 p 2 p 1 d 2 d 1 →ssp 2 p 1 p 2 p 1 d 2 d 2
2:
ssp 2 p 1 →ssp 2 p 2
3:
ssp 2 p 2 p 1 p 1 →ssp 2 p 2 p 1 d 2
4:
ssp 2 p 2 p 1 p 1 d 2 →ssp 2 p 2 p 1 d 2 d 2
5:
ssp 2 p 2 p 1 →ssp 2 p 2 d 2
6:
ssp 2 p 2 p 1 d 2 →ssp 2 p 2 d 2 d 2
105 c 2048 E ss 3 c 16 E ss 2 25 c 3 \ v 2 64 E ss 2 511 c 3 \ v 2 1536 E ss 2 49 c 3 \ v 2 192 E ss 2 101 c 3 \ v 2 512 E ss
8 8 8 8
\v can then be determined from the addition energy l 21 e(V 3g 2V 2g ) by subtracting 41 E css ; we find \ v 549.7 meV, which is in excellent agreement with the value obtained from far-infrared spectroscopy on the same samples. The magnetic-field dispersions of V 4g and V 5g give a value of the effective mass m * 50.057m 0 . This is somewhat problematic as it is smaller than the value obtained from the magnetic field dispersion of the far-infrared absorption 0.08m 0 and it leads to a conflict with Eq. ~2!. With m * 50.057m 0 and \ v 549.7 meV one would expect l e 552 Å which is smaller than the value deduced above from the Coulomb blockade. However, these comments notwithstanding, we do not believe that this represents a serious discrepancy of our model. The electrostatics of our device are complex, and we have taken here a simplified view. We have tried including the interaction with the image charges, but this makes no significant difference to the overall agreement with the experiment. It could be the case that the conversion of the gate voltage into an energy simply with a lever arm is too simplistic. A further possibility is that the confinement potential is not exactly parabolic, in which case Eq. ~2! will not hold exactly. The spirit of our calculation is to get agreement at the 10% level, and in this sense Fig. 2 represents a success. At B50 the four peaks representing Coulomb blockade in the p level are not equally spaced. In the modeling we find 1 l 21 e ~ V 4g 2V 3g ! 5 E css , 2 7 l 21 e ~ V 5g 2V 4g ! 5 E css , 8 1 l 21 e ~ V 6g 2V 5g ! 5 E css , 2 i.e., the addition energy l 21 e(V 5g 2V 4g ) is much larger than the two neighboring addition energies. This is a consequence of the exchange energy, and is entirely reminiscent of Hund’s rule in atomic physics. For the N54 ground state at B50 it is energetically favorable for the two electrons in the p level to have the same spin, as this minimizes the total energy by a p-p exchange term. To form the N55 ground state, the fifth electron is forced to have opposite spin to the other two p electrons, which means that tunneling is not aided by an exchange term, hence the larger addition energy.
PRB 58
COULOMB INTERACTIONS IN SMALL CHARGE- . . .
There exists a critical magnetic field (B 2c ) at which the N54 ground state changes composition, from ssp 2 p 1 to ssp 2 p 2 . This is because the p 2 state decreases in energy with increasing B. At a particular magnetic field, it becomes energetically advantageous for the two p electrons to occupy the p 2 state. The loss of the exchange energy is compensated by a reduction in the single-particle contribution. We calculate that the critical magnetic field is given by \ v c5
3 c E , 16 ss
which we solve to give B 2c 51.7 T using the parameters described above. This change in the single-particle configuration gives a kink in the dispersion of both the V 4g and V 5g peaks. Although this is not unambiguously observed in the experiments it can be seen in Fig. 2 that the third and fourth peaks in the capacitance do have a change of gradient with B around 1 T. A similar effect occurs also in the N58 ground state: the configuration changes from ss p 2 p 1 p 2 p 1 d 2 d 1 to ssp 2 p 1 p 2 p 1 d 2 d 2 at a low magnetic field (B 1c 50.5 T!. At higher field, further changes in the configurations occur as shown in Fig. 2. The behavior around 14 T is at first sight rather complicated; however, it can be understood by the critical fields in Table IV and by noting that the dispersion of a particular tunneling peak is determined by the orbital occupied by the final electron to tunnel in. For N55, the ground state is ss p 2 p 2 p 1 at low magnetic fields, changing to ssp 2 p 2 d 2 at B 5c 514.6 T. Similarly, for N56 it becomes energetically favorable in the measured field range to occupy the d state. The ground state at low magnetic field (B,B 3c 513.2 T! ss p 2 p 2 p 1 p 1 becomes ss p 2 p 2 p 1 d 2 and then ssp 2 p 2 d 2 d 2 for B.B 6c 515.2 T. Likewise, the N57 configuration changes at B 4c 513.8 T from ssp 2 p 2 p 1 p 1 d 2 to ss p 2 p 2 p 1 d 2 d 2 . These effects cause the prominent anticrossings in the data. It should be noted that the crossing points are quite strongly influenced by the Coulomb effects and are not given simply by the single particle terms. Neglecting the Coulomb terms would shift the prominent p-d-like crossings to ;17 T in the calculations, which would be inconsistent with the experimental results. The calculations underestimate the energies of l 21 eV 7g and l 21 eV 8g by ;5 meV. This might indicate a worsening of the model’s applicability for highly charged states. However, another explanation can be put forward. A particular feature of the capacitance traces on small area samples is the appearance of replica of the main tunneling peaks, separated by ;5 meV from the main peaks.10 This implies a bunching in the density of states, arising possibly from monolayer fluctuations in the wetting layer. Plotted in Fig. 2 are the main peaks. If the amplitudes of the subsidiary peaks change slightly with gate voltage then it would be easy to pick out tunneling peaks in the spectra that do not correspond to the same group of dots. This would resolve the discrepancy in Fig. 2. We do not see abrupt changes in gradient at the critical magnetic fields as there is an averaging over the dot ensemble ~symbols in Fig. 2!. However, Tarucha et al.4 have measured a single dot and they have been able to observe kinks in the energy spectrum, exactly as calculated ~solid
16 227
lines in Fig. 2!. For their sample, \ v .E css . Our theory, although barely applicable in this case, predicts remarkably accurate critical magnetic fields, differing by only ;20% from the measurements. This would seem to confirm the conclusion that our approach is a reasonable one in the limit of large confinement. V. MODELING OF THE SHIFTS IN THE INTERBAND SPECTRUM
The selection rule for the interband transitions is Dm 5even from the parity of the electron and hole wave functions. The transitions with Dm50, which we denote as s-s, p-p and d-d, are dominant. We estimate that the Dm52 transitions, for instance s-d, carry at most 5% of the intensity of the Dm50 transitions, and are therefore neglected. For neutral dots, the exciton energies are eh E ex ss 5E g 1\ v 1\ v h 2E ss , eh E ex pp 5E g 12\ v 12\ v h 2E pp , eh E ex dd 5E g 13\ v 13\ v h 2E dd ,
where E g is the sum of the dot material band gap and z-confinement energies. These equations, with the electronhole Coulomb energies given in Table III, are used to determine E g , \ v h , and l h from the measured s-s, p-p, and d-d energies for neutral dots. We take \ v 549 meV, as measured with far-infrared spectroscopy, and m * 50.07m 0 . The mass is the GaAs mass, and represents an average of the mass deduced from capacitance and far-infrared spectroscopies. The aim of the calculations is to model the shifts of the transitions on occupation of the dots with electrons. These can only be determined with limited accuracy because of the inhomogeneous broadening; at this level a change in the mass of ;15% is immaterial. We therefore take also l e as given by Eq. ~2! (l e 547 Å!, neglecting any anharmonicity in the confining potential that one might be able to deduce from the capacitance and intraband spectroscopy. The energy differences between the s-s, p-p, and d-d transitions E ex pp ex ex 2E ex ss and E dd 2E pp and Eq. ~3! give three equations for the parameters \ v h , l h , and m * h . The parameters are rather sensitive to the two-energy differences, which can only be deduced to 65 meV because of the inhomogeneous broadening. However, one can expect that m h* is close to the heavy-hole mass of GaAs, which gives us confidence in the parameters we get from numerically solving the simultaneous equations: \ v h 525 meV, l h 535 Å, and m * h 50.25m 0 . This means that the hole quantization energy is smaller than that of the electrons, and also that the holes have a smaller effective length. On exciting an electron-hole pair in a charged dot, additional terms must be included to describe the exciton energies. The electron in the electron-hole pair is clearly repelled from the negatively charged dot and this is represented by a term increasing the exciton energy. On the other hand, the hole is attracted by the negatively charged dot, decreasing the exciton energy. Generally speaking, the attraction of the hole dominates over the repulsion of the electron, causing redshifts. The fundamental reason is that l h ,l e . 28
16 228
PRB 58
R. J. WARBURTON et al.
carried out exactly as for the electrons. Figure 7 reproduces the experimental data remarkably well if we assume that we measure an average of the allowed transitions: the s-s PL is shifted by ;220 meV by the stored negative charge; adding holes induces initially an upward shift of ;5 meV but then a downward shift of ;5 meV. The p-p PL is visible as soon as the hole p state is occupied and exhibits a shift of ;225 meV with respect to the p-p absorption for neutral dots. Further holes cause an upward shift in the p-p PL energy, as in the experimental spectra of Fig. 6. VI. SIMULATION OF THE TRANSMISSION SPECTRA
FIG. 7. Calculated photoluminescence energy for the transitions s-s and p-p. It is assumed that the dots contain five electrons, one electron-hole pair and a variable number of additional holes.
Figure 5 is a plot of the exciton energies as a function of electron occupation. The sample used for these measurements has a larger gate area than the sample used for the capacitance measurements shown in Fig. 1. The Coulomb blockade of the s level is well resolved for the larger area sample, but the Coulomb blockade of the p level is not ~see Fig. 3!. This means that we can choose V g such that the vast majority of dots have N50, N51, or N52, and also N 56, but for N between 3 and 5 there is inevitably a distribution in the electron occupancy. The p-p transition exhibits the largest shifts. For N51, the p electron excited by the photon and the s electron can either have parallel or antiparallel spins. This leads to two c x eh possible energy shifts, E csp 2E eh sp and E sp 2E sp 2E sp , which are not resolved in the experiment. For N52, the shift is 2E cs p 2E xs p 22E eh s p , which is in excellent agreement with the experimental result. Interestingly, on further increase of N, the p-p exciton energy doesn’t change in the experiment, to within 10 meV. As explained above, we inevitably average over a distribution of N for each V g in this regime. Nevertheless, large shifts in energy with increasing N can be ruled out. The calculations reproduce this behavior approximately, if one averages over the various possible transitions shown in Fig. 5. The s-s transition disappears at N52 through Pauli blocking; at N51 the shift is E css 2E eh ss which, at 4 meV, is just resolvable in the experiment. It is possible to follow the s-s transition at higher N by PL experiments that have been reported by Schmidt et al.15,29 on similar samples. A redshift was observed on occupation and the results are in broad agreement with our perturbation theory estimates. We have excited the PL with visible laser light, as shown in Fig. 6. For V g around 20.8 V for this excitation density we fill the dots with electrons and we find a 20 meV redshift of the PL with respect to the s-s energy in transmission. This point is plotted in Fig. 5. At higher V g the dots progressively fill with holes. Figure 7 shows a calculation of the s-s and p-p PL energies, assuming that the dots contain 5 electrons and one electron-hole pair plus a variable number of additional holes. When we have more than one hole, Eq. ~1! is extended so that the hole wave function is also antisymmetric. This is
The linewidths of the interband spectra are determined by the distribution in the size of the quantum dots. For neutral dots, the linewidth of the s-s transition is 30 meV, significantly higher than the linewidth of the charging peaks in the capacitance spectra, 18 meV. The explanation is that the capacitance is broadened only by the distribution in the dots’ ground-state energy with respect to the Fermi energy, yet the interband spectrum has also a contribution from the holes. In order to make this argument quantitative, we assume that the dominant broadening comes from fluctuations in the dots’ thickness, giving a Gaussian distribution of full width at half maximum ~FWHM! G 0 in the electron s-state energy with respect to the Fermi energy. These vertical fluctuations give a contribution of G 0 to the broadening of the Coulomb blockade peaks in the capacitance, but contribute (11 a )G 0 to the interband spectra, the term a G 0 arising from the holes. There are also fluctuations in the lateral size of the dots that contribute to the measured linewidths. This implies that there is a Gaussian distribution in \ v 1\ v h whose FWHM, G 1 , can be estimated from model calculations of the dots’ confining potential.18 A FWHM in the lateral size distribution of 10% of the average size implies approximately a FWHM of 10 meV in \ v 1\ v h . It might be thought that far-infrared spectroscopy measures this broadening directly as this technique is insensitive to fluctuations in the vertical confinement of the dots. It is striking that the measured widths of the intraband absorptions are very small, only 3 meV. However, this linewidth may be reduced from the spread in the singleparticle energy by interdot couplings.30 An equivalent effect has been identified in the cyclotron resonance of highly localized electrons in the quantum limit.31,32 We therefore fit G 1 to the interband data. It is not a priori clear if there is any correlation between the fluctuations in vertical and lateral size. We assume that there is none, i.e., that for each vertical thickness there is the same Gaussian distribution in the lateral thickness. To simulate the transmission spectra of the dot ensemble, we classify the dots with the s-state energy E 0 . The Gaussian distribution of E 0 , N(E 0 ), acts then as a density-ofstates function. We assume initially that V g is large and negative such that all the dots are neutral. For the s-s interband transition, the interband transition energy E ex ss is a function of E 0 : ¯ex E ex ss ~ E 0 ! 5E ss 1 ~ 11 a ! E 0 , where ¯ E ex ss is the average s-s interband energy. We have taken the average value of E 0 to be zero. The absorption at a particular energy E is then given by
PRB 58
COULOMB INTERACTIONS IN SMALL CHARGE- . . .
A ss ~ E ! 5A 0 z^ c es u c hs & z2
2 Aln2
Ap G 1
E
`
2`
N~ E0!
2 2 3exp$ 24ln2 @ E2E ex ss ~ E 0 !# /G 1 % dE 0 ,
¯ex , but with which is also a Gaussian, centered at E5E ss 2 2 2 FWHM A(11 a ) G 0 1G 1 . For the p-p transition for empty dots, A p p ~ E ! 52A 0 z^ c ep u c hp & z2 3
E
`
2`
2 Ap G 1
N ~ E 0 ! exp$ 24ln2 @ E
2 2 2E ex pp ~ E 0 !# / ~ 2G 1 ! % dE 0 .
The prefactor 2 arises because of the doubling in the degeneracy, and the FWHM describing the lateral fluctuations enters as 2G 1 simply because the lateral quantization contributes 2(\ v 1\ v h ) to the energy. The net width A(11 a ) 2 G 20 1(2G 1 ) 2 is larger than the s-s width. We note that if the vertical fluctuations dominated (G 0 @G 1 ), the s-s and p-p interband transitions would be equally broad. Conversely, if the lateral fluctuations dominated (G 1 @G 0 ), the p-p transition would have twice the width of the s-s transition. The truth lies somewhere in between, lending support to the assertion that both broadening mechanisms must be included. The overlap integrals z^ c ei u c hi & z2 are simply evaluated from the harmonic oscillator eigenstates; results are listed in Table V. The proportionality constant A 0 can be related to the measured absorption by using the standard formula for the trans-
A ~ E ! 5A 0 1 1
2 Aln2
( m5s,p,d Ap G
E E
0 E0 1 E0
1
z^ m e u m h & z2
mission of light through a conducting sheet on the surface of a dielectric.33 In turn, the conductivity can be described in a semiclassical approximation,34 and the momentum matrix element evaluated by making the standard separation of the entire wave function as a product of a Bloch function and envelope function @the envelope functions being the c i (r) described above#. The result is A 05
2 Aln2
HE
` 0
E0
16 229
he 2 N dot E p 2E ex m 0 « 0 c ~ 11 A« r !
where E p is the Kane matrix element and N dot is the dot density. For larger V g the dots become charged and this effects the absorption through both Pauli blocking and the occupation dependent shifts. The point is that the dots with a small ground-state energy are occupied first and these dots tend to have a small interband energy. We consider occupations up to two electrons per dot. For each V g we divide the dots into three groups, those with N50, those with N51, and those with N52, according to their s-state energy E 0 : E 0 .E 00 5l 21 eV g ,
N50: N51:
E 10 ,E 0 ,E 00 ,
E 0 ,E 10 5l 21 eV g 2E css .
N52:
To all intents and purposes the dots are homogeneous enough that there are only ever two groups, N50 and N 51, or N51 and N52, which contribute significantly to the absorption. For each group, we integrate over E 0 and sum the absorption for the s-s, p-p, and d-d transitions,
ex N ~ E 0 ! exp$ 24ln2 @ E2E mm ~ E 0 ;0 !# 2 / ~ m11 ! 2 G 21 % dE 0
ex N ~ E 0 ! exp$ 24ln2 @ E2E mm ~ E 0 ;1 !# 2 / ~ m11 ! 2 G 21 % dE 0
1
E0
2`
J
ex N ~ E 0 ! exp$ 24ln2 @ E2E mm ~ E 0 ;2 !# 2 / ~ m11 ! 2 G 21 % dE 0 ,
ex E mm (E 0 ;N) refers to the s-s, p-p, and d-d, exciton energies (m5s,p,d) as a function of E 0 and electron occupation N. The average energies are all taken from the perturbation theory described in the previous section. Each integral in Eq. ~5! reduces to an error function. The parameters needed to generate simulated transmission spectra are determined as follows. We determine N dot by integrating the capacitance trace over the first two Coulomb blockade peaks; for the sample studied here we have N dot 553109 cm22 , and we take E p 525.7 eV, the GaAs value, which is consistent with the use of the GaAs effective mass, not the InAs effective mass, for the analysis of the energy
~5!
shifts. l e and l h are exactly as before, giving, for example, z^ c es u c hs & z2 50.91 and z^ c ep u c hp & z2 50.83. We determine G 0 from the broadening in the capacitance, i.e., G 0 518.0 meV. A rough fit to the data then gives G 1 513.3 meV and a 50.6. As expected, G 1 ,G 0 and a ,1. The simulated transmission curves for several V g are shown in Fig. 8 and can be seen to reproduce the intensities and forms of the resonances rather well. The s-s transition disappears on increasing V g as the s level fills, but not without changes in the lineshape. These come about from the fact that the dots with N51 absorb more weakly and also on average at a lower energy than the dots with N50. At a V g just before the s-s transition disap-
16 230
R. J. WARBURTON et al.
PRB 58
TABLE V. The overlap integrals ^ c ei u c hj & where the c i are the eigenstates of the two-dimensional harmonic oscillator. l e and l h are the effective lengths for the electrons and holes, respectively.
^ c ei u c hj &
c ei 2 c hj
2lelh
s-s
l2e 1l2h
2
l2e 1l2h 2lelh
d 1 -d 1
d 0 -d 0
S D S D S D 2lelh
p 1 -p 1
3
l2e 1l2h
2
2lelh
l2e 1l2h
3
2lelh 22 2 le 1lh
2lelh~l2e 2l2h! s-d
~l2e 1l2h!2
pears completely, only a small subset of the dots can absorb ~those with particularly high E 0 ) and this causes a narrowing of the line. This can be just made out in the experimental results. Changes in the lineshape occur also for the p-p transition. The p-p transition moves to lower energy in two steps as the dots fill initially with one electron and then with two. The d-d transition behaves analogously, except that here the broadening from the lateral fluctuations plays a larger role and so the effects are largely smeared out. The most obvious discrepancy in Fig. 8 is that the transmission at the p-p and d-d energies is lower in the measurements than in the calculations. It would appear that the dot absorption is superimposed on the low-energy tail of a strong absorption at higher energy. The most likely explanation is that it comes from V g -dependent absorption in the wetting layer. We occupy the wetting layer at the large and positive V g used for the reference spectrum ~indicated by a rapid rise in the capacitance! so it is very likely that the wetting layer appears in our spectra through occupation dependent shifts in the band gap or through blocking of absorption channels involving low-energy, localized states. VII. CONCLUSIONS
We have modeled a large body of experimental results on charge-tunable InAs self-assembled quantum dots by treating
1
P. L. McEuen, E. B. Foxman, U. Meirav, M. A. Kastner, Y. Meir, N. S. Wingreen, and S. J. Wind, Phys. Rev. Lett. 66, 1926 ~1991!. 2 R. C. Ashoori, H. L. Stormer, J. S. Weiner, L. N. Pfeiffer, K. W. Baldwin, and K. W. West, Phys. Rev. Lett. 71, 613 ~1993!. 3 T. Schmidt, M. Tewordt, R. H. Blick, R. J. Haug, D. Pfannkuche, K. v. Klitzing, A. Foerster, and H. Lueth, Phys. Rev. B 51, 5570 ~1995!.
FIG. 8. Simulated transmission spectra. Each curve is labeled with the gate voltage and offset from 1 for clarity. These results should be compared to the experimental results shown in Fig. 4.
the Coulomb interactions with perturbation theory. The confining potential is taken to be parabolic and two-dimensional. The results are compared with the addition energies deduced from capacitance measurements, and with exciton energies deduced from transmission and photoluminescence spectroscopy. The inhomogeneous broadening in the experimental spectra limits the accuracy of the measurements on the one hand and the accuracy with which the dot parameters can be determined on the other. Within these uncertainties, the calculations agree very well with the experiments. We have also argued that the inhomogeneous broadening obscures an expected fine structure in the energy levels of charged dots that cannot be treated with the present approach. It is hoped that this fine structure can be resolved in the future by performing experiments on single, charge-tunable dots. ACKNOWLEDGMENTS
We would like to thank A. O. Govorov and D. Pfannkuche for some very helpful comments and W. Hansen and A. Lorke for continuous support. The work was funded by the Deutsche Forschungsgemeinschaft ~SFB 348!, by the BMBF, and by QUEST, a National Science and Technology Center ~Grant No. DMR 20007!. S.H. acknowledges support from the Alexander von Humboldt Foundation.
4
S. Tarucha, D. G. Austing, T. Honda, R. J. van der Hage, and L. P. Kouwenhoven, Phys. Rev. Lett. 77, 3613 ~1996!. 5 M. Eto, Jpn. J. Appl. Phys., Part 1 36, 3924 ~1997!. 6 B. Meurer, D. Heitmann, and K. Ploog, Phys. Rev. Lett. 68, 1371 ~1992!. 7 D. Leonard, K. Pond, and P. M. Petroff, Phys. Rev. B 50, 11 687 ~1994!. 8 H. Drexler, D. Leonard, W. Hansen, J. P. Kotthaus, and P. M.
PRB 58
COULOMB INTERACTIONS IN SMALL CHARGE- . . .
Petroff, Phys. Rev. Lett. 73, 2252 ~1994!. G. Medeiros-Ribeiro, F. G. Pikus, P. M. Petroff, and A. L. Efros, Phys. Rev. B 55, 1568 ~1997!. 10 B. T. Miller, W. Hansen, S. Manus, R. J. Luyken, A. Lorke, J. P. Kotthaus, S. Huant, G. Medeiros-Ribeiro, and P. M. Petroff, Phys. Rev. B 56, 6764 ~1997!. 11 R. J. Warburton, C. S. Du¨rr, K. Karrai, J. P. Kotthaus, G. Medeiros-Ribeiro, and P. M. Petroff, Phys. Rev. Lett. 79, 5282 ~1997!. 12 A. Wojs and P. Hawrylak, Phys. Rev. B 55, 13 066 ~1997!. 13 M. Fricke, A. Lorke, J. P. Kotthaus, G. Medeiros-Ribeiro, and P. M. Petroff, Europhys. Lett. 36, 197 ~1996!. 14 D. Schmerek, S. Manus, A. O. Govorov, W. Hansen, J. P. Kotthaus, and M. Holland, Phys. Rev. B 54, 13 816 ~1996!. 15 K. H. Schmidt, G. Medeiros-Ribeiro, and P. M. Petroff, Phys. Rev. B 58, 3597 ~1998!. 16 A. Wojs and P. Hawrylak, Phys. Rev. B 53, 10 841 ~1996!. 17 L. Brey, N. F. Johnson, and B. I. Halperin, Phys. Rev. B 40, 10 647 ~1989!. 18 A. Wojs, P. Hawrylak, S. Fafard, and L. Jacak, Phys. Rev. B 54, 5604 ~1996!. 19 O. Heller, Ph. Lelong, and G. Bastard, in Proceedings of Electronic Properties of Two-Dimensional Systems, Tokyo, 1997 @Physica B 249–251, 271 ~1998!. 20 V. Fock, Z. Phys. 47, 446 ~1928!. 9
21
16 231
C. Cohen-Tannoudji, B. Diu, and F. Laloe, Quantum Mechanics ~Wiley, New York, 1977!, p. 737. 22 D. Pfannkuche, R. R. Gerhardts, P. A. Maksym, and V. Gudmundsson, Physica B 189, 6 ~1993!. 23 U. Merkt, J. Huser, and M. Wagner, Phys. Rev. B 43, 7320 ~1991!. 24 W. Que, Phys. Rev. B 45, 11 036 ~1992!. 25 J. Song and S. E. Ulloa, Phys. Rev. B 52, 9015 ~1995!. 26 M. Grundmann, N. N. Ledentsov, O. Stier, D. Bimberg, V. M. Ustinov, P. S. Kop’ev, and Zh. I. Alferov, Appl. Phys. Lett. 68, 979 ~1996!. 27 H. Lipsanen, M. Sopanen, and J. Ahopelto, Phys. Rev. B 51, 13 868 ~1995!. 28 Ph. Lelong and G. Bastard, Solid State Commun. 98, 819 ~1996!. 29 K. H. Schmidt, G. Medeiros-Ribeiro, M. Oestreich, P. M. Petroff, and G. H. Do¨hler, Phys. Rev. B 54, 11 346 ~1996!. 30 R. J. Luyken, A. Lorke, M. Haslinger, B. T. Miller, M. Fricke, J. P. Kotthaus, G. Medeiros-Ribeiro, and P. M. Petroff, Physica E 2, 704 ~1998!. 31 U. Merkt, Phys. Rev. Lett. 76, 1134 ~1996!. 32 M. Widmann, U. Merkt, M. Corte´s, W. Ha¨usler, and K. Eberl, Physica B 249-251, 762 ~1998!. 33 G. Abstreiter, J. P. Kotthaus, J. F. Koch, and G. Dorda, Phys. Rev. B 14, 2480 ~1976!. 34 R. S. Knox, Theory of Excitons, in Solid State Physics Suppl. 5 ~Academic Press, New York, 1963!.