Counteracting the contemporaneous proliferation of digital forgeries and fake news Alexandre Ferreira, Tiago Carvalho, Fernanda Andaló, Anderson Rocha∗ July 2018
Abstract Fake news has been certainly the expression of the moment: from political round table discussions to newspapers to social and mainstream media. It is everywhere. With such an intense discussion and yet few effective ways to combat it, what can be done? Providing methods to fight back even the least harming hoax is a social responsibility. To look for authenticity in a wide sea of fake news, every detail is a lead. Image appearance and semantic content of text and images are some of the main properties, which can be analyzed to reveal even the slightest lie. In this vein, this work overviews some recent methods applicable to the verification of dubious content in text and images and discusses how we can put them together as an option to curb away the proliferation of unverified and phony “facts”. We briefly present the main idea behind each method, highlighting real situations where they can be applied and discussing expected results. Ultimately, we show how new research areas are working to seamlessly stitch together all these methods so as to provide a unified analysis and to establish the synchronization in space and time — the X-Coherence — of heterogeneous sources of information documenting real-world events. Keywords: Digital Forensics, Fake News, Visual Analysis, Semantic Analysis, XCoherence, DéjàVu.
1 Introduction In a scenario where fake news is in every corner trying to convince readership that the most unlikely fact is an authentic truth, it is really difficult to tell apart genuine and phony facts. Cases such as the 2016 USA presidential election, when communication vehicles (from social to mainstream media) overwhelmed people with an astonishing amount of fake news stories, are a red alert to collateral damages caused by this kind of behavior. In a work focused on the 2016 USA elections, Allcott and Gentzkow (2017) indicated that a number of commentators suggested Donald Trump would not have been elected president were it not for the influence of fake news. This statement is based on a very specific series of facts: (1) 62% US adults get news from social media; (2) the most popular fake news stories were more widely shared on Facebook than the most popular mainstream news ∗
[email protected]
1
stories; (3) many people who see fake news stories report they believe them; and (4) the most discussed fake news stories tended to favor Donald Trump over Hillary Clinton. In Brazil, according to Biller (2018), the combination of political polarization and passion for social media offers fertile ground for fake news in the run-up to the 2018 general elections, leading to results that could set the Brazilian society on a backward path or even favor the appearance of Fascist movements. Furthermore, the broadcast of sensitive content, mainly pornographic, through the Internet is as dangerous as fake news. The situation is further complicated when fake news meets pornographic content and both become entangled. If 2016 was the year of “posttruth”1 — further consolidated in 2017 as the year of fake news — this year will probably be the year of DeepFakes (Morris, 2018). This new form of content falsification makes use of deep learning algorithms (from the Artificial Intelligence field) to produce convincing face-swapping videos, in particular for replacing — in movie sequences — faces of porn stars with mainstream celebrities. Although the term is new, it is swiftly spreading out most likely propelled by a user-friendly and controversial (Farokhmanesh, 2018) application called FakeApp, which allows anyone to create this kind of fake videos effortlessly. But how can we fight back situations involving the broadcast of fake news? In recent years, scientists have been developing research in the field of Digital Forensics to prevent or to aid the investigation of such problems. Differently from the Information Security field, whose focus in on aspects concerning system’s violation and unauthorized system access, Digital Forensics targets the development and deployment of methods for digital document analysis (images, videos, audio, and text), in order to evaluate, among other aspects, their authenticity. Aiming at discussing possible ways of facing the aforementioned problems, this work brings an overview of recent research in an effort to combat fake news. We start with a discussion targeting document (Section 2), image (Section 2.1) and text analysis (Section 2.2). We then move to the study of methods for video verification (Section 2.3), and textual authorship detection (Section 2.4). As we evolve in the presentation of ideas, we examine the rationale behind each method, highlight real situations where it could be applied, and discuss expected results. For more complex cases, when it is necessary to understand how a set of transformed images are related to each other, we review the image phylogeny framework (Section 3) setting the stage for the final part of the paper. Ultimately, we show how new research areas are working to provide more than a basal disjoint source analysis for a given situation, allowing the synchronization, in space and time (the X-Coherence), of heterogeneous sources documenting and describing real-world events, leading to a thorough understanding of facts (Section 4).
2 Methods for Document Analysis Social media platforms, such as Facebook, Twitter, and Instagram, have been revolutionizing the way people communicate with each other. They are designed to enable users to interact, collaborate, and share anything they want in the process of creating as well as consuming content (Obar and Wildman, 2015). Notwithstanding, users of these engaging platforms can easily, sometimes inadvertently, consume and broadcast dubious and sensitive content, establishing grounds for fake news proliferation. 1
According to the Oxford Dictionary, it refers to “circumstances in which objective facts are less influential in shaping public opinion than appeals to emotion and personal belief”.
2
In this complex and fast-paced setup, how to discern between pristine and fake content? How to evaluate whether certain pieces of text, images, and videos are factual? Computational methods covered in this section can aid the task in different ways. Sections 2.1 and 2.2 present literature related to the authenticity evaluation of digital images and printed text. By taking content semantics into consideration, the methods described in Sections 2.3 and 2.4 are able to, respectively, detect fake videos and associate textual authorship.
2.1 Fake image detection When analyzing suspicious documents, a suitable starting point is to evaluate the authenticity of images therein. In the digital era, images are particularly easy to manipulate using commonplace image editing software suites, such as Adobe Photoshop and Gimp, leading to an astonishing number of fake images reaching us everyday through the Internet. Moreover, some studies (Nightingale et al., 2017; Schetinger et al., 2017) suggest that human beings are notably limited in the task of distinguishing original and manipulated images, even when presented with photometric or geometric inconsistencies. Image forgery can be classified roughly into two main groups: image splicing, which refers to situations in which parts of two or more images are used to compose a new one depicting an event that never happened, as shown in Figure 1(a); and copy-paste, which takes place when parts of the image itself are replicated (often with modifications) to hide content in the same image or to increase/decrease the important of a specific aspect, as shown in Figure 1(b).
Host Image
Alien Image
Input Image
Duplicate Region Selection
Image Splicing
Alien Part Adjustments
Copy-Paste Image
Duplicate Region Adjustment
(a) Image splicing.
(b) Copy-paste.
Figura 1 – Simplified scheme of the image forgery process: (a) image splicing creation, and (b) copy-paste image creation. To detect such forgeries, experts look for traces of inconsistencies in different properties, such as illumination, compression, and noise. However, according to Rocha et al. (2011), illumination inconsistencies are potentially effective, mainly when dealing with image splicing: from the viewpoint of a manipulator, proper adjustment of the illumination conditions is hard to achieve when creating a composite image. Considering techniques that deal with illumination inconsistencies, we can highlight two categories: (1) methods based on the light setting, which aims at finding inconsistencies in the light source position, and (2) methods based on light color, which look for 3
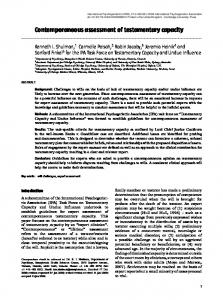
inconsistencies in the color of illuminants of the scene. In a very simplistic form of putting it, the former group analyzes where is the source of illumination of a photograph while the latter investigates how objects are illuminated according to a given light source. Methods based on the light setting are useful when evaluating the authenticity of outdoor images. One example where such methods could be applied is depicted in Figure 2, in which Marilyn Monroe and Elizabeth Taylor are side-by-side. This fake image, which circulated in social media in 2017, is the result of a composition (splicing) of at least two different photographs.
Figura 2 – Example of image splicing, which circulated in social media in 2017. The left figure is the result of an image splicing while the right one shows the host image used to construct the forged one. Source: Gizmodo (Novak, 2017a). The method proposed by Carvalho et al. (2015) is appropriate to analyze this kind of image. It is based in the concept of normal vectors, often simply named as “normals”, which are vectors perpendicular to a surface at a given point. Given some user intervention to mark points in the suspected region, approximately corresponding to normal vectors, the method uses the normal vectors’ direction and illumination at the chosen marks to estimate the light source position for the object. However, even a knowledgeable forensic expert is not 100% precise in the task of setting up normal marks. A proposed workaround is to estimate the light source position several times, always with a random and small distortion in the original normals, to find not a single position, but a region with a certain degree of confidence. In this case, if two or more objects yield inconsistent light source regions (without intersection), as depicted in Figure 3, it is an indicative of an image splicing as it denotes inconsistent light sources. In a simular line of research, Seuffert et al. (2018) also explored 3D light in the fake image detection context. The authors presented a new method that evolves from Kee and Farid (2010) model, which proposed that, under the assumption of Lambertian reflectance, the observed intensity can be represented by second order spherical harmonics. Starting from this previous model, the authors proposed a more stable method for real scenario forensics applications. Using an “intensity binning sphere” (IBS), the intensities are binned by their surface normals, avoiding extrapolation over surface normals without observations. The authors also proposed a new error score, instead of a hard threshold, which is learned from training data, i.e., from face images that are acquired under known lighting. In the second category, techniques that deal with inconsistencies in light color are 4
90
90
Marilyn 45
45
0
0
-45
-45
-90 -180
-90 -135-180
Elizabeth
-90 -135
-45 -90
0 -45
45
0
90 45
135 90
180 135
180
Figura 3 – Application of the method by Carvalho et al. (2015). Top row, from left to right: input image, normal marks for Marilyn Monroe’s face, normal marks for Elizabeth Taylor’s face. Bottom row: estimated light source regions. The presence of two regions without intersection is an indicative of image splicing / composition.
very useful in more complex setups, often involving not just a single light source. One example where such methods could be applied is depicted in Figure 4, a fake image showing Putin surrounded by other world leaders, which circulated in social media in 2017.
Figura 4 – Example of image splicing, which circulated in social media in 2017. The left figure depicts an image composition while the right one depicts the host image used to construct the fake one. Source: Gizmodo (Novak, 2017b). The method by Carvalho et al. (2016) can be properly applied in this case. It explores image transformed spaces to capture artifacts and pinpoint possible forgeries. Illumination inconsistencies in objects with similar materials (such as human skin) become more pronounced when projecting the fake image onto illuminant maps. An illuminant map is a transformed color space which reproduces the illuminant color (the color of the light that appears to be emitted during the capture) in each region of the image. 5
There are different color constancy methods able to estimate scene illuminants and this work relied upon two of them: a statistical one (Weijer et al., 2007) used to estimate the illuminant from pixels; and a physics-based one (Riess and Angelopoulou, 2010), which is a variant of the original inverse-intensity chromaticity space estimation proposed by Tan et al. (2004) to deal with local illuminant estimation. Illuminant maps can be characterized by different statistical features: texture, color, and shape. Then, for each pair of selected faces in an image, these features are used to train different pattern classifiers, which vote to decide whether or not an image presents traces of illumination inconsistencies. If at least one pair of faces is classified as fake, the method provides a hint that the image may have been manipulated and that the examiner should look for other traces of doctoring. Figure 5 depicts a simplified overview of the method, which classifies an input as being genuine or fake.
GGE
Features Extraction
Classification
Pristine
Features Extraction
Classification
Fake
Features Extraction
Classification
Fake
+
Input Image
IIC
Features Extraction
Classification
Fake
Features Extraction
Classification
Pristine
Features Extraction
Classification
Fake
Fake
Figura 5 – Overview of the method proposed by Carvalho et al. (2016). An image is analyzed by segmenting all suspected faces. Each face is represented in the transformed illuminant space and further characterized through some image description methods such as the ones involving patterns of texture, color, and shape. Then, the descriptors for all pairs of faces in the image are concatenated. Ultimately, a classifier is trained based on the concatenated feature vectors to issue an authenticity decision upon receiving each pair of faces. The method proposed by Huh et al. (2018) takes advantage of the automatically recorded photo EXIF metadata as supervisory signal for training a model to determine whether an image is, or not, produced by image splicing. The authors apply a Siamese network to measure the consistency cij of EXIF metadata attributes between two patches i and j. The Siamese network uses shared ResNet-50 (He et al., 2016) sub-networks, each one producing feature vectors with 4096 dimensions. Such vectors are concatenated and passed through a four-layer neural network with 4096, 2048, 1024 units, followed by the final output layer. Despite the interesting results, mainly on tampering maps generation, scenarios involving compressed test images have not been tested, which is an inconvenient drawback since this kind of operation tends to degrade accuracy. The aforementioned methods are effective when dealing with images generated by 6
image composition/splicing. Nevertheless, when the forgery operation involves just parts of the same image, as in copy-move images, there are more appropriate solutions. Silva et al. (2015) proposed a method tailored for copy-move image forgery detection based on a multi-scale analysis of the input image. The input image is converted into the HSV color space to decrease possible false positive matches of similar regions. Then, the Speeded-Up Robust Features (SURF) algorithm (Bay et al., 2006) is used to detect a set of keypoints (representative regions of orientation change in the image), which are matched against each other. The method always associates keypoints in pairs by using the Nearest Neighbor Distance Ratio (NNDR) policy (Mikolajczyk and Schmid, 2005). The next step consists in clustering keypoints into two groups, based on two specific constraints: (1) spatial proximity between keypoints assigned to the same group; and (2) similarity between the angles of the connection line of keypoints in the same group. The next two steps are, respectively, a Gaussian Pyramidal Decomposition to generate the image’s scale-space, and a multi-scale lexicographical analysis, looking for candidate cloned regions in each scale of the pyramid. Finally, the method performs a voting process through the different pyramidal levels to find the final detection map. An example of the usefulness of such techniques can be found in Figure 6. The image depicts a case which made the news years ago, when Iran was conducting missile tests (Shachtman, 2008). The image is a result of copy-pasting portions of the successful missile launches to the failing ones.
Figura 6 – The Iranian Missile Case (Shachtman, 2008). Patterns of a successful missile launch were replicated to the failing one, a clear case of copy-pasting portions of an image so as to change its meaning. Image credits to Wired Inc. Presenting results comparable to the state-of-the-art methods, but with the drawback of a high complexity implementation framework, Wang et al. (2018) proposed a method based on color invariance model and quaternion polar complex exponential transform (QPCET), for the detection and localization of copy-move forgeries. The proposed method consists of five main steps: (1) extraction of stable color image interest points using a detector composed by the SURF (speeded-up robust features) (Bay et al., 2008) detector and a color invariance model; (2) generation of connected Delaunay triangles based on the extracted interest points; (3) computation of suitable local visual features of the triangle 7
mesh using the quaternion polar complex exponential transform (QPCET); (4) match of triangular meshes by using of local visual features associated with reversed-generalized 2 nearest-neighbor (Rg2NN) and best bin first (BBF); and (5) removal of the falsely matched triangular meshes by random sample consensus. Also focusing on copy-move detection, Mahmood et al. (2018) proposed a technique based on stationary wavelet and discrete cosine transform. The method first converts the input image into Y Cb Cr color space. For features extraction, the authors rely on two main steps: (1) using stationary wavelet transform (SWT), the method decomposes the suspicious image into four sub-bands (approximation, horizontal, vertical and diagonal); (2) it divides the approximation sub-band into overlapping blocks, and uses discrete cosine transform (DCT) to reduce them to six dimensions. This combination of SWT and DCT makes the representation of features more diverse and also appears as a better choice for copy-move detection. Using a lexicographical sorting algorithm, features are sorted and the similarity of close blocks are calculated. As a last step, a morphological opening operation with a structural element is applied over resulting maps for eliminating the falsely detected areas. Aiming to improve the detection of forgery localization in fake images, independent of the forgery process creation (splicing, copy-paste, etc.), Zhou et al. (2018) proposed a method based on a two-stream Faster R-CNN (Ren et al., 2017) network. The first is an RGB stream that uses a ResNet101 network (He et al., 2016) to learn features from the RGB image input, which are feed into a Region Proposal Network (RPN), in order to find tampering artifacts, such as strong contrast difference and unnatural tampered boundaries. In the second, which is a noise stream, the input RGB image goes through a steganalysis rich model (SRM) filter layer to discover the noise inconsistency between authentic and tampered regions. Features from both streams are fused through bilinear pooling to detect manipulation.
2.2 Printed document source detection Although we are living in the digital era, in which we are highly connected through many digital devices, printed paperwork is (still) everywhere. Due to the decreasing costs of printer devices (matrix dot, thermal, ink-jet, or laser printers) and the increasing number of digital documents, it is difficult to ensure the authenticity of printed documents against criminal intentions. Identifying the source of a printed document might prove beneficial in investigations involving forged contractual clauses, threatening letters, illegal correspondence, fake currency and documents, among others. In this vein, it is pivotal to recognize the device signature based on the different characteristics left by its mechanical nuances. Shang et al. (2014) proposed a method to distinguish text documents from laser printer, ink-jet printer, and copier, using features such as noise energy, contour roughness of the character, and average gradient of the character edge region. A SVM classifier is applied for each character and a voting mechanism provides the final result, with a reported 90% accuracy. Similar approaches can be seen in (Joshi and Khanna, 2018; Ferreira et al., 2015; Bertrand et al., ; Tsai and Liu, 2013), where hand-crafted features from characters are extracted and combined for single classification. Although similar, the feature extraction may differ, ensuring some advantages for each technique in different scenarios. Looking for a more general solution, Ferreira et al. (2017) developed a set of tools to analyze and to recognize document ownership based on clues left behind by printer 8
devices using a data-driven approach. In this approach several parallel Convolutional Neural Networks (CNNs) extract meaningful discriminative patterns from the analyzed documents. The method is capable of learning distinctive attribution features directly from available training data, a remarkable advance when compared to prior art. By representing these patterns in different ways, it is possible to better identify printing artifacts based on printed characters and, therefore, enhance the document-printer attribution task.
Figure 7 shows the document attribution pipeline where documents are scanned and characters are identified. The approach is based on the analysis of small patches or regions of the analyzed document, represented by text characters. Multiple representations of the same character are used as complementary features, increasing the overall accuracy. These representations formed by raw data (characters image pixels), media filter CHARACTERIZATION TECHNIQUESareFOR LASER PRINTER ATTRIBUTION residual (subtracting the raw image from the media filtered version provides high frequency imperfections), and average filter residual (subtracting the raw image from the average filtered version isolates border effects). All these three representations are used as input by shallow CNNs, which learn the most relevant discriminant characteristics. The created et al.: DATA-DRIVEN FEATURE CHARACTERIZATION TECHNIQUES FOR LASER PRINTER ATTRIBUTION 1865 feature vectors are concatenated and used as input by a set of linear classifiers, called “early fusion”. This step is represented by the blue region of the figure. The classification results at character level are combined byPRINTER a majority voting mechanism, called “late fusion”, et al.: DATA-DRIVEN FEATURE CHARACTERIZATION TECHNIQUES FOR LASER ATTRIBUTION 1865 represented by the green region of the figure. The final decision-making process states which CHARACTERIZATION TECHNIQUES FOR LASER PRINTER ATTRIBUTION printer, from a set of suspect printers, was used to print the document under investigation. et al.: DATA-DRIVEN FEATURE CHARACTERIZATION TECHNIQUES FOR LASER PRINTER ATTRIBUTION
first convolutional layer operating ues are mapped in grayscale.
Early fusion
Majority voting
…
1865
Feature vector
first convolutional layer operating onvolutional output of the first layer of convolutional the trained network, given an xampleare of filters weights forin the first layer operating ues mapped from an investigated printer. Forgrayscale. each different areas inside wr input image pixels. Weight values are filter, mapped in grayscale. w,thethis the deep network custom-tailored to the borders are first highlighted. yer ofisthe trained network, given an attribution problem. Thelayer used CNN architecture onvolutional output of the first of the trained network, givenhas an xample of filters weights for the first convolutional layer operating or each filter, different areas inside r from an investigated printer. For each filter, different areas inside layers: wwing input image pixels. Weight values are mapped in grayscale.
1865
Late fusion
xample of filters weights for theCHARACTERIZATION first convolutional layer operating FOR LASER PRINTER ATTRIBUTION et al.: DATA-DRIVEN FEATURE TECHNIQUES w input image pixels. Weight values are mapped in grayscale. onvolutional output of the first layer of the trained network, given an r from an investigated printer. For each filter, different areas inside the borders are highlighted. et al.: DATA-DRIVEN FEATURE CHARACTERIZATION TECHNIQUES FOR LASER PRINTER ATTRIBUTION
1865
Feature vector
xample of filters weights for theCHARACTERIZATION first convolutional layer operating FOR LASER PRINTER ATTRIBUTION et al.: DATA-DRIVEN FEATURE TECHNIQUES w input image pixels. Weight values are mapped in grayscale.
Feature vector
Feature vector
xample of filters weights for the first convolutional layer operating w input image pixels. Weight values are mapped in grayscale.
1865
work custom-tailored to the used CNN architecture has
raw image or a different r residual or average filter 28 × 28 images as input. work custom-tailored to the is made of 20 5 × 5 filters used CNN architecture has erlapping max pooling layer
e raw image or a different yer, with 50or filters of filter size r residual average nother max 28 × non-overlapping 28 images as input. and stride 2.
Feature vector
Early fusion
Feature vector
thethis borders are first highlighted. w, is the deep network to the ne input layer, where the raw custom-tailored image or a different attribution problem. The used CNN architecture has presentation (median filter residual or average filter xample of filters weights for the first convolutional layer operating wing layers: sidual) used. requires 28are ×custom-tailored 28 images as input. w input image pixels. Weight values mapped in grayscale. w, this isis the firstItwhere deep network to the ne input layer, the raw or 5a×different onvolutional output of the first layer ofmade theimage trained network, an he first convolutional layer is of 20 5given filters attribution problem. The used CNN architecture has r from an investigated printer. For each filter, different areas inside presentation (median filter residual or average filter dwing is followed by a non-overlapping max pooling layer the borders are highlighted. layers: sidual) is 2used. requires × 28 images as input. size 2× and Itwhere stride 2.the 28 ne input layer, raw or a different Fig. 8. Proposed multiple representations of different data for laser printer onvolutional output of the first layer of theimage trained network, given an hesecond first convolutional layer is made of 20 5 × 5of filters convolutional layer, with 50 filters size attribution presentation (median filter residual or average filter through a set of lightweight Neuralet Networks. Early A r from an investigated printer. For each filter, different areas inside Figura 7 – Document attribution pipeline overview. AdaptedConvolutional from (Ferreira al., 2017). yer of the trained network, given an dthe5is followed by adeep non-overlapping max poolingtolayer w, this isisthe first the and late fusion steps are highlighted in blue and green, respectively. borders arefollowed highlighted. × × 20 isused. bynetwork another non-overlapping max sidual) It requires 28 ×custom-tailored 28 images as input. suspect document is analyzed through a series of non-linear transformations by sizeeach 2 × 2output and stride or filter, different areas inside attribution problem. The used CNN has oling of size 2first ×2.2layer and stride onvolutional of the the trained network, an Fig. 8. Proposed multiple representations of different data for laser printer he firstlayer convolutional layer isofmade of2.architecture 20 5 × 5given filters means of convolutional neuralthrough networks inlightweight order toConvolutional extract distinctive attribution second convolutional layer, with 50 filtersareas size 500 . from an investigated For generates each filter,max different inside attribution a set of Neural Networks. Early layers: nrdwing inner product which a vector ∈ofR is followed bylayer, a printer. non-overlapping pooling layer the borders arefollowed highlighted. w, this is the first deepbynetwork custom-tailored tomax the and late fusion steps are highlighted in blue and green, respectively. patterns. Ultimately, all features are combined for decision-making. × 5 × 20 is another non-overlapping ne input layer, where the raw image or a different hesize 5002 × dimensional is non-linearly processed is considered. These figures show that different filters enhance 2 and stridevector 2. 8. Proposed multiple representations of different data for laser printer attribution problem. CNN2. architecture has Fig. oling layer of(median size 2The ×filter 2 used and stride presentation residual or average different areas of letters, such as texture and borders, which th a ReLU function applied element-wise. second convolutional layer, with 50 filters of filter size attribution through a set of lightweight Convolutional Neural Networks. Early 500 wing layers: . and inner product layer, which generates a vector Rmax sidual) isproduct used. Itlayer requires 28 × 28 images asas∈ input. havelatebeen be important banding for LP fusionshown steps aretohighlighted in blue to anddetect green, respectively. nnne inner acts as classifier with many × 5this × 20 is followed by another non-overlapping w, is the first deep network custom-tailored to the inputconvolutional layer, where the israw image or 5a× different is considered. These figures show that different filters he 500 dimensional vector is non-linearly processed first layer made of 20 5 filters attribution by existing methods in the literature such enhance as [12]. tput confidence scores as the number of printers oling layer of size 2 × 2 and stride 2. attribution problem. The used CNN architecture has 2.3 Fake video and sensitive media detection presentation (median filter residual or average filter different areas of letters, such as texture and borders, which th a ReLU function applied element-wise. d is followed by a non-overlapping max pooling layer 500 ailable during training. nsidual) innerlayers: product layer, which28 generates a vector ∈ R . wing is used. It requires × 28 images as input. have been shown to be important to detect banding for LP nnesize inner product layer acts as classifier with as many 2× 2 layer and where stride 2.theoutputs theindex spreading availability of user-friendly applications to generate fake videos, is figures show that different enhance input layer, raw image or aprocessed different he 500 dimensional vector isWith non-linearly soft-max finally the and the Fig.considered. 8. ProposedThese multiple representations of different datafilters for laser printer he first convolutional layer is made of 20 5 × 5 filters D. Classification With Early and Late Fusion attribution by existing methods in the literature such as [12]. tput confidence scores asofresidual the number of printers second convolutional layer, with 50 of size to attribution some which are used solely generatethrough pornographic content effortlessly (Farokhmanesh, different areas such Convolutional as texture and borders, which presentation (median filter or filters average filter aofsetletters, of lightweight Neural Networks. Early th ReLU applied element-wise. of function the most probable printer. dnfidence isa×followed by a non-overlapping max pooling layer and latebeen fusionshown stepsCNN aretohighlighted in blue and green, respectively. ailable during training. × 5 20 is followed by another non-overlapping max The proposed architecture is characterized by a limited have be important to detect banding for LP sidual) is used. It requires 28 × 28 images as input. nrsize inner product layer acts astrain classifier with as many proposed approach, the network using 2layer × 2 layer and stride 2.2we soft-max finally outputs the index and the oling of size 2 × and stride 2. Fig. 8. Proposed multiple representations of different data for laser printer attribution by existing methods in the literature such as [12]. amount of parameters, in order to allow a fast and relihe first convolutional layer is made of 20 5 × 5 filters tput confidence as training the number of again printers hitecture and thenscores feed layer, the to D.8. Classification Withlightweight Early and Late Fusion 9 a set Proposed multiple representations of different data for second convolutional with 50images filters size 500Fig. attribution through Convolutional Neural Networks. Early nfidence of the most probable printer. . able nady inner product layer, which generates a vector ∈ofR d is trained followed by a non-overlapping max pooling layer training even of with a small number of labeled samples ailable during training. the network, extracting 500-dimensional and late fusion steps are highlighted in blue and green, respectively. × 5 × 20 is followed by another non-overlapping max The proposed CNN is characterized by aenhance limited attribution through aarchitecture setshow of lightweight Convolutional Neural Netw is considered. These figures that different filters he 5002 × dimensional vector is non-linearly processed rsize proposed approach, train the network and stride 2.we available. Small networks, as the one wedata are using, are soft-max finally outputs the index andusing the vectors in2 layer the last but one layer and repeating Fig. 8. Proposed multiple representations of different for laser printer D. Classification With Early and Late Fusion oling layer of size 2 × 2 and stride 2. amount of parameters, in order to allow a fast and relidifferent areas of letters, such as texture and borders, which th a ReLU function applied element-wise. hitecture and then feed the training images again to second convolutional with 50 filters we of used size late fusion steps are highlighted inNetworks. blue and green, respectiv expected to have worse performance withNeural respect to bigger attribution through a set of lightweight Convolutional Early nfidence of the most probable printer. for the testing images. Tolayer, follow the literature, 500and . and inner product layer, which generates a vector ∈ many Rmax able training even with aimportant small number of respectively. labeled samples have been be to detect banding for LP late fusionshown steps areto highlighted in blue and green, nnady inner product layer acts as classifier with as The proposed CNN architecture is characterized by a limited trained the network, extracting 500-dimensional × 5proposed ×as 20 is followed by another non-overlapping and deeper networks typically used in the computer vision rork approach, we train the network using adimensional feature extractor only, transferring the feature is considered. These figures show that different filters enhance he 500 vector is non-linearly processed available. Small networks, as the one we are using, are attribution by existing methods in the literature such as [12]. of [17]. parameters, in orderfortothis allow a we fastpropose and relitput confidence as the number of again printers oling layer ofthen size 2used × 2the andtraining stride 2.images vectors inand the lastscores but one layer and the community To compensate issue, to hitecture feed to amount o another and well classifier for thisrepeating application.
2018) — the so-called deep fakes — it comes the alarming necessity of methods to reliably detect fake videos. Due to the incredibly realistic generated videos, it can be extremely difficult, for humans and computers, to discern between original and synthetic content, which becomes even more challenging when those videos are shared in low resolution, with various compression artifacts. Some recent methods in literature have gained momentum due to the their ability to generate compelling manipulated content, by face reenactment in real-time (Thies et al., 2016), by learning lip-sync from audio (Suwajanakorn et al., 2017), or by animating static images (Averbuch-Elor et al., 2017). Being able to accurately detect such content would aid in ceasing the proliferation of fake news by, for instance, blocking or tagging the manipulated images and videos disseminated in social media. Mainly due to the lack of data (Rössler et al., 2018), which is a requirement for training modern machine learning methods, research in video manipulation detection is rather limited, in opposition to the research scenario discussed for images. The literature focuses on some simple clues, often found in carelessly generated videos, such as insertion and deletion of frames (Gironi et al., 2014; Smith et al., 2017), copy-move manipulations (Bestagini et al., 2013), and green-screen splice (Mullan et al., 2017). The presented scenario indicates that more research is necessary, considering newly proposed datasets (Rössler et al., 2018) which, for instance, enables the study of video compression on the detection task, a problem often overlooked in literature. One research area that might help in this effort is pornography and violence detection, which are common themes in fake news, specially in videos. Such methods could be used, for instance, to tag content prior to the forgery detection. Considering pornography and violence detection, there are some works in the literature targeting broader contexts. Moreira et al. (2016) proposed a detection and localization method for general pornography and violence scenes in videos. In a parallel work, Perez et al. (2017) have a similar solution but using deep-learning techniques. Child pornography is a serious unfolding from general pornography, which only recently has gained proper attention. Automatically distinguishing child pornography from adult pornography and regular everyday images/videos is the main goal of a work conducted by our research group in collaboration with the Brazilian Federal Police and several universities (Vitorino et al., 2018). Based on data-driven strategies, the approach consists of first training CNNs to address different tasks for which there is a massive amount of available training examples, such as general image classification (objects, persons, cars, etc.). Then, through transfer learning techniques, the networks are fine-tuned first to general pornography detection and then further refined for child pornography content detection, outperforming different off-the-shelf solutions.
2.4 Textual authorship detection – Who did it? According to the statistics company Statista,2 Twitter is currently among the most popular social networks worldwide, with some 330 million active users, who are able to read and post short messages, the so-called tweets. In this sea of users and tweets, fans can happily interact with their idols, such as the pop-band Coldplay, or the soccer player Cristiano Ronaldo. However, in the same way images are forged to generate fake news, this technology can also be used for shady purposes. 2
10
In 2015, the New York Times documented the case of a Russian media agency that allegedly ran organized disinformation campaigns on social media using pseudonyms and virtual identities (Chen, 2015). Ruling an office full of media professionals, the agency achieved success in promoting fake news stories, influencing public opinion on politics. Cases such as this one are examples of how online anonymity can encourage less accountability, being powerful triggers for fake news. Early on in 2018, another full-coverage of fake profiles on social media has broken the news. A Times report delved into the social media’s black market in which fake profiles can be bought to boost online popularity (Confessore et al., 2018). Equally alarming are estimates that some 48 million of Twitter’s reported active users are automated accounts seeking to simulate real people, according to the article. The problem of text authorship attribution based on short sequences of text is not new. Sanderson and Guenter (2006) evaluated the usage of word sequence kernels based on words and characters Markov chains. The considered short text varies from 300 to 5,000 words, which is much more than the 140 characters from Twitter. Stamatatos (2009) highlights the difficulties of short text scenarios and its associated challenges. Even considering an accumulative representation, which is considered best when only short text are available, the text length is still a major issue. Focusing on short text from Twitter to identify cybercrime, Layton et al. (2010) adopted the Source-Code Author Profile (SCAP) methodology introducing new preprocessing methods for text of 140 characters or less. Schwartz et al. (2013) described the author’s k-signatures concept, which are formed by character and word n-grams. A new feature was also described, called flexible patterns, to capture fine-grained nuances in the authors style. Looking to identify the author’s style from tweets, Bhargava et al. (2013) blended several syntactical, lexical and tweet specific metrics. These metrics were later evaluated by Overdorf and Greenstadt (2016) in a cross-domain scenario, for which the authors proposed specific feature selection methods. To aid this fight against this lack of accountability in social networks, Rocha et al. (2017) discussed a general framework, which has the advantage of being scalable to a high number of suspects. It is composed of training and testing stages. In the training stage, messages associated with suspects’ accounts are collected from social media and pre-processed in order to remove sparse features, such as numbers, dates, times and URLs, very short messages (only a few characters), and non-English messages, which enforces the consistency required in the subsequent feature extraction step. All features are then combined into feature sets based on the common bag-of-words models (Salton and McGill, 1986). The authors implement different strategies for this step: character-level n-grams, word-level n-grams, part-of-speech n-grams, and diverse lexical and syntactic statistics as features. This form of characterization captures stylistic features of an author (for instance, a tendency for using capital letters over lowercase ones), patterns of use of Emojis and other social media conventions, as well as vocabulary richness and user-specific grammar constructions. In the test stage, feature sets are used to train a classifier, such as Power Mean SVM (Wu, 2012), W-SVM (Scheirer et al., 2014), Random Forests (Breiman, 1996), SCAP (Frantzeskou et al., 2007), and compression-based attribution (Teahan and Harper, 2003). The testing process starts with a message of unknown authorship, which proceeds through the exact same feature extraction process as the training messages. The resulting feature vector is submitted to the pre-trained classifier, which produces a prediction of its authorship. This result points out the most probable suspect from a set of possible ones. 11
Although it represents an important step towards understanding the difficult problem of authorship attribution for very short messages in social networks, this work also highlights the necessity of developing more informative features capable of capturing stylistic nuances of each person in order to achieve a better classification. Figure 8 depicts an overview of the method. Social
Network
?
Social Network
Suspect old
messages
Pre-processing and BoW Feature Generation
Anonymous Anonymous
Message Message
Feature Set (Bag-of-words Vectors - BoW) Features
Set Training
Collect suspects’ old messages
Classifier Training
Messages Pre-processing
Messages
Preprocessing
Training Data
Training
Data
Probable Suspect
Classifier
Preprocessing
and
Feature generation
Model A
Model B
Model C
Probable
Suspect
Classifier
Figura 8 – Overview of the method proposed by Rocha et al. (2017) for authorship attribution of very short messages online. Adapted from (Rocha et al., 2017).
3 Multimedia Phylogeny: Understanding the Interplay of Digital Objects The efficient techniques presented thus far can be applied to specific forgery cases. Taking a wider perspective, more complicated situations can be easily found, involving several doctored images, in which the original (source) image is replicated and a set of transformations is applied to generate new images. Although all images share common characteristics, they might transmit a completely different message. Considering our highly-connected world through social networks and the universal language of images and videos, visual content can go viral into a worldwide scale very rapidly. Understanding the relationship of digital objects and their interplay is at the core of Multimedia Phylogeny, a research area focused on understanding the history and evolution over time of digital objects as a group rather than whether or not isolated objects are authentic. A well-known example of such a problem is “The Situation Room” photo, taken by the White House photographer Pete Souza, on May 1st 2011. It depicts former US President Barack Obama and some officers receiving updates from the operation that aimed at capturing Al Qaeda’s terrorist Osama bin Laden. The image went viral on the Internet with several transformations, such as text overlay, face swap, insertion of new elements, among others (Figure 9). Notwithstanding the fact that the recognition of exactly duplicated images is 12
(a)
(b)
(c)
Figura 9 – “The Situation Room” photo. (a) Source image taken by the White House photographer Pete Souza; (b) A version produced by the Brooklyn-based Hasidic newspaper removing Secretary of State Hillary Clinton and another woman from the photo. Source: (HuffPost, 2011); and (c) A meme depicting the politicians as super heroes. Source: (ENews, 2012).
straightforward, the identification of semantically-similar images (when transformations are applied) and their compositions is a challenging task. Moreover, identifying the source image and the relationship among all images under investigation are paramount to support digital forensic analysis. To aid in this complex analysis, our (and other) research groups have been developing several methods (Dias et al., 2013b; Melloni et al., 2014; Oikawa et al., 2016; Costa et al., 2016) for multimedia phylogeny and provenance integrity over the years. There are countless examples of fake news stories spread either through image modification or simple composition. Many of them have political guise, but they can assume any other vantage point. Some famous examples include: the Iranian missiles case (Nizza and Lyons, 2008) we have discussed before; Brazilian former president Dilma Rousseff’s criminal records (Folha de S.Paulo, 2009); Sarah Palin holding a rifle (Jackson, 2008) right after being nominated a Vice-President candidate for the Republican Party in 2008; President George W. Bush holding a children’s book upside down (Jaffe, 2002); The Pope endorsing Donald Trump for President (Christensen, 2016); and the 2011 Benetton’s online Unhate ad campaign (Pownall, 2015). Still, the list goes on and on and this is just the top of the iceberg. Inspired by the biological process of characteristics inheritance, multimedia phylogeny aims at identifying the relationship between a set of near-duplicate or semanticallysimilar images. Relationships are mapped as an image phylogeny tree (IPT) or forest (IPF), enabling the identification of the temporal sequence of modifications based on an image 13
ancestral lineage and descendants. The IPTs/IPFs are presented by directed acyclic graphs, where arcs are created and weighted using a dissimilarity function. In the work proposed by Dias et al. (2013a), the first step is to identify the images relationship pixel-by-pixel. Thus, relevant points are matched between two images (ancestral/descendant) using SURF (Bay et al., 2008) and RANSAC (Fischler and Bolles, 1987) methods. Normalization and compressing techniques are applied, and a pixel-wise comparison is carried out based an homography matrix and used as a minimum squared [3B2-9] mmu2013030058.3d 31/7/013on11:3 Page 60 error metric. Figure 10 shows an example of this process, which results into the dissimilarity matrix of n near-duplicate images. Based on this matrix, a modified minimum spanning tree algorithm (Dias et al., 2012) constructs the IPT as a second step. The process starts having a forest with n roots and sorting the dissimilarity matrix elements based on their computed dissimilarity values. Different trees are joined according to their sorted order. xi′ h11 h12 h13 xi £ yi′ § = £h21 h22 h23§ £ yi § wi′ h31 h32 h32 wi I1 = Tβ (I2) Image I1
Mapping I2 S I1
Image I2
Figure 1. Image phylogeny tree construction process. To calculate image dissimilarities between a pair of images I1 and I2, we find Figura 10in– both Image mapping process: the(yellow dissimilarity between I1 matrix and robust points of interest images, and for those whichto arecalculate good matches stars), we calculate an images homography
I2 , robust points ofone interest computed. homography matrix calrepresenting the necessary parameters to transform image toare another’s domain.Then, Once wean perform the mapping, we caniscompare both images pixel by pixel within the region of interest overlap. culated to enable the they pixel-by-pixel
comparison and, therefore, the dissimilarity matrix. Adapted from (Dias et al., 2013a).
digital images, but the ideas also apply to vid- I B itself. We can perform such a comparison eos and text. We devise methods for dealing using any point-wise method L, such as In real-world the dissimilarity complete set of near-duplicates is often not available, with partiallysetups, constructed matripixel-wise minimum squared error. forcing the ces, technique to actively deal with missing nodes. multiple source images canthe which can request new entries onIn addition, With a set of n near-duplicate images, exist, particularly in splicing/composition cases. In this a forest of IPTs needs tothe the fly. This means that we can start the procefirstscenario, task for creating an IPT is to calculate dure by calculating only a subset of the entries dissimilarity between every pair of such images. be constructed. of the dissimilarity matrix and the methods we For that, we need a reasonable set of possible Thepropose multiple approach is also applicable fortransformations, analyzing evidence will trees take care of finding additional image T , frominvolving which one 8,11 image montages, or a combination of different camera viewpoints. Such extensions entries blending, while optimizing the search in order to image can generate an offspring. are called multiple parenting phylogeny et al., 2016). Going back to “The Situation use as few entries as possible. (Oikawa We perform experiments with11more thanhow 1 million test Room” example, Figure shows the proposed IPT helps in understanding the Building an Image Phylogeny Tree cases and show that our solutions represent a relationship between the related images collected from the Internet and their process of step forward in efficiently and effectively deter- Dias and his colleagues proposed an approach evolution from the very original photograph taken by White House photographer Pete mining ancestral relationships of digital for calculating image dissimilarities and findSouza. ing IPTs.8 For the dissimilarity calculations, images. the authors define these steps:
Phylogeny Formalization 4 WhatImage Comes Next in Terms of Understanding Real-World Events Finding the structure of relationships in a set 1. Find interest points in each pair of images
(using SURF13 ) to estimate warping and
of near-duplicate images normally requires Criminal activities evolve and adapt quickly, being fake news particularly on the cropping parameters robustly using two steps: a dissimilarity function d responsi14 spotlight, evincing the necessity of effective tools to help us answer the four most important RANSAC. ble for calculating how different each pair of aspects of images an event: “who”, “in itwhat circumstances”, “why”, and “how”. The covered is and how likely is they are parent 2. Calculate pixel color normalization techniques and in this article are pinnacle examples of research aiming at answering oneparamor child on the tree and a tree reconstruction eters by mapping the color channels of one algorithm that However, operates on this matrix. more of these questions. a much richerAn “bird’s eye view” of an event is pivotal to image onto the color channels of the other image phylogeny final product anan image fully understand the nuances and detailsis of event. phylogeny tree (IPT), which connects images
image.
There are only few projects currently studying how real-world events can be according to a their ancestral/descendant
edia
relations.8 Formally, let T!~ be an image transformation from a family T . We can devise a 14 dissimilarity function between two images I A and I B as the minimum dI A ; I B ¼ jI B " T!~ðI A Þjpoint-wise comparison method L
ð1Þ
3. Compress one of the images with the same compression parameters as the other. 4. Uncompress both images and compare them pixel-by-pixel according to the minimum squared error metric.
M. A. Oikawa et al. / Intl. Trans. in Op. Res. 23 (2016) 921–946
942
A. Oikawa al. /Trans. Intl. Trans. Op.23 Res. 23 (2016) 921–946 M. A.M. Oikawa et al. /etIntl. in Op.inRes. (2016) 921–946
942
M. A. Oikawa et al. / Intl. Trans. in Op. Res. 23 (2016) 921–946
942
M.Intl. A. Oikawa al. Res. / Intl. in921–946 Op. Res. 23 (2016) 921–946 . A. Oikawa et al. / Trans. inetOp. 23Trans. (2016)
M. A. Oikawa et al. / Intl. Trans. 942 in Op. Res. 23 (2016) 921–946 M. A. Oikawa et al. / Intl. Trans. in Op. Res. 23 (2016) 921–946
942
942
M. A. Oikawa et al. / Intl. Trans. in Op. Res. 23 (2016) 921–946
Image Near Duplicates
942
A
White House version
C
Phylogeny Tree B
M. A. Oikawa et al. / Intl. Trans. in Op. Res. 23 (2016) 921–946
Balotelli
A
T ~ (A)
T ~ (A)
Fig. The 12. Reconstruction Fig. 12. Reconstruction of the image phylogeny treeimage of images collected the Internet portraying The Situation Fig. 12. Reconstruction of the phylogeny treefrom of images collected from the Internet portraying Situation T ~ (A) of the image phylogeny tree of images collected from the Internet portrayin Room episode. This IPT was reconstructed using E-AOB method. Room episode. This IPT was reconstructed using method.using E-AOB method. Room episode. This IPT wasE-AOB reconstructed D
Face swapping
B
?
6.1. Datasets and source code and source code 6.1. Datasets Watermarking
D
F
6.1. Datasets and source code
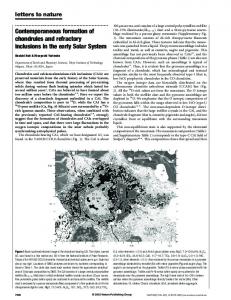
All test cases and the source code of the methods developed in multimedia phylo All test cases and the of the methods in multimedia phylogeny are freely struction of the image phylogeny tree of 12. images collected fromofthe Internet portraying The Situation Fig. Reconstruction the image phylogeny treethe of images collected from themethods Internet portraying The Situation All testsource cases code and source code developed of the developed in multimedia phylogeny are freely T ~ (D) Room episode. This IPT was reconstructed using The E-AOB method. The from datasets are registered atSituation http://dx.doi.org/10.6084/m9.figshare.101 12. Reconstruction of the image phylogeny tree ofavailable. images collected the Internet portraying The available. datasets are registered at are http://dx.doi.org/10.6084/m9.figshare.1012816, and can Room episode. This IPT was reconstructed using E-AOB method. E F datasets available. The registered at Fig. http://dx.doi.org/10.6084/m9.figshare.1012816, and can Fig. 12. Reconstruction of the image phylogeny of images collected from the Internet portraying The Situation Fig. 12. Reconstruction the image tree oftree images from the Internet portraying The Situation Room episode. This IPTcode wasphylogeny reconstructed using E-AOBcollected method. also be downloaded http://www.recod.ic.unicamp.br/!oikawa/datasets.html. T also be downloaded at http://www.recod.ic.unicamp.br/!oikawa/datasets.html. Theofsource Tat ~ (D) Room episode. This IPT was reconstructed using E-AOB method. also be downloaded at http://www.recod.ic.unicamp.br/!oikawa/datasets.html. The source code Room episode. is This IPT was in reconstructed using E-AOB available a public repository at method. http://repo.recod.ic.unicamp.br/public/projec
is available in a public repository at http://repo.recod.ic.unicamp.br/public/projects. nd source code is available in a public repository at http://repo.recod.ic.unicamp.br/public/projects. 6.1. Datasets and source code 6.1. Datasets and source code C Joystick Hats T ~ (B) 6.1. Datasets and source G 6.1. Datasets andare source code code and thephylogeny source code ofphylogeny thecollected methods developed infrom multimedia phylogeny are freely Reconstruction of the image treefrom ofcases images collected the The Internet portraying The Situation e image tree of images the Internet portraying Situation All test and the source code of the methods developed inAll multimedia phylogeny freely test cases and the source code of the methods developed 7. Open issues in multimedia phylogeny are freely 7. Open issues datasets are IPT registered atThis http://dx.doi.org/10.6084/m9.figshare.1012816, and can Room episode. IPTusing was reconstructed using E-AOB method. m episode. This was reconstructed E-AOB method. available. The datasets are registered at http://dx.doi.org/10.6084/m9.figshare.1012816, and can 7. Open issues All test cases andsource theatsource ofmethods the methods developed in multimedia phylogeny are freely available. datasets are registered http://dx.doi.org/10.6084/m9.figshare.1012816, and can G AllThe test cases and the code code of the developed in multimedia phylogeny are freely aded at http://www.recod.ic.unicamp.br/!oikawa/datasets.html. The source code also be downloaded at http://www.recod.ic.unicamp.br/!oikawa/datasets.html. The source code are also bedeveloped downloaded atimages, http://www.recod.ic.unicamp.br/!oikawa/datasets.html. available. The datasets registered at http://dx.doi.org/10.6084/m9.figshare.1012816, and In multimedia phylogeny, most ofThe thesource work code has been mainly In multimedia phylogeny, most of the work has been mainly for butare other types public repository at http://repo.recod.ic.unicamp.br/public/projects. available. The datasets registered atfrom http://dx.doi.org/10.6084/m9.figshare.1012816, anddeveloped can can for images, b is available in a public repository at http://repo.recod.ic.unicamp.br/public/projects. E Fig. 12. Reconstruction of the image phylogeny tree of images collected the Internet portraying The Situation ode sets and source code is available in a public repository at http://repo.recod.ic.unicamp.br/public/projects. In multimedia most different of the work has been mainly developed images, but other types important and also create different also be downloaded atfor http://www.recod.ic.unicamp.br/!oikawa/datasets.html. The source of media are equally phylogenetic structures. E of media are equally importantphylogeny, and also create phylogenetic structures. Especially, some also be downloaded The from source codecode Room episode. This IPT at washttp://www.recod.ic.unicamp.br/!oikawa/datasets.html. reconstructed using E-AOB method. Fig. 12. Reconstruction of the image phylogeny tree of images collected the Internet portraying The Sit oftomedia are equally important and also create different phylogenetic structures. Especially, some is available in are a public repository at http://repo.recod.ic.unicamp.br/public/projects. issues to be solved are related to video phylogeny. Not rarely, videos ar issues beare solved are related to video phylogeny. Not rarely, videos created from Text overlay is available in a public repository atimportant http://repo.recod.ic.unicamp.br/public/projects. Room episode. This IPT was reconstructed using E-AOB method. rce code of the methods in important multimedia phylogeny freely ases and the source code developed of the methods developed in multimedia phylogeny are freely important issues be other solvedvideos, are related videothe phylogeny. Not rarely, videostheare created fromof several shots from other videos, which makes the implementat combinations the combinations of several shots to from whichto makes implementation of multiple eThe registered atFig. http://dx.doi.org/10.6084/m9.figshare.1012816, and can datasets are registered at http://dx.doi.org/10.6084/m9.figshare.1012816, andthe can 12. Reconstruction the image phylogenythe treecombinations of images collected from Internet portraying Thevideos, Situation 7.and Open issues 7. Openofissues several shots from other makes the of phylogeny multiple for videos an important problem to be explored. In additio 6.1. Datasets source codewhich parenting phylogeny for videos anof important problem to be explored. In addition, forimplementation a betterparenting p://www.recod.ic.unicamp.br/!oikawa/datasets.html. The code The ownloaded at http://www.recod.ic.unicamp.br/!oikawa/datasets.html. source code Room episode. This IPT wassource reconstructed using E-AOB method. Fig. 12. Reconstruction of the image phylogeny tree of images collected from the Internet portraying The Situation parenting phylogenythefor videos an important toof bea explored. addition, forsource a better performance, instead 6.1.In Datasets and code of evaluating the distances using the entire sequence of a se instead evaluating distances using the entireproblem sequence set of video files, ository at http://repo.recod.ic.unicamp.br/public/projects. 7.using Open issues e in a public repository http://repo.recod.ic.unicamp.br/public/projects. phylogeny, most of theat work has beenperformance, mainly developed for of images, but other Roomtypes episode. This IPT was reconstructed E-AOB method. 7. Open issues Inand multimedia phylogeny, most of the work has beenof developed for images, other types In multimedia phylogeny, performance, most of the work has been mainly developed forsource images, butof other types All test cases the code the methods developed inmainly multimedia arebut freely instead of evaluating the distances using the entire sequence of a set video files, phylogeny qually important and also create different phylogenetic structures. Especially, some ⃝ C different ofdatasets media are equally important and All alsotest create phylogenetic structures. Especially, 2015and The Authors. ⃝ C 2015 The Authors. of media are equally important and also create different phylogenetic structures. Especially, some available. The are registered at http://dx.doi.org/10.6084/m9.figshare.1012816, and can some cases the source code of the methods developed in multimedia phylogeny are 6.1. are Datasets code In multimedia phylogeny, most of the work has been mainly developed for images, butFederation other es to be solved relatedand to source video phylogeny. Not rarely, videos are created from International Transactions in Operational Research 2015 International of Operational Researc ⃝ C Transactions Research 2015 International Federation of Operational Research Societies important issues toare be created solved are related phylogeny. Not mainly rarely,The videos are code created from ⃝ C 2015inThe Authors. In multimedia phylogeny, mosttoofvideo the work has been developed for⃝C images, but other typestypes 6.1. Datasets and source codephylogeny. importantInternational issues to be solved areOperational related to video Not rarely, videos from also be downloaded at http://www.recod.ic.unicamp.br/!oikawa/datasets.html. source available. The datasets are registered at http://dx.doi.org/10.6084/m9.figshare.1012816, a ns of several shots from other videos, which makes the implementation of multiple of media are equally important and also create different phylogenetic structures. Especially, some ssues C combinations the⃝ of several shots from other videos, which makes the implementation of multiple International Transactions in Operational Research 2015ofInternational Federation of Operational Research Societies media areatequally important also create phylogenetic structures. Especially, some iswhich available in a public repository http://repo.recod.ic.unicamp.br/public/projects. the the combinations of several shots from other videos, makes the implementation of multiple also beand downloaded attodifferent http://www.recod.ic.unicamp.br/!oikawa/datasets.html. The sourc All testancases and source to code the methods developed inbetter multimedia phylogeny are freely ogeny for videos important problem be of explored. In addition, for a important issues to be solved are related video phylogeny. Not rarely, videos are created from parenting phylogeny for videos an important problem to be explored. In addition, for a better All test cases and the source code of be the explored. methodsimportant developed in multimedia phylogeny freely issues solved areare related to video phylogeny. Not rarely, videos are created from parenting phylogeny for videos problem Inand addition, fortoa be better is available in a public repository at http://repo.recod.ic.unicamp.br/public/projects. available. The datasets are registered atsequence http://dx.doi.org/10.6084/m9.figshare.1012816, can most phylogeny, ofof theevaluating workmost has been mainly developed forentire images, but other types media of work has been mainly developed foran images, butvideo other types to at nstead thethe distances using the of aimportant set of files, performance, instead of evaluating distances the entire sequence of amakes set of video files, the combinations of the several shots from videos, which the implementation of multiple available. The are registered http://dx.doi.org/10.6084/m9.figshare.1012816, andusing can the combinations of several otherother videos, which makes the implementation of multiple performance, instead of evaluating thedatasets distances using sequence ofcode a set of video files, shots from ortant and also create different phylogenetic structures. Especially, some also be downloaded at http://www.recod.ic.unicamp.br/!oikawa/datasets.html. source are equally important and also create different phylogenetic structures. Especially, some the entire The parenting phylogeny for videos an important problem to be explored. In addition, a better also be downloaded at http://www.recod.ic.unicamp.br/!oikawa/datasets.html. The source code parenting phylogeny for videos an important problem to be explored. In addition, for afor better ⃝ C 2015 The Authors. are to related to video phylogeny. Not rarely, videos are created from 7. Open issues is available a⃝public repository at http://repo.recod.ic.unicamp.br/public/projects. ts.ved issues be solved areinrelated to video phylogeny. Not rarely, videos are created from is availableResearch in a public repository at http://repo.recod.ic.unicamp.br/public/projects. performance, instead of ⃝Cevaluating the Federation distances using theResearch entire sequence of aof setvideo of video files, 2015International The Authors. International Transactions in Operational Research 2015 International of Operational Societies ⃝ C C2015 actions Operational Research Federation of Operational performance, instead of evaluating the distances using the entire sequence of a set files, al shotsin from othershots videos, which makes thewhich implementation of multiple ⃝Societies inations of several from other videos, makes the implementation of multiple 7. Open issues International Transactions in Operational Research C 2015 International Federation of Operational Research Societies videos an important to be explored. In be addition, for In a better phylogeny for videosproblem an important problem to explored. addition, for a better In multimedia phylogeny, ⃝ most of the work has been mainly developed for images, but other types C 2015 The Authors. ⃝ C 2015 The Authors. valuating theofdistances using entire using sequence a setsequence of videooffiles, ⃝ C 2015 nce, instead evaluating the the distances the of entire a set of video files, International Transactions in Operational Research International of Operational Research Societiesfor images, but othe of media are equallyInternational important and also create different phylogenetic structures. Especially, some In multimedia phylogeny, most of theFederation work has been Research mainly developed ⃝ C 2015 International 7. Open issues Transactions in Operational Research Federation of Operational Societies 7. Open issues important issues to be solved are related to video phylogeny. Not rarely, videos and are created fromdifferent phylogenetic structures. Especially of media are equally important also create Authors. ⃝ C 2015 International ⃝ theofcombinations of other several shots from for other videos, makes thebeimplementation of multiple rational Research Federation of Operational Societies Research In multimedia phylogeny, most the images, work hasbut been mainly developed images, butwhich otherissues types to C 2015 International l Transactions in Operational Research of Operational Societies important solved are related to video phylogeny. Not rarely, videos are create In multimedia phylogeny, most ofFederation theResearch work has been mainly developed for types parenting for videos an important problem to be explored. In addition, forother a better mediadifferent are equally important and alsophylogeny create different phylogenetic structures. Especially, some the combinations of several shots from videos, which makes the implementation of m of media are equally important and alsoofcreate phylogenetic structures. Especially, some important issues to be solvedperformance, are related to instead video phylogeny. Not rarely, videosparenting are created from sequence of evaluating the distances using thephylogeny entire of a set video files,problem to be explored. In addition, for a for videos an ofimportant important issues to be solved are relatedthetocombinations video phylogeny. Not rarely, videos are created from of several shots from other videos, which makes the implementation of multiple performance, instead of evaluating the distances using the entire sequence of a set of vide the combinations of several shots from other videos, which makes the implementation of multiple ⃝ C 2015 The Authors. problem parenting phylogeny for videos an important to be explored. In addition, for a better ⃝ C 2015 International Federation of Operational Research Societies International Transactions in Operational Research parenting phylogeny for videos an important problem to be In addition, for athe better performance, instead of explored. evaluating the distances using entire sequence of a⃝ set of video files, C 2015 The Authors. performance, instead of evaluating the distances using the entire sequence of a set of video files, C 2015 International Federation of Operational Research Societie International Transactions in Operational Research ⃝
Figura 11 – IPT construction example using images collected from the Internet about “The Situation Room” episode. Adapted from Oikawa et al. 2016.
represented and understood as a whole from media content in which is immersed a sea of fake news. Two of these projects – DéjàVu (Rocha, 2017) and Forensic Architecture (Weizman et al., 2014) – can be highlighted, due to their heterogeneity regarding the representation and tools considered to tackle the problem.
The recently launched DéjàVu project (Rocha, 2017) focuses on synchronizing, 2015 The Authors. in space and time, all inmultimedia collected from a target event, enabling International Transactions Operational Research 2015 information International Federation of Operational Research Societies 2015 The Authors. International Transactions in Operational Research 2015 International Federation of Operational Research Societies fact-checking and mining persons, objects, and contents of interest. This process of synchronization is referred to as X-coherence. Such multimedia information may come from varying heterogeneous sources, such as social media, the Internet, and surveillance cameras. The synchronization allows us to better understand an event by virtually reconstructing it — the before, during, and aftermath. Once we can move through the reconstructed event, we have a higher chance of answering the important forensic questions mentioned before, likely providing irrefutable evidence to what really happened. ⃝ C
⃝ C
⃝ C
⃝ C
With the X-coherence, which refers to feature-space-time coherence, it is possible to find physical (e.g., where something happed), temporal (e.g., when it took place), and feature (e.g., creating a transformed and unified feature space so as to allow content discovery and pattern understanding) relations. It can be seen as a natural evolution of the traditional multimedia phylogeny solutions discussed in Section 3, in particular of the multiple parenting phylogeny and the ultimate integration of all forensic analysis pieces previously discussed in Section 2. In order to hint at the X-coherence strength, Lameri et al. (2014) analyzed a pool of videos related to specific events, first focusing on the reconstruction of longer parent sequences describing the event itself. By mainly focusing on the Boston Marathon Bombing event (New York Times, 2013), where two bombs went off near the marathon finish line, the proposed technique was capable of reconstructing longer sequences of videos (at times complementing the smaller ones) associated with the event. Considering the social impact of this event and, therefore, the flood of data produced by social and mainstream media, it was possible to provide the right chronological sequence, joining assorted multimedia materials 15
in order to support, among other aspects, suspect identification and event understanding, which is one of the goals of the X-coherence synchronization.3 Forensic Architecture (Weizman et al., 2014), on the other hand, is a project and multidisciplinary research group which considers architectural techniques to investigate cases of human rights violation around the world. It aims at producing and presenting architectural evidence in contemporary conflicts. By analyzing shared media, they are able to model dynamic events as they unfold in space and time, by creating navigable 3D models and interactive cartographies of sites of conflicts. These techniques allows the presentation of the events in an accountable manner, also generating new insights. An example of their work is the Grenfell Tower fire examination,4 which aims at facilitating the investigation of an unprecedent fire that destroyed the Grenfell Tower in London. The event was captured live by thousands of cameras and smartphones, which together can provide evidence and unique information about the event. The final goal is to construct a continuous ‘3D video’ of the fire, mapped onto an architectural model of the Grenfell Tower. Another remarkable example of their work on X-coherence is now known as the Black Friday Reconstruction, which is a collaboration between Forensic Architecture and Amnesty International aiming to provide a detailed reconstruction of events Israel bombing and attacks in Rafah, Gaza, from 1 through 4 August 2014, based primarily on material found on social media. As the investigation team did not have ground access to Gaza, they have developed a number of techniques aimed to reconstruct the events from hundreds of images and videos recorded by professional and citizen journalists. The images were thereafter located in a 3D model of Rafah. This resulted in the Image Complex, a solution capable of allowing exploration of spatial and and temporal connections of different sources and reconstruct events as they happened5 . People all over the world use their mobile devices to capture and share all sorts of events they are witnessing, and, at the same time, a profusion of manipulated versions of this data are propagated through the same channels. DéjàVu and Forensic Architecture projects are pioneers in taking advantage of this scenario in order to facilitate the solution of real and virtual crimes, in the pursuit of accountability. It enables the aggregation of significant forensic solutions and the design and development of novel methods to analyze interactions between heterogeneous sources, targeting the prevention and investigation of crimes, while also fighting back fake news proliferation. This is certainly a significant step forward in the process of understanding the world around us, taking full advantage of myriad of sources registering what is happening around the world.
Acknowledgements The research for this paper was financially supported by the São Paulo Research Foundation, Fapesp (DéjàVu Grant #2017/12646-3), FAPESP (grant # 2017/12631-6), the Coordination for the Improvement of Higher Education Personnel, Capes, through the DeepEyes grant; and the National Council for Scientific and Technological Development, CNPq (Grant #304472/2015-8, #423797/2016-6). 3
4 5
A video demonstrating the technique is available at and more information about the project can be found at . http://www.forensic-architecture.org/case/grenfell-tower-fire/
16
References
ALLCOTT, H.; GENTZKOW, M. Social media and fake news in the 2016 election. Journal of Economic Perspectives, v. 31, n. 2, p. 211–236, 2017. Cited on page 1. AVERBUCH-ELOR, H. et al. Bringing portraits to life. ACM Transactions on Graphics (TOG), v. 36, n. 6, p. 196, 2017. Cited on page 10. BAY, H. et al. Speeded-up robust features (SURF). Computer Cision and Image Understanding, v. 110, n. 3, p. 346–359, 2008. Cited on pages 7 and 13. BAY, H.; TUYTELAARS, T.; GOOL, L. V. Surf: Speeded up robust features. In: LEONARDIS, A.; BISCHOF, H.; PINZ, A. (Ed.). Computer Vision – ECCV 2006. Berlin, Heidelberg: Springer Berlin Heidelberg, 2006. p. 404–417. ISBN 978-3-540-33833-8. Cited on page 7. BERTRAND, R. et al. A system based on intrinsic features for fraudulent document detection. In: International Conference on Document Analysis and Recognition (ICDAR), pages =. Cited on page 8. BESTAGINI, P. et al. Local tampering detection in video sequences. In: International Workshop on Multimedia Signal Processing (MMSP), 2013. p. 488–493. Cited on page 10. BHARGAVA, M.; MEHNDIRATTA, P.; ASAWA, K. Stylometric analysis for authorship attribution on Twitter. In: International Conference on Big Data Analytics, 2013. p. 37–47. Cited on page 11. BILLER, D. Fake News Risks Plaguing Brazil Elections, Top FactCheckers Say. 2018. . Accessed: 2018-01-29. Cited on page 2. BREIMAN, L. Bagging predictors. Machine Learning, v. 24, n. 2, p. 123–140, 1996. Cited on page 11. CARVALHO, T. et al. Illuminant-based transformed spaces for image forensics. IEEE Transactions on Information Forensics and Security, v. 11, n. 4, p. 720–733, 2016. Cited on pages 5 and 6. CARVALHO, T.; FARID, H.; KEE, E. Exposing photo manipulation from user-guided 3-D lighting analysis. In: SPIE Symposium on Electronic Imaging, 2015. Cited on pages 4 and 5. CHEN, A. The Agency. 2015. The New York Times Magazine, . Accessed: 2018-02-05. Cited on page 10. CHRISTENSEN, B. M. No, the Pope Has NOT Endorsed Donald Trump For President. 2016. Hoax-Slayer, . Accessed: 2018-0711. Cited on page 13.
17
CONFESSORE, N. et al. The Follower Factory. 2018. The New York Times, . Cited on page 10. COSTA, F. d. O. et al. Hash-based frame selection for video phylogeny. In: IEEE International Workshop on Information Forensics and Security (WIFS), 2016. p. 1–6. Cited on page 12. DIAS, Z.; GOLDENSTEIN, S.; ROCHA, A. Large-scale image phylogeny: Tracing image ancestral relationships. IEEE Multimedia, v. 20, n. 3, p. 58–70, 2013. Cited on pages 13 and 14. DIAS, Z.; GOLDENSTEIN, S.; ROCHA, A. Toward image phylogeny forests: Automatically recovering semantically similar image relationships. Forensic Science International, v. 231, n. 1–3, p. 178–189, 2013. Cited on page 12. DIAS, Z.; ROCHA, A.; GOLDENSTEIN, S. Image phylogeny by minimal spanning trees. IEEE Transactions on Information Forensics and Security, v. 7, n. 2, p. 774–788, 2012. Cited on page 13. ENews. 2012 Election: Best Political Memes – The situation room. 2012. E News, . Accessed: 2018-02-12. Cited on page 13. FAROKHMANESH, M. Deepfakes are disappearing from parts of the web, but they’re not going away. 2018. The Verge, . Accessed: 2018-02-11. Cited on pages 2 and 9. FERREIRA, A. et al. Data-driven feature characterization techniques for laser printer attribution. IEEE Transactions on Information Forensics and Security, v. 12, n. 8, p. 1860–1873, 2017. Cited on pages 8 and 9. FERREIRA, A. et al. Laser printer attribution: Exploring new features and beyond. Forensic Science International, v. 247, p. 105–125, 2015. Cited on page 8. FISCHLER, M. A.; BOLLES, R. C. Random sample consensus: a paradigm for model fitting with applications to image analysis and automated cartography. In: Readings in Computer Vision, 1987. p. 726–740. Cited on page 13. Folha de S.Paulo. Autenticidade de ficha de Dilma não é provada. 2009. Folha de S.Paulo, . Accessed: 2018-07-11. Cited on page 12. FRANTZESKOU, G. et al. Identifying authorship by byte-level n-grams: The source code author profile (SCAP) method. IJDE, v. 6, n. 1, 2007. Cited on page 11. GIRONI, A. et al. A video forensic technique for detecting frame deletion and insertion. In: IEEE International Conference on Acoustics, Speech and Signal Processing (ICASSP), 2014. p. 6226–6230. Cited on page 10. HE, K. et al. Deep residual learning for image recognition. In: IEEE Conference on Computer Vision and Pattern Recognition (CVPR), 2016. p. 770–778. Cited on pages 6 and 8. 18
HuffPost. Hillary Clinton Removed From Situation Room Photo By Der Tzitung, Hasidic Newspaper (PHOTOS). 2011. HuffPost, . Accessed: 2018-02-12. Cited on page 13. HUH, M. et al. Fighting fake news: Image splice detection via learned self-consistency. arXiv preprint arXiv:1805.04096, p. 1–20, 2018. Cited on page 6. JACKSON, B. Picture of Palin Is a Fake. 2008. FactCheck, . Accessed: 2018-07-11. Cited on page 13. JAFFE, J. Dubya, willya turn the book over? 2002. Wired News, . Accessed: 2018-07-11. Cited on page 13. JOSHI, S.; KHANNA, N. Single classifier-based passive system for source printer classification using local texture features. IEEE Transactions on Information Forensics and Security, v. 13, n. 7, p. 1603–1614, 2018. Cited on page 8. KEE, E.; FARID, H. Exposing digital forgeries from 3-D lighting environments. In: IEEE International Workshop on Information Forensics and Security, 2010. Cited on page 4. LAMERI, S. et al. Who is my parent? Reconstructing video sequences from partially matching shots. In: IEEE International Conference on Image Processing (ICIP), 2014. p. 5342–5346. Cited on page 15. LAYTON, R.; WATTERS, P.; DAZELEY, R. Authorship attribution for Twitter in 140 characters or less. In: Cybercrime and Trustworthy Computing Workshop (CTC), 2010. p. 1–8. Cited on page 11. MAHMOOD, T. et al. A robust technique for copy-move forgery detection and localization in digital images via stationary wavelet and discrete cosine transform. Journal of Visual Communication and Image Representation, v. 53, p. 202–214, 2018. Cited on page 8. MELLONI, A. et al. Image phylogeny through dissimilarity metrics fusion. In: European Workshop on Visual Information Processing (EUVIP), 2014. p. 1–6. Cited on page 12. MIKOLAJCZYK, K.; SCHMID, C. A performance evaluation of local descriptors. IEEE Transactions on Pattern Analysis and Machine Intelligence, v. 27, n. 10, p. 1615–1630, 2005. Cited on page 7. MOREIRA, D. et al. Pornography classification: The hidden clues in video space–time. Forensic Science international, v. 268, p. 46–61, 2016. Cited on page 10. MORRIS, I. Revenge ‘Porn’ Gets Even More Horrifying With Deepfakes. 2018. Forbes, . Accessed: 2018-0207. Cited on page 2. MULLAN, P. et al. Residual-based forensic comparison of video sequences. In: IEEE International Conference on Image Processing (ICIP), 2017. p. 1507–1511. Cited on page 10.
19
New York Times. Boston Marathon Bombings. 2013. The New York Times, . Cited on page 15. NIGHTINGALE, S. J.; WADE, K. A.; WATSON, D. G. Can people identify original and manipulated photos of real-world scenes? Cognitive Research: Principles and Implications, v. 2, n. 30, p. 1–21, 2017. Cited on page 3. NIZZA, M.; LYONS, P. J. In an Iranian image, a missile too many. 2008. The Lede, The New York Times News, . Accessed: 2018-07-11. Cited on page 12. NOVAK, M. 29 Viral Photos and GIFs From 2017 That Were Totally Fake. 2017. Gizmodo, . Accessed: 2018-02-02. Cited on page 4. NOVAK, M. That Viral Photo of Putin and Trump is Totally Fake. 2017. Gizmodo, . Accessed: 2018-02-03. Cited on page 5. OBAR, J. A.; WILDMAN, S. Social media definition and the governance challenge: An introduction to the special issue. Telecommunications Policy, v. 39, n. 9, p. 745–750, 2015. Cited on page 2. OIKAWA, M. A. et al. Manifold learning and spectral clustering for image phylogeny forests. IEEE Transactions on Information Forensics and Security, v. 11, n. 1, p. 5–18, 2016. Cited on pages 12 and 14. OVERDORF, R.; GREENSTADT, R. Blogs, Twitter feeds, and Reddit comments: cross-domain authorship attribution. Proceedings on Privacy Enhancing Technologies, v. 2016, n. 3, p. 155–171, 2016. Cited on page 11. PEREZ, M. et al. Video pornography detection through deep learning techniques and motion information. Neurocomputing, v. 230, p. 279–293, 2017. Cited on page 10. POWNALL, C. The backfiring campaign. In: Managing Online Reputation, 2015. p. 132–140. Cited on page 13. REN, S. et al. Faster R-CNN: Towards real-time object detection with region proposal networks. IEEE Transactions on Pattern Analysis and Machine Intelligence, v. 39, n. 6, p. 1137, 2017. Cited on page 8. RIESS, C.; ANGELOPOULOU, E. Scene illumination as an indicator of image manipulation. In: Information Hiding Workshop, 2010. v. 6387, p. 66–80. Cited on page 6. ROCHA, A. DéjàVu: Feature-Space-Time Coherence from Heterogeneous Data for Media Integrity Analytics and Interpretation of Events. 2017. . Accessed: 2018-07-11. Cited on page 15. ROCHA, A. et al. Vision of the unseen: Current trends and challenges in digital image and video forensics. ACMComputing Surveys (CSUR), v. 43, n. 4, p. 26:1–26:42, 2011. Cited on page 3.
20
ROCHA, A. et al. Authorship attribution for social media forensics. IEEE Transactions on Information Forensics and Security, v. 12, n. 1, p. 5–33, 2017. Cited on pages 11 and 12. RÖSSLER, A. et al. FaceForensics: A large-scale video dataset for forgery detection in human faces. arXiv preprint arXiv:1803.09179, 2018. Cited on page 10. SALTON, G.; MCGILL, M. J. Introduction to Modern Information Retrieval. New York, NY, USA: McGraw-Hill, Inc., 1986. Cited on page 11. SANDERSON, C.; GUENTER, S. Short text authorship attribution via sequence kernels, markov chains and author unmasking: An investigation. In: Conference on Empirical Methods in Natural Language Processing, 2006. p. 482–491. Cited on page 11. SCHEIRER, W. J.; JAIN, L. P.; BOULT, T. E. Probability models for open set recognition. IEEE Transactions on Pattern Analysis and Machine Intelligence, v. 36, n. 11, p. 2317–2324, 2014. Cited on page 11. SCHETINGER, V. et al. Humans are easily fooled by digital images. Computers & Graphics, v. 68, p. 142–151, 2017. Cited on page 3. SCHWARTZ, R. et al. Authorship attribution of micro-messages. In: Conference on Empirical Methods in Natural Language Processing, 2013. p. 1880–1891. Cited on page 11. SEUFFERT, J.; STAMMINGER, M.; RIESS, C. Towards forensic exploitation of 3-D lighting environments in practice. In: SICHERHEIT 2018, 2018. p. 159–169. Cited on page 4. SHACHTMAN, N. Iran Missile Photo Faked. 2008. Wired, . Cited on page 7. SHANG, S.; MEMON, N.; KONG, X. Detecting documents forged by printing and copying. EURASIP Journal on Advances in Signal Processing, v. 2014, n. 1, p. 140, 2014. Cited on page 8. SILVA, E. et al. Going deeper into copy-move forgery detection: Exploring image telltales via multi-scale analysis and voting processes. Journal of Visual Communication and Image Representation, v. 29, p. 16–32, 2015. Cited on page 7. SMITH, E. et al. A C3D-based convolutional neural network for frame dropping detection in a single video shot. In: IEEE Conference on Computer Vision and Pattern Recognition Workshops, 2017. p. 86–94. Cited on page 10. STAMATATOS, E. A survey of modern authorship attribution methods. Journal of the American Society for information Science and Technology, v. 60, n. 3, p. 538–556, 2009. Cited on page 11. SUWAJANAKORN, S.; SEITZ, S. M.; KEMELMACHER-SHLIZERMAN, I. Synthesizing Obama: learning lip sync from audio. ACM Transactions on Graphics (TOG), v. 36, n. 4, p. 95, 2017. Cited on page 10. TAN, R.; NISHINO, K.; IKEUCHI, K. Color constancy through inverse-intensity chromaticity space. Journal of the Optical Society of America A, v. 21, p. 321–334, 2004. Cited on page 6.
21
TEAHAN, W. J.; HARPER, D. J. Using compression-based language models for text categorization. In: . Language Modeling for Information Retrieval, 2003. p. 141–165. Cited on page 11. THIES, J. et al. Face2Face: Real-time face capture and reenactment of RGB videos. In: IEEE Conference on Computer Vision and Pattern Recognition, 2016. p. 2387–2395. Cited on page 9. TSAI, M.-J.; LIU, J. Digital forensics for printed source identification. In: IEEE International Symposium on Circuits and Systems (ISCAS), 2013. p. 2347–2350. Cited on page 8. VITORINO, P. et al. Leveraging deep neural networks to fight child pornography in the age of social media. Journal of Visual Communication and Image Representation, v. 50, p. 303–313, 2018. Cited on page 10. WANG, X.-Y. et al. A new keypoint-based copy-move forgery detection for color image. Applied Intelligence, 2018. Cited on page 7. WEIJER, J. van de; GEVERS, T.; GIJSENIJ, A. Edge-based color constancy. IEEE Transactions on Image Processing, v. 16, n. 9, p. 2207–2214, 2007. Cited on page 6. WEIZMAN, E. et al. Forensis: The architecture of public truth: Sternberg, 2014. Cited on page 15. WU, J. Power mean SVM for large scale visual classification. In: IEEE Conference on Computer Vision and Pattern Recognition (CVPR), 2012. p. 2344–2351. Cited on page 11. ZHOU, P. et al. Learning rich features for image manipulation detection. In: IEEE Conference on Computer Vision and Pattern Recognition (CVPR), 2018. Cited on page 8.
22