Ocean Science Journal (2009) 44(1):35-42 DOI 10.1007/s12601-009-0005-4
Article http://www.springer.com/12601
Coupled Patterns Between Fields of Dynamic Height and Bottom Pressure in the Japan/East Sea Yongsheng Xu1*, D. Randolph Watts2, and Mark Wimbush2 1
College of Marine Science, University of South Florida, Saint Petersburg, FL 33701, USA Graduate School of Oceanography, University of Rhode Island, 215 South Ferry Road, Narragansett, RI 02882-1197, USA
2
Received 24 March 2008; Revised 19 Ocotber 2008; Accepted 18 March 2009 © KSO, KORDI and Springer 2009
Abstract − Vertical coupling between shallow and deep mesoscale eddy processes in the southwestern Japan/East Sea is investigated using acoustic travel-time and bottom pressure measurements from a two-year deployment of an array of pressure-gauge-equipped inverted echo sounders. Canonical correlation analysis is applied to the simultaneously measured data to extract the coupled modes. The upper layer exhibits a migration of the Ulleung Warm Eddy, and correspondingly the deep potential vorticity in the Ulleung Basin adjusts in magnitude and sense to conserve potential vorticity. Coupling between meanders of strong upper currents and abyssal flows has been observed previously in the Gulf Stream during the Synoptic Ocean Prediction experiment. The evidence from our study strongly suggests that such coupling occurs also under much weaker flows. Key words − vertical coupling, mesoscale eddies, bottom pressure, acoustic travel time, dynamic height
1. Introduction The Japan/East Sea (JES) is a semi-enclosed deep marginal sea of the northwestern Pacific surrounded by Korea, Japan, and Russia. The Ulleung Basin (UB) in the southwestern JES is characterized by a central depression deeper than 2000 m with an irregular peripheral topography, and along its northern edge the Korea Plateau (KP) is 10001500 m in depth. The anticyclonic Ulleung Eddy is perhaps the best known eddy feature in the southwestern JES. The Subpolar Front (SF), a thermal boundary between warm southern and cold subarctic waters, begins in the northwestern corner of the Ulleung Basin. The bottom water within the Ulleung Basin, which enters through the *Corresponding author. E-mail:
[email protected]
Ulleung Interplain Gap from the northeast, circulates cyclonically. As part of this cyclonic circulation, the deep flow along the steep slope off Korea is strongly to the south (Teague et al. 2005; Xu et al. 2003). Although circulation and currents in the southwestern JES have been extensively investigated from measurements made in the past decade (Chang et al. 2004), the co-variation of upper and deep circulations in this region has not been previously reported. Theoretically, vertical coupling can occur through potential vorticity (PV) conservation when the deep layer is squeezed or stretched by the thermocline. Investigation of vertical coupling in the ocean can contribute to understanding both abyssal circulation (and mixing) and upper-layer dynamical events. The formation of a deep eddy beneath a moving upper eddy has been investigated in a number of numericalmodel studies (Cushman-Roisin et al. 1990; Frolov et al. 2004; Indest 1992; Sutyrin et al. 2003; Sturges et al. 1993; Welsh and Inoue 2000). Several numerical-model studies have suggested that deep flow can be intensified by interaction with upper eddies (Hallberg 1997; Thompson 1995). Furthermore, bottom topography can steer upper-ocean currents and regulate the strength and location of flow instabilities (Hogan and Hurlburt 2000). Although oceanic vertical coupling has been simulated in many numerical studies, observational evidence of vertical coupling is rare. One reason is that a specially designed experiment is required that can simultaneously measure upper and deep mesoscale circulation patterns in order to observe the vertical coupling. Another possible reason is that variability due to vertical coupling in many areas of the
36
Xu, Y. et al.
ocean is weaker than other dynamical processes. This makes the vertical coupling difficult to observe from directly measured fields. A primary scientific result of the Synoptic Ocean Prediction experiment (SYNOP) was vivid evidence of coupling events between the Gulf Stream and the underlying water column near 68 W. The spin-up of the deep flow field occurred during the passage of steep meander crests and troughs of the Gulf Stream (Watts et al. 2001). The southwestern JES has much weaker flow than that in the SYNOP region. Moreover the JES topography, with a steep depression and plateau, creates closed PV contours in those subregions, which can have a profound effect on currents driven by vertical coupling. A SYNOP-like experiment was performed in the southwestern JES to understand the physics of the mesoscale circulation. One major goal of the experiment was to investigate vertical coupling in this region. Although meanders and eddy evolution events are present in the observations, looking directly at daily maps of upper- and deep-layer stream functions does not reveal clear evidence of vertical coupling. When vertical interaction is masked by other dynamic processes, statistical methods must be employed to extract the coupled signals. In this work, we apply Canonical Correlation Analysis (CCA) to retrieve coupled modes from the simultaneously measured dynamic height and bottom pressure fields. We also add the time mean field back to the CCA anomaly mode for better visualization of the dynamical processes associated with the mode. o
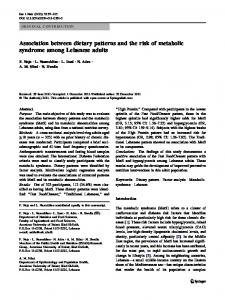
2. Data and Methods Instruments We deployed an array of twenty-five pressure-sensorequipped inverted echo sounders (PIESs) in the southwestern JES (Fig. 1) for two years, from June 1999 to July 2001. A PIES measures vertical acoustic travel time (τ) with 1.6 ms accuracy and 0.05 ms resolution, abyssal pressure (P) with 0.1–0.3 dbar accuracy and 0.001 dbar resolution, and temperature (used to correct the Digiquartz pressure sensor’s temperature sensitivity) with 0.15 C accuracy and 0.0007 C resolution. All measurements were recorded hourly. Seventeen Aanderaa Recording Current Meter 8 (RCM8) moorings were concurrently deployed at approximately the midpoints between the PIES sites. Eleven were maintained by the University of Rhode Island (URI), four by the Korean Ocean Research and Development Institute (KORDI), and o
o
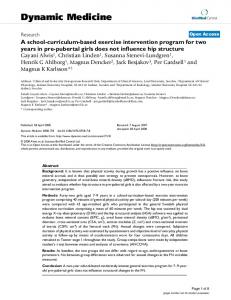
Fig. 1. Array of instruments deployed in the southwestern JES. Yellow diamonds indicate sites of inverted echo sounders equipped with bottom pressure gauges (PIES). Magenta circles indicate deep current meter mooring sites. Site names are prefaced by either “P” or “M” to indicate the instrument type. The naming convention is such that the first number indicates the row and the second value the position relative to the Korean coast. “K” and “J” indicate the moorings maintained by Korean and Japanese scientists, respectively. TOPEX/POSEIDON sub-orbital ground tracks are shown. KP, UB and UIG represent Korea Plateau, Ulleung Interplain Gap and Ulleung Basin, respectively.
one by the Research Institute of Applied Mechanics (RIAM) of Kyushu University. On each mooring there was an RCM8 positioned about 25 m above the bottom, high enough that it should be above the benthic boundary layer. The URI and RIAM data were recorded at one-hour intervals while the KORDI data were recorded at half-hour intervals. Additional current meters were installed at shallower depths on the KORDI mooring EC1 (KM2-3) (Chang et al. 2002). One PIES at P4-1 was lost, and P1-5 measured acoustic travel time for only two months. Thus, we use 23 data sets of τ and 24 datasets of P in this study. Data All the τ data were despiked before five-day low-pass filtering was applied to both τ and P records to focus on geostrophic signals. Then, the records were subsampled daily from 18 June 1999 to 20 June 2001. τ is an integral
37
Coupled patterns between fields of dynamic height and bottom pressure
quantity that depends on the sound-velocity (and hence density) profile. In a water column with more than a few hundred meters depth, changes in sea surface height cause much smaller variations in τ than those caused by internal changes in sound speed; moreover the P measurements are used to correct for the changes in sea surface height. Both τ and dynamic height can be derived from the temperature (T) and salinity (S) profiles; τ is determined by the equation PB 1 - dP τ = 2 × ∫ -------0 ρgc
(1)
where g is gravity, and P is pressure. The density ρ and sound speed c are functions of P, T and S. From over 1500 historic hydrographic profiles we determined that τ values at each PIES pressure level PB are strongly correlated with 500dbar τ =2× ∫ (ρgc) dP, and we converted each PIES mea0 surement of τ to τ using the appropriate scale factor determined from these profiles. The dynamic height anomaly ΔH of the surface relative to 500 dbar is given by the equation -1
500
500
500
500 dbar ΔH 500 = 1 δdP --- ∫ g 0
(2)
where d represents the specific volume anomaly, a function of P, T, and S. There is an approximately linear relationship ΔH = mτ' between surface dynamic height anomaly and varations in acoustic round-trip travel time τ' (James and Wimbush 1995). From over 1500 historic hydrographic 500
500
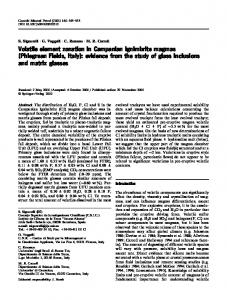
profiles taken in the Ulleung Basin region we determined that m = –36.3 dyn m s . Contours of ΔH may be regarded as representing the stream function for the upper-layer (baroclinic) component of geostrophic flow. The two-year mean of this ΔH field is shown in Fig. 2(a). For more details about the data processing conversion procedure see Mitchell et al. (2004), who report a standard deviation of 2.44 dyn cm in converting τ to ΔH . The initial processing of pressure records involved removal of jumps and long-term drifts. The pressure records were five-day low-pass filtered to remove ageostrophic signals. Pressure records were remarkably similar to one another on all time scales, with correlations between all pairs of records exceeding 0.95. This basin-wide pressure signal has been diagnosed as being driven by a combination of atmospheric pressure over the JES, wind stress along the straits that connect the JES to the open ocean, and oceanic pressure differences along the straits caused by sea-level changes outside the straits (Lyu and Kim 2005; Park and Watts 2005); it is dynamically unimportant for mesoscale variability and was subtracted from all pressure records. The resulting pressure field (P) may be regarded as representing the stream function for the deep (barotropic) component of geostrophic flow. A relative time mean pressure field (or reference pressure field) was obtained with a leveling technique. This leveling was accomplished by assuming the measured mean deep currents were geostrophic, thereby determining reference pressure differences -1
500
500
500
Fig. 2. (a) Two-year time mean ΔH (geopotential height anomaly at surface relative to 500 dbar divided by the acceleration of gravity.) over the 2-yr deployment in the Ulleung Basin. (units: dyn m). (b) Two-year time-mean deep pressure fields. Unit: mbar. Contour intervals are 0.02 dyn m for ΔH and 0.2 mbar for P. See text for details.
38
Xu, Y. et al.
between all sites. The leveling procedure is the same as that used in Teague et al. (2005), which followed the method presented in Watts et al. (2001). The obtained relative timemean pressure field is shown in Fig. 2(b) (areas without sufficient data to map the reference mean pressure field are blank). Canonical Correlation Analysis Canonical Correlation Analysis (CCA) was applied to the ΔH and P data to extract the most correlated modes. CCA is a way of finding the linear relationship between two sets of basis vectors. It finds two bases, one for each variable, that are optimal with respect to correlations. In other words, it finds the two bases in which the correlations between the projections of the variables onto these basis vectors are mutually maximized. Suppose X(p×n) and Y(q×n) are observations on two sets of variables, where p and q are the number of variables for X and Y, and n is number of observations. The transpose and inverse of X are written as XT and X . The CCA problem therefore consists of finding vectors a and b to maximize the correlation -1
r ( a, b ) = a T XY T b
(3)
under the condition, a T Xa = 1, b T XaYb = 1
(4)
CCA uses partial derivatives to derive the modes with maximum correlations: ∂r ( a, b ) ∂r ( a, b ) ------------------= 0, ------------------- = 0 ∂a ∂b
(5)
According to Gittins (1985) and Xu (2006), a and b can be obtained by solving the equations ( XX T ) ( XY T ) ( YY T ) ( YX T )a = λ 2 a
(6)
( YY T ) ( YX T ) ( XX T ) ( XYT )b = λ 2 b
(7)
–1
–1
–1
–1
ak and bk are the discrete eigenvectors of equations (6) and (7) and share the same eigenvalues λk. CCA was applied to isolate the most strongly related patterns of ΔH and P variability. We followed the procedure recommended by Barnett and Preisendorfer (1987) and Bretherton et al. (1992) to pre-filter the bottom pressure data by retaining only
its first two leading empirical orthogonal functions. To test the robustness of the CCA patterns, we also calculated the decorrelation time scale of the bottom pressure data, which we found to be approximately eighteen days. The bottom pressure and dynamic-height data were then eighteen-day low-pass filtered and subsampled at nine-day intervals. The CCA modes for these differently sampled data retain similar patterns to those of the 5-day low-pass filtered daily data (Xu 2006). According to the chi-squared test statistic (Jobson 1992), the probability that these modes could occur from random data is smaller than 0.05. The subsampling and the chi-squared test statistic suggest the CCA modes are robust. Note the eigenvectors (or CCA modes) represent the deviation modes from the time mean fields. An anomaly field at different time index values gives different spatial patterns after restoring the time mean. The advantage of restoring the mean fields to the anomaly fields is that the full fields represent more completely the real ocean, and thus their time varying maps invite dynamical interpretation of the processes.
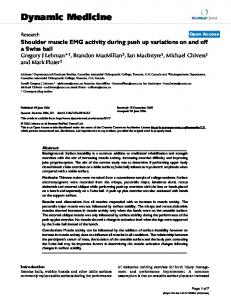
3. Results The first CCA mode (CCA1) is shown in Fig. 3. The CCA1 ΔH map exhibits a positive anomaly in the northeast and southwest quadrants, and a negative anomaly in the northwest quadrant. The most prominent feature of the CCA1 P field is a negative anomaly at the center of the UB Depression, and the surrounding 5 sites contribute to this extremum. As discussed in Section 2, the CCA mode is an anomaly mode relative to the time mean field over the observation period. The time index series represent the amplitudes and sign changes of the anomaly fields during the observation time period. Adding the time-mean fields to the anomaly fields presents a series of ocean circulation patterns associated with that mode. We add the ΔH time mean fields to the ΔH CCA1 anomaly field multiplied separately first by its positive and then by its negative extremum time-index values. Thus, we generate two ΔH patterns, hereafter called the ΔH pattern pair of the CCA1 mode. The ΔH pattern pair represents two terminal patterns between which the ΔH field changes back and forth. In a similar way, we obtain the corresponding P CCA1 pattern pair using the P mean field. Note the CCA1 mode correlation is 0.75, indicating a strong tendency for the CCA1 ΔH and P
Coupled patterns between fields of dynamic height and bottom pressure
39
Fig. 3. (a) and (b) respectively show the canonical maps of ΔH (units: dyn m) and bottom pressure (unit: mbar) for CCA1. Contour intervals are 0.005 dyn m for ΔH and 0.07 mbar for P. (c) and (d) show the respective time index values of (a) and (b) (i.e., temporal components). The canonical correlation is 0.75. CCA1 explains 10% of the ΔH variance and 31% of the bottom-pressure variance.
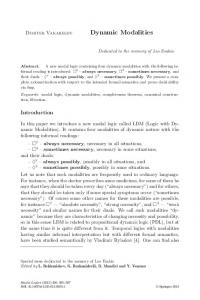
Fig. 4. Coupled pattern pairs formed from CCA1 maps of ΔH (units: dyn m) (left panels) and P (unit: mbar) (right panels) after restoring their respective time-mean fields as detailed in text. This figure represents the patterns of maximally correlated upper and deep geostrophic circulation. Contour intervals are 0.025 dyn m for ΔH and 0.2 mbar for P.
fields to change together in phase. We call the CCA1 ΔH and P pattern pairs the “coupled pattern pairs.” The time indices of CCA1 show that ΔH and P oscillate broadly together between their respective pattern-pair limits nearly four times during the two-year observation period (Fig. 3(c,d)). It is interesting to consider the dynamic implications of
the CCA1 ΔH and P coupled pattern pairs as shown in Fig. 4. Since there are no dynamical constraints in the CCA analysis, the probability is extremely small that it would randomly introduce patterns whose dynamical interpretations appear sensible. Simulations with artificial random signals in CCA always produced formless spatial patterns and
40
Xu, Y. et al.
much lower correlations even in the CCA1 fields. Therefore, we confidently examine the dynamic implications of the CCA1 coupled pairs. In the following analysis, we focus on the following questions: 1. How can we relate the changes in circulation associated with the ΔH and P pattern pairs to dynamical events in the Ulleung Basin? 2. In their pattern pairs, are the changes between the ΔH and P fields consistent both in sign and magnitude with conservation of Potential Vorticity (PV)? The ΔH pattern pair (left panels in Fig. 4) clearly exhibits in CCA1 the Ulleung Warm Eddy (red) and its characteristic migration and evolution. From map-1 to map-2, the Ulleung Warm Eddy moves to the northeast while deepening its central thermocline. In agreement with this, the large firstyear Ulleung Warm Eddy northward migration event coincides with a decrease in Korea Strait transport from maximum in October 1999 to minimum in January 2000, as reported by Teague et al. (2002). Correspondingly, the deep cyclone centered at the UB depression is replaced by an anticyclone in going from pressure-pattern map-3 to map-4. Positions of the centers of the upper Ulleung Warm Eddy and deep anticyclone are nearly the same and both of their long axes are in a southeast-northwest direction (map-2 and map-4). The changes of upper thermocline depth and deep vorticity in the UB region are prominent features of the CCA1 coupled pattern pairs. As for the second question, the dynamic implication of the coupled pairs agrees well with PV conservation theory. Without friction, following a mesoscale water column, the PV remains constant. The PV of the water column beneath the Ulleung Warm Eddy can be written as: f+ζ PV = ----------h
(8)
where f is Coriolis parameter, ζ is relative vorticity of the water column, and h is the vertical thickness of the subthermocline water column. Since f change is negligible in our study, the alteration of h should be balanced by change of ζ in order to keep the PV unchanged. When it moves northward, the Ulleung Warm Eddy center deepens the thermocline ahead of it and shallows the thermocline behind it. Consequently the descending (ascending)
thermocline squeezes (stretches) the water column beneath. Indeed, as the Ulleung Warm Eddy moved northeastward, not only was a deep anticyclone formed under it, but an existing cyclone behind the Eddy center intensified (Fig. 4, map-4). To conserve PV, the relative vorticity of the deep water column changes to balance the thickness loss or gain in the deep layer. Moreover, the changes are appropriate not only in sign but also in magnitude. The h in equation (8) decreases under the descending thermocline from map-1 to map-2; therefore we expect negative relative vorticity in the deep layer will be generated to maintain constant PV. As seen from the pressure pattern pair, the original UB deep cyclonic circulation is replaced by anticyclonic circulation. This indeed represents an increase in negative relative vorticity from map-3 to map-4. From Fig. 3 (left panels) we estimate the change in dynamic height to be ΔH~0.04 dyn m. From historical hydrography we determined the ratio Δh/ΔH ~ –660 for the Ulleung Basin region. So, taking h = 2000 m, we obtain the relative change in subthermocline water column thickness Δh/h~−0.01. From Figure 3 (right panels), we estimate the change in deep relative vorticity Δζ/f~-ΔP/ρL f ~ −0.01, where ΔP ~ 1.2 mbar and the radius of the deep eddy L ~ 50 km. Thus changes agree well both in direction and magnitude with PV conservation theory. In the CCA2 mode (not shown), the spatial patterns of ΔH and P are similar to each other. Both have a pattern peaked at a site (P1-4 in Fig. 1) near the southwestern edge of the Korea Plateau. Park et al. (2004) showed from float data that there is an anticyclonic mean circulation around the Korea Plateau at the 700 m depth level and suggested that this anticyclonic circulation is related to a Taylor column above the Plateau. According to Park (personal communication), the anticyclonic circulation probably extends to the bottom. However, we only have one site (P1-4) within the anticyclone region (which means the anticyclone is not observed directly from our measurements), so we do not discuss this mode further. 2
2
4. Discussion This work investigates the influence of upper layer eddyimposed vertical stretching on the mesoscale deep circulation in the Ulleung Basin. Our study stemmed from the SYNOP Experiment in which spin-up of deep eddies occurred during the passage of steep meander crests and troughs of
Coupled patterns between fields of dynamic height and bottom pressure
the Gulf Stream. Similar measuring and mapping techniques do not reveal obvious evidence of coupling in the Ulleung Basin; since the pressure fluctuations associated with deep cyclones and anticyclones are an order of magnitude smaller than those in the SYNOP region, it is likely that they are masked locally by other deep dynamic processes. Hence we needed to use statistical methods to reveal the masked coupled patterns, which turned out to extend broadly through most of the deep Ulleung Basin; thus their scale was larger than the ~ 80 km meander crests or troughs observed along the fronts bordering the Ulleung Basin. We can see the influence of upper-eddy-imposed vertical stretching on the deep vorticity from the CCA1 mode analysis. The coupled pattern pairs agree in timing, spatial structure, sign, and magnitude with PV conservation theory. We consider this good evidence for vertical coupling. We have investigated the imprint of vertical coupling under weak vertical stretching conditions. The resulting CCA1 pressure field accounts for 31% of the bottompressure variance (after removing the common mode) and 10% of the dynamic height variance. Thus we do not claim that the vertical coupling revealed here is the dominant process driving upper- or deep-ocean variability under these conditions. Note CCA selects modes with maximum correlation rather than maximizing variance (see equation 5). Other dynamic processes are responsible for the larger balance of the variability, which is why the coupling was masked in our traditional analyses. Observing the coupling of upper-layer eddies with abyssal eddies requires dense arrays of instruments capable of recording both upper- and lower-layer dynamical fields. This has been carried out previously under the vigorously meandering Gulf Stream. Our study in the Ulleung Basin is strongly suggestive that such coupling occurs also under much weaker flows. The fact that the Ulleung Basin is semi-confined by closed bathymetry contours may have helped connect the deep circulation, revealing the nearly basin-scale-correlated CCA1 pattern. Deep ocean mixing is regarded as driving the meridional overturning circulation, and about half of the mixing energy comes from the ocean upper layer (Munk and Wunsch 1998). But how the upper-layer energy is transferred to the deep ocean is still uncertain. Vertical coupling under a relatively weak flow would imply that this type of downward energy transfer may occur in vast areas of the ocean and enhance mixing in the weakly stratified abyss.
41
Acknowledgements We thank Dr. M.-S. Suk (KORDI) and Prof. J.-H. Yoon (Kyushu University) for providing some of the current meter data as noted above. We thank Karen Tracey for her help in processing the acoustic travel-time and bottom pressure data. We also thank H. Thomas Rossby, Kathleen A. Donohue, Jae-Hun Park, and John Merrill for fruitful discussions. This work was supported by the Office of Naval Research grant N000140410658.
References Barnett TP, Preisendorfer RW (1987) Origins and levels of monthly and seasonal forecast skill for United States surface air temperature determined by canonical correlation analysis. Mon Wea Rev 115:1825-1850 Bretherton CS, Smith C, Wallace JM (1992) An intercomparision of methods for finding coupled patterns in climate data. J Climate 5:541-560 Chang K-I, Teague WJ, Lyu SJ, Perkins HT, Lee D-K, Watts DR, Kim Y-B, Mitchell DA, Lee C-M, Kim K (2004) Circulation and currents in the southwestern East/Japan Sea: overview and review. Prog Oceanogr 61:105-156 Chang K-I, Hogg NG, Suk M-S, Byun S-K, Kim Y-G, Kim K (2002) Mean flow and variability in the southwestern East Sea. Deep-Sea Res I 49:2261-2279 Cushman-Roisin B, Chassignet EP, Tang B (1990) Westward motion of mesoscale eddies. J Phys Oceanogr 20:758-768 Frolov SA, Sutyrin GG, Rowe GD, Rothstein LM (2004) Loop Current eddy interaction with the western boundary in the Gulf of Mexico. J Phys Oceanogr 34:2223-2237 Gittins R (1985) Canonical analysis. Springer-Verlag, Berlin, 351 p Hallberg R (1997) Localized coupling between surface- and bottom-intensified flow over topography. J Phys Oceanogr 27:977-999 Hogan PJ, Hurlburt HE (2000) Impact of upper ocean-topography coupling and isopycnal outcropping in Japan/East Sea models with 1/8o to 1/64o resolution. J Phys Oceanogr 30: 2535-2561 Indest AW (1992) Ring dynamics in the western Gulf of Mexico. Ph.D. Thesis, Old Dominion University, Norfolk, Virginia, 127p James C, Wimbush M (1995) Inferring dynamic height variations from acoustic travel time in the Pacific Ocean. J Oceanogr 51:553-569 Jobson JD (1992) Applied multivariate data analysis. SpringerVerlag, New York, 731p Lyu SJ, Kim K (2005) Subinertial to interannual transport variations in the Korea Strait and their possible mechanisms. J Geophys Res 110:C12016. doi:10.1029/2004JC002651
42
Xu, Y. et al.
Mitchell DA, Wimbush M, Watts DR, Teague WJ (2004) The Residual GEM technique and its application to the southwestern Japan/East Sea. J Atmos Ocean Technol 21:1895-1909 Munk W, Wunsch C (1998) Abyssal recipes II. Energetics of tidal and wind mixing. Deep-Sea Res I 45:1977-2010 Park Y-G, Oh K-H, Chang K-I, Suk M-S (2004) Intermediate level circulation of the southwestern part of the East/Japan Sea estimated from autonomous isobaric profiling floats. Geophys Res Lett 31:L13213. doi:10.1029/2004GL020424 Park J-H, Watts DR (2005) Response of the southwestern Japan/ East Sea to atmospheric pressure. Deep-Sea Res II 52:16711683 Sturges W, Evans J, Welsh S, Holland W (1993) Separation of warm-core rings in the Gulf of Mexico. J Phys Oceanogr 23:250-268 Sutyrin G, Rowe G, Rothstein L, Ginis I (2003) Baroclinic eddy interactions with continental slopes and shelves. J Phys Oceanogr 33:283-291 Teague WJ, Jacobs GA, Perkins HT, Book JW, Chang K-I, Suk M-S (2002) Low-frequency current observations in the Korea/
Tsushima Strait. J Phys Oceanogr 32:1621-1641 Teague WJ, Tracey KL, Watts DR, Book JW, Chang K-I, Hogan PJ, Mitchell DA, Suk M-S, Wimbush M, Yoon J-H (2005) Observed deep circulation in the Ulleung Basin. Deep-Sea Res II 52:1802-1826 Thompson L (1995) The effect of continental rises on the wind driven ocean circulation. J Phys Oceanogr 25:1296-1316 Watts DR, Qian X, Tracey KL (2001) Mapping abyssal current and pressure fields under the meandering Gulf Stream. J Atmos Ocean Technol 18:1052-1067 Welsh S, Inoue M (2000) Loop Current rings and the deep circulation in the Gulf of Mexico. J Geophys Res 105: 16951-16959 Xu Y, Tracey KL, Watts DR, Wimbush M, Teague WJ, Book J (2003) Current Meter Data Report: Ulleung Basin in the Japan/East Sea. Univ. of R. I., Narragansett, Graduate School of Oceanography Technical Report 2003-02, 118 p Xu Y (2006) Analyses of sea surface height, bottom pressure and acoustic travel time in the Japan/East Sea. Ph.D. Thesis, The Univ. of Rhode Island