8.13
COMMODITY PASSIVE STEREO GRAPHICS FOR COLLABORATIVE DISPLAY OF OCEAN MODEL OUTPUT Albert J. Hermann and Christopher W. Moore (NOAA-PMEL/UW-JISAO)
1.
INTRODUCTION
Commodity hardware has been used to build a lowcost, passive, stereo-immersive virtual reality visualization system with the functionality of the ImmersaDesk in a small and portable package. The cost is low because it utilizes free stereo display software, in combination with commodity hardware that is readily available off-the-shelf for computer game users. Commonly known as a “GeoWall”, this system has been successfully deployed at many academic institutions. With this highly portable system, immersive visualization of model output can be realized on the scientist's desktop, or shared with a wide audience, at five percent (or less) of the cost of other large-format display systems such as the CAVE and the ImmersaDesk. 2.
IMMERSIVE TECHNOLOGIES
We have explored with our colleagues a variety of techniques and technologies for immersive visualization, as a tool to further oceanographic and atmospheric research. Over the years, these implementations have spanned a broad range of cost and complexity. Projects have included: 1) software development for the (high-end) ImmersaDesk, and 2) software/hardware development for the (low-end) use of red/blue glasses, in conjunction with the Virtual Reality Modeling Language (VRML) and VRML browsers. Fundamental incompatibilities between these two approaches remained. The high-end display was platform-specific (SGI), and collaborations between heterogeneous machines were not possible. The ImmersaDesk could not be used for stereo viewing of VRML worlds, while worlds created for the ImmersaDesk could not be viewed on a simple PC. 3.
THE GEOWALL APPROACH
The development of GeoWall technology has permitted these two approaches to merge. The GeoWall approach is based on the use of graphics cards for commodity PCs which support more than one display, and passive linear polarization of light. The right- and lefteye views of a scene are sent to separate projectors (Figure 1), which are equipped with filters to differently polarize the emitted light from each. The two images * Corresponding author address: Albert J. Hermann, NOAA/PMEL/OCRD, 7600 Sandpoint way NE, Seattle, WA 98115; e-mail:
[email protected]
are superimposed on a single screen which preserves the polarization of the photons. The resulting image is viewed with passive polarized glasses (of the type commonly used at recreational theme parks), hence sending the two different images to separate eyes.
The signals sent to the projectors can be from a video card that supports “clone” mode stereo, or (with the use of a signal splitter) from full, double-buffered, “page-flipped” stereo output. The clone mode allows the use of low-end dual head graphics cards to achieve the stereo effect. Since graphics cards have progressed so much in the last decade (driven primarily by the computer game market), researchers can economically purchase a powerful card that can render scenes in either stereo format. Our implementation of the GeoWall supports both clone mode and page-flipped stereo; hence all of the OpenGL stereo-based software programs in use at PMEL can be run on this system. Such programs include: the Cortona VRML browser, Vis5D+, vGeo, FreeWRL, and native VTK applications. For example, we routinely run vis5D+ on the GeoWall to explore Eulerian model output from the Regional Ocean Modeling System (ROMS) and the Weather Research and Forecasting (WRF) model (Figure 2). We run Cortona on the system to view pseudo-Lagrangian output (rendered as VRML worlds) from Individualbased fish models (Figure 1). 4.
COLLABORATIVE DISPLAY
Two of the prerequisites we had for a stereo graphics system were to leverage past work by rendering VRML, and to achieve some sort of collaborative display. The Immersaview software fulfilled both of these aims. Immersaview is open-source software developed at University of Chicago’s Electronic Visualization Laboratory. It was built upon three cross-platform libraries: one for rendering, one for geometry, and one for collaboration. The Coin3D and GLUT libraries render geometry, and can read VRML, Performer, and Inventor files. The collaboration is handles by a cross-platform database library called Quanta.
Initial tests of collaboration between the GeoWall and the ImmersaDesk were successful. Not only were old VRML worlds easily loaded and rendered (including animation, and complex geometry morphing), but the Quanta-based collaborative mode allowed the user at each location to move, examine, and animate each world in unison.
Tests of Immersaview in a Windows environment were partially successful; while the rendering capabilities were similar to the Linux-based GeoWall and ImmersaDesk, initial attempts at using the collaborative mode failed. Since the software is open-source, with the goal of platform independence, we are optimistic that full collaboration across the different operating systems will be possible in the future. Note, too, that the GeoWall was developed to be compatible with the AGAVE (Access Grid Advanced Visualization Environment) system, and integrating it into an Access Grid node at PMEL should allow shared 3-D renderings with collaborators at other research institutions.
5.
DISTRIBUTED RENDERING
The oceanic and atmospheric models in use at PMEL are being run at higher resolution every year, typically on distributed-memory Superclusters. As output files grow in size, they are increasingly difficult to store, render and visualize on a single host. One trend in supercomputing is to use a parallel file system, in which each node of the cluster stores on local disk that subregion of the model domain it was assigned at runtime. This collection of files can be rendered as a single world using one of two techniques, distributed rendering or compositing.
Paraview was developed at Los Alamos National Lab with the help of Kitware – the developers of the Visualization Toolkit (VTK). Paraview also takes advantage of advanced Level of Detail (LOD) techniques to keep the host from bottlenecking these large files.
6.
CONCLUSION
Immersive color visualization and collaboration is now available to oceanographers and atmospheric scientists at modest cost; many have the capability already contained in their desktop computer. Visualization of this type is a powerful tool for the exploration and understanding of increasingly voluminous model output. 7.
ACKNOWLEDGEMENT
This publication was supported by the Joint Institute for the Study of the Atmosphere and Ocean (JISAO) under NOAA Cooperative Agreement #NA67RJ0155, Contribution #1263. PMEL contribution 2650. The views expressed herein are those of the author(s) and do not necessarily reflect the views of NOAA or any of its sub agencies. This work was funded by NOAA’s HPCC program.
Using VisAD, a Java library for 3-D rendering, distributed rendering is achieved by running a server on each node, and the geometry for that piece of the domain is made available to a host using Java’s Remote Method Invocation (RMI). This technique was developed at the University of Wisconsin by VisAD developers.
8.
REFERENCES
The other method is similar in that each node creates geometry for its domain, but the information is passed back through the motherboard when sent to the host. This method, called compositing, is used by Paraview.
PMEL 3D visualization website: http://www.pmel.noaa.gov/vrl/geowall
Geowall website: http://geowall.geo.lsa.umich.edu/ Immersaview website: http://www.evl.uic.edu/cavern/agave/immersaview/
Projector (L frame)
polarizing filter
Projector (R frame)
polarizing filter
Host computer
Polarization-preserving screen
Figure 1. Schematic of host computer (commodity PC or workstation), projectors, filters, and projection screen. Thick arrows denote light path.
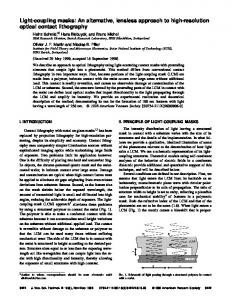
Figure 2. Office-based immersive visualization. Left panel shows an oceanographer using large-screen immersive hardware to visualize data in his office at Pacific Marine Environmental Laboratory. Note the use of a pull-down projection screen. Right panel shows projection equipment at the back of the office.