Adv. Geosci., 29, 61–67, 2011 www.adv-geosci.net/29/61/2011/ doi:10.5194/adgeo-29-61-2011 © Author(s) 2011. CC Attribution 3.0 License.
Advances in Geosciences
Coupling ensemble weather predictions based on TIGGE database with Grid-Xinanjiang model for flood forecast H.-J. Bao1,2 , L.-N. Zhao1,2 , Y. He3,6 , Z.-J. Li4 , F. Wetterhall3,7 , H. L. Cloke3 , F. Pappenberger5 , and D. Manful3 1 Public
Weather Service Center, China Meteorological Administration, Beijing, 100081, China Meteorological Center, China Meteorological Administration, Beijing, 100081, China 3 Department of Geography, King’s College London, Strand, London, WC2R 2LS, UK 4 College of Hydrology and Water Resources, Hohai University, Nanjing 210098, China 5 European Centre for Medium-Range Weather Forecasts (ECMWF), Shinfield Park, Reading, RG2 9AX, UK 6 Tyndall Centre for Climate Change Research, School of Environmental Sciences University of East Anglia, NR4 7TJ, UK 7 Swedish Meteorological and Hydrological Institute, Norrk¨ oping, Sweden 2 National
Received: 28 July 2010 – Revised: 22 October 2010 – Accepted: 21 November 2010 – Published: 28 February 2011
Abstract. The incorporation of numerical weather predictions (NWP) into a flood forecasting system can increase forecast lead times from a few hours to a few days. A single NWP forecast from a single forecast centre, however, is insufficient as it involves considerable non-predictable uncertainties and lead to a high number of false alarms. The availability of global ensemble numerical weather prediction systems through the THORPEX Interactive Grand Global Ensemble’ (TIGGE) offers a new opportunity for flood forecast. The Grid-Xinanjiang distributed hydrological model, which is based on the Xinanjiang model theory and the topographical information of each grid cell extracted from the Digital Elevation Model (DEM), is coupled with ensemble weather predictions based on the TIGGE database (CMC, CMA, ECWMF, UKMO, NCEP) for flood forecast. This paper presents a case study using the coupled flood forecasting model on the Xixian catchment (a drainage area of 8826 km2 ) located in Henan province, China. A probabilistic discharge is provided as the end product of flood forecast. Results show that the association of the Grid-Xinanjiang model and the TIGGE database gives a promising tool for an early warning of flood events several days ahead.
Correspondence to: H. Bao (
[email protected])
1
Introduction
Flood protection and awareness have continued to rise on the political agenda accompanied by a drive to “improve” flood forecasts (Demeritt et al., 2007; DKKV, 2004; Parker and Fordham, 1996; Pitt, 2007; van Berkom et al., 2007; Cloke and Pappenberger, 2009). Giving flood forecasting services, civil protection authorities and the public adequate preparation time and thus reducing the impacts of the flooding (Penning-Rowsell et al., 2000). Many flood forecasting models rely on precipitation inputs, which come initially from observation networks (rain gauges) and radar. Actually, the incorporation of numerical weather prediction (NWP) into a flood forecasting model can increase forecast lead times from a few hours to a few days. Single deterministic weather forecast from NWP can’t take uncertainties and systematic biases into consideration and hence often fail to replicate weather variables correctly. Ensemble Prediction Systems (EPS) have evolved over the last decade to forecast weather taking into consideration observation uncertainties, model uncertainties (e.g. due to a lack of resolution, simplified parameterization of physical processes and effect of unresolved processes), imperfect boundary conditions and data assimilation assumptions (Park et al., 2007). An EPS is interpreted by Buizza as a system based on a finite number of deterministic integrations and regarded as, so far, the only feasible method in meteorology to predict probability density function beyond the range of linear error growth. EPS forecasts from a single weather centre only account for part of the uncertainties originating from initial conditions and stochastic physics (Roulin, 2006). Other sources of
Published by Copernicus Publications on behalf of the European Geosciences Union.
62
H.-J. Bao et al.: Coupling ensemble weather predictions
Table 1. List of the meteorological forecast centres used in the case study. Country/Region
Meteorological centre
Centre abbreviation
Centre code
Ensemble members
Canada China Europe
Canadian Meteorological Centre China Meteorological Administration European Centre for Medium-Range Weather Forecasts Meteorological Office National Centres for Environmental Prediction
CMC CMA ECWMF
BABJ CWAO ECMF
14 + 1 14 + 1 50 + 1
UKMO NCEP
EGRR KWBC
23 + 1 14 + 1
UK USA
uncertainties, including numerical implementations and/or data assimilation, can only be assessed if a grand ensemble (GE) of EPS from different weather centres are combined (Goswami et al., 2007). When various models that produce EPS from different weather centres are aggregated, the probabilistic nature of the ensemble precipitation forecasts is better retained and accounted for (He et al., 2009, 2010). An ensemble of weather forecasts can be used on catchment hydrology and provide improved early flood forecasting as some of the uncertainties can be quantified (Cloke and Pappenberger, 2008). To this end, a case study was carried out using five TIGGE forecast centres: The Grid-Xinanjiang model (Li et al., 2006; Wang et al., 2007; Yao et al., 2009) was used to simulate the discharge. The study area is the Xixian catchment, located upstream of the Huaihe River. The aims of this paper are to (1) develop atmospheric-hydrologic flood forecasting model cascade driven by TIGGE ensemble forecasts, and (2) apply the model cascade to the Xixian catchment and compare the simulation results driven by TIGGE forecasts and raingauge observation.
2
Case study area and data
The Huaihe River is located between latitudes 31◦ N and 35◦ N and longitudes 112◦ E and 121◦ E. It originates in the Tongbai Mountains of Henan Province, and flows over four provinces in east-central China. The length of the main channel of the Huaihe River is circa 1000 km and the total catchment area is 1.912 × 10⁵ km2 (not including the Yishusi catchment area). Its mean annual precipitation and runoff depth is approximately 888 and 240 mm,, respectively. The runoff coefficient ranges from 0.1 (northeast) to 0.6 (southwest). The Xixian catchment, located between latitudes 31.5◦ N and 33.0◦ N and longitudes 113.0◦ E and 115.0◦ E in the upstream of the Huaihe River, has a drainage area of 8826 km2 and is situated in the south of Henan province. The catchment average annual precipitation is 1145 mm, 50% of which is within the period of the flood season (June– Adv. Geosci., 29, 61–67, 2011
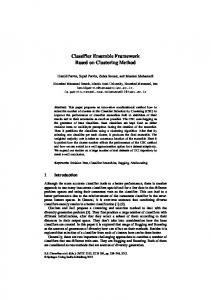
September). Ten rainfall stations and one hydrological station are available in the Xixian catchment. Figure 1 shows the location of Xixian catchment in China and the sketch of the upper reaches of Huaihe River above Xixian station. Observed hydro-meteorological data were obtained from China Meteorological Administration (CMA), and TIGGE data for five weather centres were obtained from TIGGEChina. The July 2007 flood event was selected in the study area. Table 1 lists the five weather centres and their numbers of ensemble forecasts. 3 3.1
The Grid-Xinanjiang model Introduction of the Grid-Xinanjiang model
The Grid-Xinanjiang model uses pixels as the computational elements for rainfall-runoff modeling and each element consists of a water balance component and a cell-tocell (3000 × 3000 ) flow routing component. The evapotranspiration, runoff production, and runoff separation in each pixel are calculated in the same way as the original Xinanjiang model (Zhao, 1992; Zhao and Liu 1995). The runoff generation of the computational element is composed of three components: surface, subsurface and groundwater, which are obtained from the value of tension water capacity and free water storage capacity of each cell. Outlet flow of each pixel to the outlet of the whole catchment is routed from cell to cell by using the Muskingum-Cunge method (Cunge, 1969) based on the computed order among the DEM grid cells. During the calculation of the runoff generation and runoff concentration in every computational element, the reinfiltration and influence of the river drainage network are taken into consideration (Band, 1986; Yao et al., 2009). The flow is partitioned into channel and downstream cell according to the channel inflow direction and channel outflow direction.
www.adv-geosci.net/29/61/2011/
H.-J. Bao et al.: Coupling ensemble weather predictions
63
Table 2. Calibration and validation results of the Grid-Xinanjiang model in Xixian catchment.
Flood code
Calibration
Validation
Runoff (mm)
Relative error of Peak flow (%)
Relative error of runoff (%)
Peak time error (hour)
Nash Sutcliffe coefficient
1670 4410 4420 524 2300 4450 2510 4800 3150 5080 3900 3800 950
100.4 187.4 108.3 41.3 48.7 280.1 60.9 323 145.8 164.6 143.9 114.7 32.7
5.0 12.2 0.8 0 6.3 9.1 0.6 −6.8 5.7 6.7 12.2 −8.4 −8.5
15.4 −0.4 −18.0 1.9 1.4 −1.3 −27.7 −15.8 −11.0 −8.8 5.8 −3.3 8.9
−1 0 0 −3 0 0 −1 0 0 0 0 0 0
0.82 0.94 0.97 0.84 0.96 0.95 0.89 0.89 0.87 0.92 0.96 0.94 0.89
2520 1560 6000 3830 3830 4330 3700
66.8 34.9 159.8 175.9 123.1 107.2 85.2
−9.9 −6.5 −15.2 0.8 −5.7 12.7 6.4
1.7 20.5 −7.9 −9.5 10.4 −1.35 1.9
1 0 0 −1 1 0 1
0.80 0.91 0.98 0.91 0.91 0.94 0.91
8.7
7.8
0.45
0.91
Peak flow m3 s−1
19910517 19910629 19910801 19910901 19950705 19960619 19980701 19980803 20000624 20020621 20030621 20030716 20040715 20040728 20050623 20050704 20050820 20050828 20070711 20080722
Absolute mean
3.2
Calibration and verification of the GridXinanjiang model
In this study, 20 flood events from 1990 to 2008 that took place in the Xixian catchment were used for model calibration and verification at a 6-h time step. Because radar-based precipitation data sets are not available in the study sites at present, in order to obtain the rainfall input of each cell and consider the spatial variability of precipitation and its effect on catchment response, the Xixian catchment was divided into 10 sub-catchments by using Thiessen polygon method. The smallest sub-catchment was 4.7% in the Xixian catchment. There is only one rain gauge in each sub-catchment, so rainfall input of each cell can be obtained according to the gauged point value in each sub-catchment. In other words, precipitation in each sub-catchment is treated as spatially uniform. According to the Accuracy Standard for Hydrological Forecasting in China (MWR (The Ministry of Water Resources of the People’s Republic of China), 2000), the Nash Sutcliffe coefficient and the percent absolute error of peak flow, runoff volume and peak time are four important criteria to evaluate flood simulation and flood forecasting. In terms of peak flow, total runoff volume and peak time of each flood, the result of simulation or forecasting is satisfactory if the absolute peak error between the simulated and observed www.adv-geosci.net/29/61/2011/
floods is less than 20%, if absolute error between the simulated and observed floods is less than 3 mm or the absolute runoff error is less than 20% and if the difference in peak time is within a routing period or three hours. In this paper, thirteen flood events were chosen to calibrate the Grid-Xinanjiang model parameters and seven flood events to verify the model in Xixian catchment. The results of verification are presented in Table 2; they are ordered by flood code of each flood event. The code of each flood event in column of Table 2 stands for the start time of each flood event, for example, the event 20 August 2005 was one that occurred on 20 August 2005. The statistical indices shown in Table 2 include the relative peak flow error, relative runoff error, peak time error and Nash-Suctllife coefficient. The ratios of qualifying peak flow, flood runoff and peak time for the Grid-Xinanjiang model applied to the Xixian catchment are 100%, 90.0% and 95.0%, respectively. The Nash-Suctllife coefficients of all of the events in Table 2 are greater than or equal to 0.80; the Nash-Suctllife coefficients of 12 floods are greater than 0.90. The acceptable Nash-Suctllife coefficients also indicate that the simulated flood hydrographs are conceptually reasonable for the model applied to the Xixian catchment. Table 2 show that the simulation results of the Grid-Xinanjiang model can perform well in predicting flood runoff and outlet hydrographs. One factor may be that Adv. Geosci., 29, 61–67, 2011
64
H.-J. Bao et al.: Coupling ensemble weather predictions
Fig. 1. The location of Xixian catchment in China (left), and the Xixian catchment (right).
4
Application and results
The majority of the weather centres delivered global EPS data from January 2007 onwards. This study focused on one flood event that took place in July 2007 (Fig. 2). The flood warning level at the Xixian station is 41.50 m and corresponds to a discharge of 4034 m3 s−1 . The warning level was reached at 00:00 UTC on 15 July 2007 for the studied flood event and exceeded in the subsequent day. 4.1
Fig. 2. Observed 6-hourly precipitation and discharge at Xixian catchment.
the effect of reinfiltration and drainage network on rainfallrunoff response considered by the gridded model is scale dependent; the response can be more accurately captured by the gridded model in larger catchments. Looking collectively at the calibrated and validated results for the Xixian catchment, the performances of the Grid-Xinanjiang model satisfy the first grade of flood forecasting calibration or validation (all of three ratios are more than 85%) in terms of the standard established by MWR, China. These analyses confirm the forecast robustness and reliability of the proposed Grid-Xinanjiang model.
Adv. Geosci., 29, 61–67, 2011
Precipitation input evaluation
The precipitation forecasts Pf were retrieved from five weather centres in the TIGGE archive, namely Canadian Meteorological Centre (CMC), China Meteorological Administration (CMA), European Centre for Medium-Range Weather Forecasts (ECMWF), UK Met Office (UKMO), and National Centres of Environmental Prediction (NCEP). The forecasts of 11 July 2007 from NCEP were excluded from this study due to an error that occurred during data extraction. For the selected five centres, each provides one “central” unperturbed analysis and a number of forecasts with perturbed initial conditions. All forecast members were assigned equal weights (Park et al., 2007). The consequent inference is based on the principle of equal probability of selection. The original medium-range forecasts were interpolated to areal averages of ten sub-catchments to be used as inputs for the Grid-Xinanjiang model. Buizza (2008) pointed out that consistency between forecasts issued on consecutive days is a desirable property of a forecasting system, therefore we examined the feature by visually comparing Pf of small, moderate and heavy precipitation with thresholds per day of www.adv-geosci.net/29/61/2011/
H.-J. Bao et al.: Coupling ensemble weather predictions
65
Fig. 3. Threat Score (top) and Bias Error (bottom). Yes/no forecast verification of the three category precipitation obtained from CMC, CMA, ECWMF, UKMO, NCEP and their grand ensemble (GrandE) over the Xixian catchment.
0.0∼9.9 mm, 10∼24.9 mm, over 25 mm, respectively. These thresholds are defined by the National Meteorological Centre of CMA. In this paper, the threat scores (TS) method (Zhao et al., 2010) was employed to evaluate the performance of the five weather centres and their grand ensemble. TS ranges from 0 to 1, with 0 indicating no skill and 1 perfect. Figure 3 shows the dichotomous forecast verification of the three category precipitation obtained from five EPSs and grand ensemble over Xixian catchment. TS (Fig. 3, top) shows that the five EPSs and grand ensemble have diferent peformance. Scores of CMA, ECMWF and NCEP, ranged from 0.46 to 0.67 for TS and from 0.92 to 1.49 for bias score (B) with lead times ranging from 24 h to 240 h, are slightly better than that of CMC and UKMO for small precipitation. In the range of moderate precipitation, UKMO performs better than other 4 centres. Five EPSs all have the TS value below 0.30 for heavy precipitation, which indicated that these events were rarely captured. Grand ensemble has a slightly better TS value than CMA and CMC. 4.2
Discharge simulation
Figure 4 shows the area mean Pf issued at 12:00 UTC 11 July 2007 and resulting Qf at the Xixian station using ECMWF. All ECMWF forecast members issued on 12 July 2007 displayed the best agreement for the rainfall event ocwww.adv-geosci.net/29/61/2011/
curred on 13 July 2007. Similarly, the amount and timing of the rainfall between 13 July 2007 and 15 July 2007 were best forecasted with a 2-day lead time, i.e. from 14 July 2007 to 16 July 2007. For lead times longer than two day, the 51 ECMWF forecast members demonstrated a fairly consistent signal representing an intensive rainfall event but one could not tell the exact date and time it was to occur as the spread of forecast members was rather large. For example, forecasts issued on 11 July 2007 indicated a large precipitation event would possibly occur on 14 July 2007. Less than 10% of the forecast members predicted it was to occur on 15 July 2007. The situation improved on 13 July 2007 when most forecast members clustered closer to each other than on the previous day of issue (over 70% members agreeing on 15 July 2007). Disagreements between probabilistic and single forecasts can be used as an indication of potentially low predictability (Buizza, 2008) and vice versa. The progress of agreement amongst forecast members evolved from longer to shorter lead times demonstrates the EPS forecasts become more predictable as it is getting closer to the actual event. In comparison to the observed discharge, the ensemble of Qf was underestimated by approximately 10–30% for all forecast members varying from day to day. In this study, Q50 is very comparable with the Qsim−raingauge for ECWMF.
Adv. Geosci., 29, 61–67, 2011
66
H.-J. Bao et al.: Coupling ensemble weather predictions
Fig. 4. Ensemble precipitation forecasts issued on 11 July 2007 by “ECWMF” (lower) and ensemble forecast discharges (upper) in comparison with observation.
Fig. 5. The warning table for the studied flood event. The six horizontal bars from bottom to top represent the five centres (CMC, CMA, ECWMF, UKMO, NCEP), and the ensemble of the five forecast centres.
The ensemble of Qf was evaluated using a warning table, where observations were compared with simulations. The warning table shows the forecasts ability to predict the individual events. The studied flood event is well predicted by all centres with a few days in advance (see Fig. 5). Making use of multiple centres from the TIGGE archive did not always show a better performance than using a single EPS centre. This indicates grand ensemble does not necessarily lead to a better performance than a single EPS. Techniques for combining multiple centres should be investigated in the future.
Adv. Geosci., 29, 61–67, 2011
5
Conclusion and outlook
A coupled atmospheric-hydrologic flood forecast model driven by the TIGGE ensemble forecasts is set up to study the potential benefits of using the TIGGE database in flood forecasting in the upper reaches of Xixian catchment during the 2007 flood season. Grid-Xinanjiang model is applied for forecasting rainfall-runoff process. The results demonstrate (1) the Grid-Xinjiang model can perform well for flood simulation and forecasting in the Xixian catchment. (2) The TIGGE archive is a promising tool for issuing a fairly reliable www.adv-geosci.net/29/61/2011/
H.-J. Bao et al.: Coupling ensemble weather predictions warning as early as 10 days in advance with producing forecasts of discharge comparable with the observed discharge. The reliability of the forecast can be improved at longer lead times, which holds great benefit for flood management and preparedness. Techniques to deal with multi-model forecasts need to be developed. In this study, the principle of equal probability of selection was applied. Multiple EPS inputs should be used with great caution as they have different error structures and can’t be easily combined (Cloke and Pappenberger, 2009). Different weather forecasts may be assigned a different weight coefficient, which might improve the performance of the grand ensemble. Acknowledgements. This work was supported by the Special Fund for Public Welfare (Meteorology) of China (Grant number: GYHY201006037 and GYHY200906007) , and the Innovation China UK (ICUK) programme (Grant number KCL24). Thanks to several reviewers for their help reviews; through their comments and suggestions this paper was substantially improved. Edited by: J. Thielen-del Pozo Reviewed by: G. Thirel and another anonymous referee
References Band, L. E.: Topographic partition of catchments with digital elevation models, Water Resour. Res., 22(1), 15–24, 1986. Buizza, R.: The value of probabilistic prediction, Atmospheric Science Letters Special Issue: HEPEX Workshop: Stresa, Italy, 9, 36–42, 2008. Cloke, H. L. and Pappenberger, F.: Evaluating forecasts for extreme events for hydrological applications: an approach for screening unfamiliar performance measuresm, Meteorol. Appl., 15(1), 181–197, 2008. Cloke, H. L. and Pappenberger, F.: Ensemble flood forecasting: a review, J. Hydrol., 375, 613–626, 2009. Cunge, K. A.: On the subject of a flood propagation method (Muskingum Method), J. Hydrau. Res., 7, 205–230, 1969. Demeritt, D., Cloke H., Pappenberger F., Thielen J., Bartholmes J., and Ramos M.: Ensemble predictions and perceptions of risk, uncertainty, and error in flood forecasting, Environmental Hazards, 7(2), 115–127, 2007. DKKV: Flood Risk Reduction in Germany, Lessons Learned from the 2002 Disaster in the Elbe Region, Summary of the Study, Deutsches Komitee fuer Katastrophen vorsorge (DKKV) (German Committee for Disaster Reduction), Publication 29e, Bonn, Germany, 2004. Goswami, M., O’Connor, K., and Bhattarai, K.: Development of regionalisation procedures using a multi-model approach for flow simulation in an ungauged catchment, J. Hydrol., 333(2–4), 517– 531, 2007.
www.adv-geosci.net/29/61/2011/
67 He, Y., Wetterhall, F., Cloke, H. L., Pappenberger F., Wilson M., Freer J., and Mcgregor G.: Tracking the uncertainty in flood alerts driven by grand ensemble weather predictions, Meteorological Applications, Special Issue: Flood Forecasting and Warning, 16(1), 91–101, 2009. He, Y., Wetterhall, F., Bao, H. J., Cloke, H. L., Li, Z. J., Pappenberger, F., Hu, Y. Z., Manful, D., and Huang, Y. C.: Ensemble forecasting using TIGGE for the July-September 2008 floods in the Upper Huai catchment: a case study, Atmos. Sci. Lett., 11, 132-138, doi:10.1002/asl.270, 2010. Li, Z. J., Cheng, Y., and Xu, P. Z.: Application of GIS-based hydrological models in humid catchments, Water for Life: Surface and Ground Water Resources, Proceedings of the 15th APD-IAHR & ISMH, 685–690, Madras, 2006. Wang, L. L., Li, Z. J., and Bao, H. J.: Application of hydrological models based on DEM in the Yihe catchment, J. Hydrol. Eng., 37(S1), 417–422, 2007 (in Chinese). Penning-Rowsell, E., Tunstall, S., Tapsell, S., and Parker, D.: The benefits of flood warnings: Real but elusive, and politically significant, J. the Chart. Inst. Water Environ. Manage. , 14, 7–14, 2000. Park, Y. Y., Buizza, R., and Leutbecher, M.: TIGGE: preliminary results on comparing and combining ensembles, ECMWF TM 548, European Centre for Medium-Range Weather Forecasts (ECWMF), Reading, UK, 2007. Parker, D. and Fordham, M.: Evaluation of flood forecasting, warning and response systems in the European Union, Water Resour. Management, 10, 279–302, 1996. Pitt, M.: Learning Lessons from the 2007 floods: An independent review by Sir Michael Pitt: interim report, London, UK, 2007. Roulin, E.: Skill and relative economic value of medium-range hydrological ensemble predictions, Hydrol. Earth Syst. Sci., 11, 725-737, doi:10.5194/hess-11-725-2007, 2007. The Ministry of Water Resources of the People’s Republic of China (MWR): Standard for hydrological information and hydrological forecasting (SL 250–2000), Hydraulic and Hydropower Publisher of China, Beijing, 18–21 2000 (in Chinese). Van Berkom, F., van de Watering, C., de Gooijer, K., and Neher, A.: Inventory of Flood Information Systems in Europe – a study of available systems in Western-, Central- and Eastern Europe, INTERREG IIIC Network Flood Awareness and Prevention Policy in Border Areas’ (FLAPP), The Netherlands, 2007. Yao, C., Li, Z. J., Bao, H. J., and Yu, Z. B.: Application of a developed Grid-Xin’anjiang model to Chinese catchments for flood forecasting purpose, J. Hydrol. Eng., 14(9), 923–934, 2009. Zhao, L. N., Wu, H., Tian, F. Y., Qi, D., Di, J. Y., Duan, Q. Y., and Wang, Z.: Assessment of Probabilistic Precipitation Forecasts for HUAIhe Catchment Using TIGGE Data, Meteor. Mon., 36(7), 133–142, 2010 (in Chinese). Zhao, R. J.: The Xin’anjiang model applied in China, J. Hydrol., 135(1-4), 371–381, 1992. Zhao, R. J. and Liu, X. R.: The Xinanjiang model, in: Computer Models of Catchment Hydrology, edited by: Singh, V. P., Water Resources Pubns, 1995.
Adv. Geosci., 29, 61–67, 2011