Aug 26, 2016 - the sensitivity of rock permeability, porosity and their relationships to the ... Figure 3 (a) Distribution of chord length in the solid phase for ... Mostaghimi, P., Percival, J. R., Pavlidis, D., Ferrier, R. J., Gomes, J. L., Gorman, G.
SCA2016-086
1/6
COUPLING LATTICE BOLTZMANN AND FINITE VOLUME METHODS FOR SIMULATION OF REACTIVE TRANSPORT Min Liu, Peyman Mostaghimi School of Petroleum Engineering, The University of New South Wales, NSW 2052, Sydney, Australia This paper was prepared for presentation at the International Symposium of the Society of Core Analysts held in Snowmass, Colorado, USA, 21-26 August 2016
ABSTRACT A numerical model is developed to study reactive transport at pore scale. It couples lattice Boltzmann and finite volume methods to compute fluid flow and reaction processes. The model is validated by comparing numerically simulated reactive flow against the published results of dynamic imaging of carbonate dissolution. The porosity profiles and permeability-porosity relationship are compared with the experimental results. The variation of the porous structure is quantitatively analysed and compared with those obtained from dynamic imaging experiments. The findings show that the numerical framework provides robust and accurate prediction of porous media alteration due to flow of reactive fluids and can be used as a predictive tool for resolving reaction mechanisms in porous media with applications in reservoir engineering, carbon dioxide sequestration, hydrological and environmental studies.
INTRODUCTION Reactive transport in porous media is of great importance in a wide range of science and engineering applications including reservoir engineering, carbon dioxide sequestration, hydrogeological and environmental studies. Chemical reactions at the pore scale can dramatically alter the pore structure and change the petrophysical properties of reservoir rocks [1]. Pore scale modelling methods for reactive transport studies include network modelling and direct modelling [2]. Pore network modelling has been used to study the permeability and porosity variation due to reaction [3,4], but it cannot accurately predict the alteration of local microstructure in very heterogeneous porous media [5]. Direct modelling addresses this issue by simulating fluid flow directly in voxels of microcomputed tomography (micro-CT) images. As the most popular method of direct simulation, the lattice Boltzmann (LB) method has been widely used to investigate the dissolution and precipitation in two-dimensional porous media [6,7]. Apart from the LB approach in direct simulation, finite difference, volume and element methods [8-11] and
SCA2016-086
2/6
particle-tracking methods [12,13] have been applied to simulate flow and predict reaction rates in porous media. However, numerical model with the lattice Boltzmann method have mainly focused on 2D geometries. Although 3D investigations of reactive flow have been performed by other direct modelling methods [13], the maximum size of the microCT image is limited due to computational limitations. In this paper, an efficient pore scale model is developed for simulating the reactive transport directly on 3D micro-CT images. We simulate reactive transport directly on the micro-CT image and compare our results with published dynamic micro-CT imaging performed at Imperial College London [14].
MATHEMATICAL FORMULATIONS The Lattice Boltzmann method and Finite Volume method are coupled in Fortran codes to calculate fluid flow and chemical reaction directly on micro-CT images. Lattice Boltzmann Simulation of Flow We use the lattice Boltzmann method based on D3Q19 to solve the incompressible fluid flow [9] by applying the discrete Boltzmann equation, 1 !" (1) 𝑓! 𝒙 , 𝑡 − 𝑓! 𝒙 , 𝑡 , 𝜏 where fi is the distribution function along the i-direction, ei is the discrete lattice velocity, ∆𝑡 is the time step, τ is the relaxation time parameter and fieq is the equilibrium distribution function. The fluid flow density and velocity can be calculated by 𝜌 = ! 𝑓! ! and 𝒗 = ! 𝒆! 𝑓! , respectively. The no-slip boundary condition is enforced at the solid 𝑓! 𝒙 + 𝒆! ∆𝑡, 𝑡 + ∆𝑡 − 𝑓! 𝒙 , 𝑡 = −
!
surface by applying the bounce-back scheme [15]. The solution obtained based on the lattice Boltzmann simulations reproduces the incompressible Newtonian Navier-Stokes ! 1 equations with constant kinematic viscosity of ! (𝜏 − 2) [16]. Finite Volume Simulation of Reaction The solute concentration can be updated by solving the advection-diffusion equation, 𝜕𝐶 (3) + 𝑣 ∙ ∇ 𝐶 = ∇ ∙ 𝐷∇𝐶 , 𝜕𝑡 in which C [mol m-3] is concentration and D [m2s-1] is the diffusion coefficient. A finite volume scheme is applied to discretize the concentration equation on micro-CT images. The first order kinetic is enforced at solid surface via 𝐶(𝑡 + ∆𝑡) − 𝐶(𝑡) (4) = −𝜅 𝐶(𝑡) − 𝐶! , ∆𝑥 where κ [ms-1] is the reaction rate constant, Δx [m] is the image resolution, Δt [s] is time step, and Cs [mol m-3] is the saturated concentration. 𝐷
SCA2016-086
3/6
The solid volume fraction update is related with the reaction flux by 𝑝(𝑡 + ∆𝑡) − p(𝑡) (5) = −𝑉! 𝑆𝜅 𝐶(𝑡) − 𝐶! , ∆𝑡 where p is the solid volume fraction, Vm [m3 mol-1] is the molar volume, and S [m-1] is the specific surface area. The concentration is initially set to 𝐶= 0.79 mol m-3 and a Dirichlet boundary condition is applied at the inlet. Table 1 provides the constant values used in the simulations to reproduce the experimental reactive and transport regimes. For more details regarding the mathematical formulation and the numerical method, refer to [9]. Pe 2100
Table 1. Reaction and transport parameters used for simulations Reaction rate constant[ms-1] Diffusion coefficient[m2s-1] Characteristic length[m] -7 1.08×10 7.5×10⁻¹⁰ 4.07×10⁻⁴
Da 0.05
RESULTS The numerical results for reactive transport are compared with dynamic imaging experiment of a Ketton carbonate dissolution performed at Imperial College London [14]. The Peclet and Damkohler numbers are set to be identical to the experimental conditions; Pe=2100 and Da=0.05. The developed numerical method with no tuning parameter and only setting the Peclet and Damkohler numbers can reproduce the experimental observations. Note that the Peclet and Damkohler numbers are the dimensionless number characterising the regimes of transport and reaction, respectively. The dissolved core sample and orthogonal slices are presented in Figure 1, which demonstrate a uniform dissolution. Our numerical results show very similar uniform dissolution pattern as observed in the experiment observations using identical reaction parameters.
(a)
(b)
(c)
Figure 1 The 3D carbonate geometry after dissolution; (a) the full sample after 50 min, and orthogonal slices of (b) experiments, (c) simulation after 50 min of reaction.
The comparison of porosity variations between the numerical results and experimental measurements is demonstrated in Figure 2(a). There is minor difference between the predicted porosity and the experimental observations and on average our results show 3.8% difference to the experimental measurements.
SCA2016-086
4/6
21
0.45
Simulation Normalised permeability
0.4 0.35
0.3
Porosity
0.25 0.2
0.15 Simulation(t=149min) Experiment(t=149min) Before reaction Simulation(t=17min) Experiment(t=17min)
0.1
0.05 0
0
500
1000
1500
2000
2500
Distance from inlet[µm]
3000
3500
Experiments
16
11
6
1 1
1.2
1.4
1.6
1.8
Normalised porosity
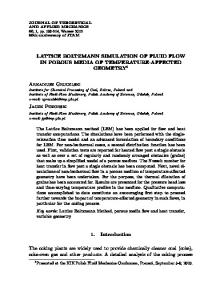
(a) (b) Figure 2 (a) Porosity profiles across layers normal to the main direction of flow before reactions (red); after 17 min (blue); and 149 min (black) of reaction. Solid lines are experimental measurements and dash lines are simulation results. (b) Permeability-porosity relationships of experiment and numerical results (Normalised porosity and permeability are calculated as the ratio of the porosity and permeability of the sample divided by the initial values).
The permeability-porosity relationship of both experimental and simulation results are shown in Figure 2(b). The value of n in the power-law correlation (K=ϕn) is calculated as 4.58 for the experiment and for the simulation, the exponent is 4.83 (5.4% difference). The simulation results match very well with those calculated from experimental data. In our recent published work [9], we have applied the numerical method to analyse the sensitivity of rock permeability, porosity and their relationships to the Peclet and Damkohler regimes. It was shown that the values and scaling of rock permeability and porosity is strongly dependent upon the reaction and transport regimes as well as the rock heterogeneity. During the process of reaction, the microstructure of the pore space changes. The chord length distribution can be used to discriminate the pore structure of porous media by presenting the probability of forming a random chord length in the pore space. Chord length is described as the length of any line-segment lying in one specific phase with its endpoints at the phase interface [17]. The chord length distribution is measured directly on the images of experiments and simulation results to reflect the pore structure alteration during the dissolution. The chord length distributions of simulation and experiments in solid phase are presented in Figure 3(a). The distribution of the predicted chord lengths is identical to that of experimental measurements after 149 min of reaction. Critical radius is defined as the radius of the largest sphere percolating through a porous medium from one side to the opposite one. A larger critical radius indicates a better connectivity of the porous media. We calculate the critical radius from images of experiments and results from simulations after different time of dissolution as shown in Figure 3(b). All the values are normalised by the critical radius of the original image prior to reaction. As can be seen in the figure, the critical radius of simulation shows a very
2
SCA2016-086
5/6
similar trend to the one in experiments. This justifies the good match between numerical simulations of permeability and experimentally measured permeability since permeability is strongly correlated with the critical radius. The average difference of the numerical prediction and experimental results is less than 6% during the reaction process. In brief, critical radius and chord length are applied as two quantities expressing the morphological changes of the porous structure due to dissolution. The observed variations justify the permeability increase due to reaction; the critical radius increases with time which means larger throats are available for fluid flow and the probability of short chord lengths in the solid phase increases indicating occurrence of dissolution. 0.012
4
Frequency
Normalised critical radius
Experiments after 149min
0.01
Simulation after 149 min
0.008
Before reaction
0.006 0.004 0.002 0 0
1
2
Chord length(mm)
3
4
3.5 3 2.5 2 1.5
Experiments
1
Simulation
0.5 0 0
50
100
150
200
Time(min)
(a) (b) Figure 3 (a) Distribution of chord length in the solid phase for experiments and simulations; (b) Variation of critical radius of experiments and simulation with time.
CONCLUSION We have developed a numerical model to simulate the reactive flow on micro-CT images of carbonate. We compare the numerical results with dynamic imaging observations to validate the model. The permeability-porosity relationship of simulations and experiments are measured. The predicted permeability in the simulations presents very good agreement with the experimental measurements. The local porosities and chord length distribution as well as critical radius in simulation match very well with experimental measurements. The numerical framework coupling lattice Boltzmann method and finite volume formulations can accurately predict the reactive flow and provide important understanding in pore scale reactive transport.
REFERENCES 1. Noiriel, C., Gouze, P. and Bernard, D., "Investigation of porosity and permeability effects from microstructure changes during limestone dissolution." Geophysical Research Letters, (2004) 31, 24. 2. Blunt, M.J., Bijeljic, B., Dong, H., Gharbi, O., Iglauer, S., Mostaghimi, P., Paluszny, A. and Pentland, C., "Pore-scale imaging and modelling." Advances in Water Resources, (2013) 51, 97-216.
SCA2016-086
6/6
3. Algive, L., Bekri, S. and Vizika, O., "Pore-network modeling dedicated to the determination of the petrophysical-property changes in the presence of reactive fluid." SPE Journal, (2010) 15, 03, 618-633. 4. Varloteaux, C., Békri, S. and Adler, P.M., "Pore network modelling to determine the transport properties in presence of a reactive fluid: From pore to reservoir scale." Advances in Water Resources, (2013) 53, 87-100. 5. Dong, H. and Blunt, M.J., "Pore-network extraction from micro-computerizedtomography images." Physical Review E, (2009) 80, 3, 036307. 6. Kang, Q., Chen, L., Valocchi, A.J. and Viswanathan, H.S., "Pore-scale study of dissolution-induced changes in permeability and porosity of porous media." Journal of Hydrology, (2014) 517, 1049-1055. 7. Chen, L., Kang, Q., Tang, Q., Robinson, B.A., He, Y.L. and Tao, W.Q., "Pore-scale simulation of multicomponent multiphase reactive transport with dissolution and precipitation." International Journal of Heat and Mass Transfer, (2015) 85, 935-949. 8. Maheshwari, P., Ratnakar, R.R., Kalia, N. and Balakotaiah, V., "3-D simulation and analysis of reactive dissolution and wormhole formation in carbonate rocks." Chemical Engineering Science, (2013) 90, 258-274. 9. Mostaghimi, P., Liu, M, Arns, C.H., "Numerical simulation of reactive transport on micro-CT images." Mathematical Geosciences, (2016), doi:10.1007/s11004-016-9640-3. 10. Molins, S., Trebotich, D., Steefel, C.I. and Shen, C., "An investigation of the effect of pore scale flow on average geochemical reaction rates using direct numerical simulation." Water Resources Research, (2012) 48, W03527. 11. Mostaghimi, P., Percival, J. R., Pavlidis, D., Ferrier, R. J., Gomes, J. L., Gorman, G. J., Jackson, M. D., Neethling, S.J. and Pain, C. C., “Anisotropic mesh adaptivity and control volume finite element methods for numerical simulation of multiphase flow in porous media.” Mathematical Geosciences, (2015), 47(4), 417-440. 12. Paster, A., Bolster, D. and Benson, D.A., "Particle tracking and the diffusion-reaction equation." Water Resources Research, (2013) 49, 1, 1-6. 13. Pereira Nunes, J.P., Blunt, M.J. and Bijeljic, B., "Pore-scale simulation of carbonate dissolution in micro-CT images." Journal of Geophysical Research: Solid Earth, (2016) 121, 558–576. 14. Menke, H.P., Bijeljic, B., Andrew, M.G. and Blunt, M.J., "Dynamic threedimensional pore-scale imaging of reaction in a carbonate at reservoir conditions." Environmental Science & Technology, (2015) 49. 7, 4407-4414. 16. Martys, N.S. and Chen, H., "Simulation of multicomponent fluids in complex threedimensional geometries by the lattice Boltzmann method." Physical Review E, (1996) 53, 1, 743. 17. Chen, S., Wang, Z., Shan, X. and Doolen, G.D., "Lattice Boltzmann computational fluid dynamics in three dimensions." Journal of Statistical Physics, (1992) 68, 3-4, 379400. 18. Arns, C.H., Bauget, F., Limaye, A., Sakellariou, A., Senden, T., Sheppard, A., Sok, R.M., Pinczewski, V., Bakke, S., Berge, L.I. and Oren, P.E., "Pore scale characterization of carbonates using X-ray microtomography." SPE Journal, (2005) 10, 04, 475-484.