Original articles
Course setting and selected biomechanical variables related to injury risk in alpine ski racing: an explorative case study Jörg Spörri, Josef Kröll, Hermann Schwameder, Christian Schiefermüller, Erich Müller ▸ Additional supplementary files are published online only. To view these files please visit the journal online (http://dx.doi. org/10.1136/bjsports-2012091425). Department of Sport Science and Kinesiology, Christian Doppler Laboratory: Biomechanics in Skiing, University of Salzburg, 5400 Hallein-Rif, Austria Correspondence to Jörg Spörri, Department of Sport Science and Kinesiology, Christian Doppler Laboratory: Biomechanics in Skiing, University of Salzburg, Schlossallee 49, 5400 HalleinRif, Austria;
[email protected] Accepted 16 August 2012 Published Online First 14 September 2012
ABSTRACT Background Course setting has often been discussed as a potential preventative measure in the World Cup skiracing community. However, there is limited understanding of how it is related to injury risk. Objective This study was undertaken to investigate the effect of increased horizontal gate distance on energyrelated and injury mechanism-related variables. Methods During a video-based three-dimensional (3D)-kinematic field measurement, a top world-class racer performed giant slalom runs at two course settings with different horizontal gate distances. A full-body segment model was reconstructed in 3D and selected biomechanical parameters were calculated. Results For the analysed turn, no significant differences were found in turn speed for increased horizontal gate distance. However, a large effect size was observed for speed reduction towards the end of the turn. Turn forces were by tendency higher at the beginning and significantly higher towards the end of the turn. Additionally, significant differences were found in higher inward leaning, and large effect sizes were observed for a decreased fore/aft position after gate passage. Conclusions On the basis of the data of this study, no final conclusion can be made about whether, for a section of consecutive turns, increasing horizontal gate distance is an effective tool for speed reduction. However, this study pointed out two major drawbacks of this course setting modification: (1) it may increase fatigue as a consequence of loading forces acting over a longer duration; (2) it may increase the risk of out-ofbalance situations by forcing the athlete to exhaust his backward and inward leaning spectrum.
INTRODUCTION Injuries in alpine skiing have been a serious concern since the very beginning of the sport. Assessed over many decades, incidence, severity, aetiology and injury prevention strategies for recreational skiers are well documented.1–13 In contrast, there are only a few papers addressing the area of elite competitive ski racing.14–18 Data by the International Ski Federation (FIS) Injury Surveillance System (ISS) illustrated an alarmingly high injury risk for World Cup (WC) alpine ski racers. Over the WC seasons 2006/2007 and 2007/2008 injury rates of 36.7 per 100 athletes were reported.15 The most commonly injured body part was found to be the knee (35.6%), and the rupture of the anterior cruciate ligament (ACL) was the most frequent specific diagnosis.15 Recently, three distinctive mechanisms of ACL injuries in WC ski racing were identified: ‘slip-catch’, ‘dynamic Br J Sports Med 2012;46:1072–1077. doi:10.1136/bjsports-2012-091425
snowplough’ and ‘landing back weighted’.17 Characteristically, for the ‘slip-catch’ and ‘dynamic snowplough’ mechanisms, the racer initially lost balance backward and inward. Then, while trying to regain grip, the inside edge of either the outer or inner ski caught abruptly in the snow, forcing the knee into valgus and internal rotation. In order to reduce the risk of these injury mechanisms, measures that can reduce the energy involved in the injury situations, may be effective prevention clues.17 18 Moreover, high skiing speeds, large forces and critical factors that contribute to out-ofbalance situations were suggested to play a central role in ACL injury mechanisms.17 18 One potential preventative measure that approaches the energy involved and that is widely discussed among the ski racing community, is course setting.19 Course setting has already been shown to influence skiers’ energy in an earlier study of alpine skiing technique in slalom.20 In the context of injury prevention, course setting became even more important with the introduction of side cut to racing skis, which allowed the racers to carve tighter turns with less friction and to retain speed in situations where previously they skidded and lost speed.21 In an attempt to keep speed within a safe range in giant slalom (GS), horizontal gate distances became apparently greater over the last decade and the racers had to turn more out of the direction of the fall line. However, it is neither obvious how increased horizontal gate distance influences energy-related variables such as turn speed, nor how it effects injury mechanism-related variables like acting forces and uncontrolled backward and/or inward leaning. The current study is the first study to address this topic in the context of injury prevention; therefore, the purpose of this explorative case study was to investigate the effect of increased horizontal gate distance on energy-related and injury mechanism-related variables in GS.
METHODS Data collection During a three-dimensional (3D) kinematic field measurement using a system of five panned, tilted and zoomed video cameras (50 Hz, time synchronised by a gen-lock signal) a top world-class racer performed a total of 12 runs on an injected 15 gate course. After six gates accelerating the racer up to average GS speeds, the racer entered a five-gate section with constant slope inclination of 27.5°. Within this section, gate distances were modified after the first six runs. Initial gate distances were 1 of 6
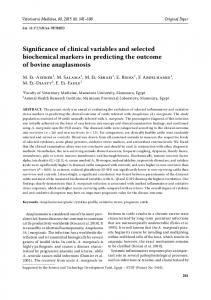
Original articles Figure 1 Schema of the measurement setup (CAM 1–5: positions of the panned, tilted and zoomed camcorders).
26 m in vertical direction with an offset of 12 m and were changed for another six runs to 26/10 m (figure 1). These two course settings represent the two extremes of the horizontal gate distance spectrum, common for similar conditions in WC ski racing. In order to determine the skier’s 3D position data, a total of 78 reference points were geodetically measured and used to calibrate a capture volume corridor of 52×12×2 m around the analysed turn, which was situated in the middle of the modified five-gate section (figure 1). A 28-point body segment model and the three best visible geodetic measured reference points were manually digitised in each frame of each camera. Joint centres of the segment model were defined according to de Leva.22 Finally, the skier’s segment model was reconstructed in 3D, using the software PEAK MOTUS and a direct linear transformation (DLT)-based Panning Algorithm by Drenk.23
λLean was then calculated as the angle between the z-axis and the ski-COM vector projected to the y−z plane (figure 3). dFore/Aft was defined as the cosine of the fore/aft angle, which is the angle between the z-axis and the ski-COM vector projected to the x−z plane (figure 3). Instant relative centripetal force (Fcp) was calculated based on vCOM and RCOM.
Statistical analysis Owing to the explorative character of this study, the following steps of statistical analysis were performed: (1) turn average and peak values of the selected parameters were described with
Parameter calculation Parameter calculation was performed using the software MATLAB R2009b. Centre of mass (COM) was calculated based on the model of Clauser et al,24 adapted with the skiing equipment. Based on the COM line deviations, COM turn radius (RCOM) and COM speed (vCOM) were calculated numerically.25 As proposed by Supej et al,26 the crossing points of the COM line projected to the slope plane and the ski line were defined as the beginning (a) and end (e) of the turn (figure 2). Furthermore, the first point where RCOM was ≤30 m (b), the point where the COM passed the gate (c) and the last point where RCOM was ≤30 m (d) were defined according to Reid et al27 with the RCOM-criterion adapted for GS. Based on these five characteristic points of the COM line and ski line, turns were divided into four turn phases and their percentages during the whole turn cycle were calculated: Initiation (a!b), COM Direction Change I (b!c), COM Direction Change II (c!d) and Completion (d!e) (figure 2). For the calculation of the lean angle (λLean) and fore/aft position (dFore/Aft), a local coordinate system (x0 y0 z0 ) at the ankle joint of the outside ski was used, as proposed by Schiefermüller et al28 (figure 3). x0 was defined by the joint ankle and the direction of the longitudinal axis of the ski. z0 was defined to be perpendicular to the slope plane and y0 was defined as forming a right-handed triad with x0 and z0 . 2 of 6
Figure 2 Definition of characteristic line points and turn phases: (COM) centre of mass; (a) beginning of the turn (crossing points of the COM line projected to the slope plane and the ski line); (b) first point where COM turn radius ≤30 m; (c) point where the COM passes the gate; (d) last point where COM turn radius ≤30 m; (e) end of the turn (crossing points of the COM line projected to the slope plane and the ski line). Br J Sports Med 2012;46:1072–1077. doi:10.1136/bjsports-2012-091425
Original articles Table 1 Mean±SD and Cohen’s d for turn averages and peak values of selected parameters related to injury risk at two different course settings
Turn averages v(Turn) COM (m/s) (N/BW) F(Turn) cp (Turn) (m) dFore/Aft (°) λ(Turn) Lean Peak values v(max) COM (m/s) (N/BW) F(max) cp (min) dFore/Aft (m) λ(max) Lean (°)
26/10 m course (mean±SD)
26/12 m course (mean±SD)
Effect sizes (Cohen’s d)
17.63±0.23 1.14±0.03 0.12±0.04 42.5±0.3
17.47±0.32 1.18±0.04 0.08±0.03 43.4±0.7*
0.564 1.000 1.011 1.643
18.14±0.21 2.17±0.20 −0.08±0.03 58.6±1.8
18.09±0.31 2.21±0.19 −0.11±0.04 58.9±1.1
0.174 0.199 0.874 0.187
*p