THE JOURNAL OF CHEMICAL PHYSICS 123, 201102 共2005兲
Coverage and nearest-neighbor dependence of adsorbate diffusion Kin L. Wong, Bommisetty V. Rao, Greg Pawin, Erick Ulin-Avila, and Ludwig Bartelsa兲 Pierce Hall, University of California, Riverside, California 92521
共Received 1 June 2005; accepted 23 September 2005; published online 30 November 2005兲 We present data on the coverage and nearest-neighbor dependences of the diffusion of CO on Cu共111兲 by time-lapsed scanning tunneling microscope 共STM兲 imaging. Most notable is a maximum in diffusivity of CO at a local coverage of one molecule per 20 substrate atoms and a repulsion between CO molecules upon approach closer than three adsites, which in combination with a less pronounced increase in potential energy at the diffusion transition state, leads to rapid diffusion of CO molecules around one another. We propose a new method of evaluating STM-based diffusion data that provides all parameters necessary for the modeling of the dynamics of an adsorbate population. © 2005 American Institute of Physics. 关DOI: 10.1063/1.2124687兴 The diffusion of adsorbates on surfaces is of fundamental importance for a wide variety of processes ranging from surface catalytic reactions1 to film growth.2 Recently, a number of novel experimental techniques3–6 addressed the adsorbate diffusion potential. In realistic systems, adsorbates are not isolated on surfaces. Various studies have pointed to a substantial impact of neighboring adsorbates on the diffusion of metal7–10 and hydrogen11 atoms as well as CO 共Refs. 12–15兲 and benzene6 molecules on metal surfaces. These studies address adsorbate diffusion in the context of pair interactions or pair potentials and find a pronounced impact of adsorbate-adsorbate interactions on the adsorbate diffusivity and the resultant distribution of pair separations. Data analysis based on the absolute value of the distance between two particles cannot, however, directly describe ensemble effects 共i.e., the dependence of diffusivity on local coverage兲 nor can it reproduce realistic diffusion pathways on surfaces, as it is inherently unable to make any predictions regarding diffusion transversal to pair vectors. In contrast to previous studies, this manuscript 共a兲 evaluates the diffusivity of CO as a function of the local coverage and 共b兲 follows the dynamic evolution of CO pairs, from which two-dimensionallyresolved information about the CO diffusion potential is obtained, that reaches fundamentally beyond the data contained in pair potentials. This sets it apart from studies based on the analysis of pair separations, in which sequential images of a surface are regarded as unrelated and, hence, the information contained in the dynamics of the adsorbate reorganization 共e.g., the distribution of diffusion directions兲 is omitted. There is a long history of the investigation of CO diffusion on copper surfaces, in which diffusion studies based on laser-induced thermal desorption 共LITD兲 play an important role.16 These studies inherently address the dynamic character of the diffusion process, yet it has been noted that a precise atomistic picture of the diffusion can only be extracted from such data, if the dependence of the diffusivity on the local coverage is known.17,18 This is provided by this study. a兲
Electronic mail:
[email protected]
0021-9606/2005/123共20兲/201102/4/$22.50
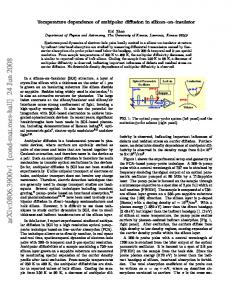
We use a homebuilt scanning tunneling microscope 共STM兲 similar to those developed by Stipe et al.19 and Meyer.20 It is housed in a UHV chamber at a base pressure below the 3 ⫻ 10−11 Torr limit of our hot-cathode ion gauge and it is capable of performing measurements between 10 and 300 K, as well as of temperature sweeps by 50 K without loosing registry of the site under investigation. Our Cu共111兲 sample is prepared by several cycles of sputtering and annealing; CO was deposited after the cooling of the sample to 30 K and the inspection of sample cleanliness by STM. It should be stressed that the image of CO molecules in STM depends strongly on the chemical nature of the tip apex:21 a bare metallic tip images a CO molecule as an indentation of the Cu substrate, whereas a tip carrying a CO molecule symmetrically at its apex sees it as a protrusion; asymmetrically decorated tips can show a superposition of both images at slight offset. Generally we find, that CO tips are more useful for work at higher CO coverages, because they better resolve the exact position of CO molecules in close vicinity 共one to three adsites兲 of one another, whereas bare metal tips work better at very low coverages, where the Cu surface-state oscillations offer additional information. We obtained a large number of movies of CO motion on Cu共111兲 共the accumulated duration of evaluated data exceeds 100 h兲 in five separate sample preparations intersected by bakeout of the system and a variety of unrelated measurements. The experimental procedure of LITD diffusion measurements can be simulated by STM at atomic resolution using a sequence of clearing of an area of a CO-covered surface using high-voltage scanning14 and subsequent time-lapsed imaging of the CO diffusion back into that area. Figure 1 shows two images from a long sequence,22 in which we followed the diffusion of molecules at the edge of a bleached area. A molecule in the middle of the bleached area 共white circle兲 diffuses at a relatively slow rate. Such molecules experience a low local coverage, i.e., they have a small number of neighbors within a radius of a few Cu–Cu distances. An increase in the local coverage to 0.05 CO molecules/ substrate atom 关monolayers 共ML兲兴 leads to an increase in the hopping rate by a factor of ⬎2 共e.g., black circle兲. When a
123, 201102-1
© 2005 American Institute of Physics
Downloaded 02 Dec 2005 to 138.23.132.101. Redistribution subject to AIP license or copyright, see http://jcp.aip.org/jcp/copyright.jsp
201102-2
Wong et al.
J. Chem. Phys. 123, 201102 共2005兲
FIG. 1. 关共a兲 and 共b兲兴 Two STM images 共1.3 V, 0.43 nA, 36 K, 75⫻ 75 Å2, 55 s/image兲 of CO molecules on a Cu共111兲 surface 共taken with a COcovered tip兲 following STM-based bleaching of the area under investigation. Molecules at low local coverage 共white circle兲 diffuse far less rapidly than molecules in areas of higher local coverage 共black circle兲. The numbers of hops occurring between acquisition of the left and right image 共38 min兲 are indicated for the highlighted molecules. At high local coverage ordered patterns form which hinder the diffusive motion of CO 共white rectangle兲. A movie encompassing these images can be found in the supporting information. 共c兲 The hopping rate of CO as a function of the number of neighboring CO molecules within a radius of 6 共䊏兲 or 8 共쎲兲 Cu–Cu distances 共2.55 Å兲 and a polynomic fit of the data 共dashed line兲. Also shown is a Monte Carlo simulation of the hopping rate based on diffusion data of individual molecules 共open symbols, dotted linear fit兲.
large number of CO molecules are in close vicinity to one another, they form an ordered pattern, in which they hinder each other’s diffusive motion 共white rectangle兲, which leads to a significant reduction in their diffusion rate. Figure 1共c兲 shows the variation of the diffusivity of CO with coverage, which underlines the substantial impact of the local coverage on the behavior of adsorbate surfaces. Unfortunately, even the most advanced densityfunctional theory codes often cannot find the correct equilibrium on-top position of CO on Cu共111兲 共in contrast to many other, well-described adsorbate/substrate combinations兲.23 This fact puts it beyond the scope of this study to find a theoretical underpinning of the phenomenon observed. We wish to mention, however, that vibrational excitation transfer, as common for CO on halides,24 is not likely to be the case here given the ultrashort vibrational relaxation times for CO / Cu共111兲.25 Rather than looking for a theoretical description of the fundamental processes leading to the observed increase in diffusivity, we address this question experimentally by preparation of very low coverages of CO / Cu共111兲 of ⬇0.003 ML, we can investigate the interaction between a CO molecule and its nearest neighbor without excessive impact of more remote CO molecules 关Fig. 2共a兲兴.22 If an analysis in the context of pair potentials is chosen 共as presented by Repp et al.,7 Mitsui et al.,12 etc.兲, the distribution of separations between adsorbates is extracted from such im-
FIG. 2. 共a兲 STM image 共300 mV, 50 pA, 40 K, 5 ⫻ 4 nm2, 53 s/image兲 of a low coverage of CO / Cu共111兲. The sequence on the right shows selected snapshots of the evolution of the center pair of molecules at intervals of several frames. The supporting information contains a movie encompassing these images. 共b兲 Distribution of diffusion rates of a CO molecule in the vicinity of another one located at the bottom left of the graph. The polar diagrams at each on-top adsite indicate the diffusion rate in the respective direction. At close CO–CO separation, diffusion with a component transversal to the CO–CO vector is strongly enhanced. This manifests itself as the molecule’s dancing around one another as observed in panel a. The different CO–CO separations are color coded. 共c兲 Dependence of the CO hopping rate on the position of the nearest-neighboring CO molecule. At separations larger than three Cu–Cu distances, the assignment of specific relative adsites is not possible with sufficient certainty and only averaged values for all molecules in a certain separation interval are indicated.
ages. The Fourier transformation of the resultant pair distribution function yields the pair potential, i.e., the attractive or repulsive interaction between neighboring adsorbates of varying separation. Rather than proceeding along that avenue, we analyze several thousand hopping events at a fixed temperature 共40 K兲 and obtain the hopping rate and direction of CO diffusion in dependence on the vector to the nearest neighbor. Figure 2共b兲 shows the hopping rate of a CO molecule in the vicinity of another CO molecule as polar plots anchored at each possible CO–CO vector. The color of the polar diagram encodes the CO–CO separation, and the size of the polar vectors indicates the rate of hopping in the direction it points
Downloaded 02 Dec 2005 to 138.23.132.101. Redistribution subject to AIP license or copyright, see http://jcp.aip.org/jcp/copyright.jsp
201102-3
Coverage and nearest-neighbor dependences of adsorbate diffusion
J. Chem. Phys. 123, 201102 共2005兲
FIG. 3. Arrhenius plot of the diffusion of isolated CO molecules. The vertical error bars reflect the statistical error of the measurement, the horizontal error bar allows for an uncertainty of ±1 K in the temperature measurement. The diffusion barrier Ea and the attempt frequency A are indicated along with their fit uncertainties.
to. For instance, at 冑3 separation 关mint-colored polar plot of Fig. 2共a兲兴, we find slow diffusion 共short vector in the polar plot兲 towards the nearest-neighbor sites but rapid diffusion 共long vector in the polar plot兲 towards sites of 2 and 冑7 separation. In summary, this data set shows a strong variation of the hopping rate with separation from the nearest neighbor 关as summarized in Fig. 2共c兲兴 as well as a pronounced anisotropy of the diffusion direction, especially at 冑3 separation. Compared to isolated CO molecules, we find accelerated diffusion in the vicinity of a neighboring CO molecule, not only in the radial CO–CO direction but also transversal to the CO–CO vector 共e.g., see the polar diagram at 冑3 separation兲. The latter observation is beyond models based on the analysis of pair separations. Temperature-dependent measurements of the diffusion rate of isolated molecules offer us direct information about the diffusion potential Udiff for CO / Cu共111兲 in the absence of neighbor interactions 共Fig. 3兲. The resultant barrier height is 75± 5 meV and the attempt frequency is 共5.3± 0.4兲 ⫻ 107 Hz, which is very low compared to many other attempt frequencies but well in line with the data of Briner et al.13 for CO / Cu共110兲 共3 ⫻ 107 Hz兲 and the data of Heinrich et al.5 for CO chevrons on Cu共111兲 共2.5⫻ 105 Hz兲. If we assume that all six diffusion directions have the same attempt frequency 共of 1 / 6 of the frequency observed for diffusion in any of the six possible directions兲, then for each diffusion direction shown in Fig. 2共b兲 we can calculate the diffusion barrier 共Ubridge兲. We wish to point out that this is an approximation only and that possible differences in the entropy associated with the diffusion transition state may actually affect the prefactors. Once all the barriers are known, the variation of the potential energy at each adsite 共Uon top兲 can be reconstructed. Figure 4 shows the resultant values. They are in agreement with the analysis of the distribution CO–CO separation according to the method described previously.7,12 The interpolation of the potential in Fig. 4 assumes truncated harmonic oscillators at each adsite, whose force constant varies with the oscillation direction to reflect the different diffusion probabilities. From this assumption, we can extrapolate the diffusion potential at the hollow sites 共Uhollow兲 共which are unfavorable for CO adsorption兲.5,26 Knowledge about Uhollow, Uon top, and Ubridge permits us to
FIG. 4. 共Top兲 The diffusion potential of a CO molecule in the vicinity of another one located at the center of the plot 共left兲 and its difference from the unperturbed potential 共right兲. An example of the relative positions between CO molecules is shown in the inset. All energy values are measured with respect to the adsite in the unperturbed case 共Uon top = 0兲. The black rectangle highlights an area of repulsive interaction between the molecules, which is more pronounced at the adsites than at the diffusion transition states. This amounts to a lowering of the barrier for diffusion transversal to the CO–CO vector. The white rectangle demarks an area of attractive interaction at 冑7 separation. 共Bottom兲 A horizontal cut through the center of the potentialenergy surface. This resembles the information that can be obtained by analysis of CO–CO separations only; it does not contain information on diffusion with a tangential component.
reconstruct the entire diffusion potential of CO in the vicinity of another CO molecule by use of the Poisson equation, ⵜ2Udiff = 0, with the boundary conditions of the known potentials at the on-top, bridge, and hollow sites. Figure 4 shows on the left-hand side the diffusion potential of one CO molecule in the presence of another one at the center of the plot. The variation from the diffusion potential in the absence of the CO molecule at the origin is shown on the right. This perturbation is on the level of a few meV 共at an error below 1 meV, which derives from the statistical uncertainty of the original data set兲. The potential at the origin was chosen arbitrarily high in order to reflect the impossibility of adsorbing two CO molecules at the same substrate atom under our experimental conditions. We find a repulsive interaction between neighboring CO molecules that are separated by 艋2 Cu–Cu distances. This repulsive interaction is stronger at the adsites than at the diffusion transition states 共i.e., bridge sites兲. For instance, nearest neighbors experience a repulsive interaction of 7.3 meV, yet the potential at the diffusion transition state
Downloaded 02 Dec 2005 to 138.23.132.101. Redistribution subject to AIP license or copyright, see http://jcp.aip.org/jcp/copyright.jsp
201102-4
J. Chem. Phys. 123, 201102 共2005兲
Wong et al.
between nearest-neighbor sites is only 5.3 meV higher than in the unperturbed case 共black rectangle兲. This renders transversal diffusion 2 meV more facile than in the absence of the CO molecule at the center. This results in the apparent rotation of molecules around one another shown in Fig. 2共a兲. At 冑7 separation 共white rectangle兲 we find an attractive interaction between neighboring CO molecules which makes pairs of CO molecules stay together for a longer time than it would be the case for an entirely repulsive interaction potential. This potential valley serves as a starting point for the excursion of CO molecules to shorter separations, where they will diffuse rapidly 共due to the lowering of the effective diffusion barrier兲 but stay only for brief durations 共due to CO–CO repulsion兲. We would like to stress that without information about all the diffusion barriers shown in Fig. 4 no meaningful simulation of the diffusive motion of ensembles of CO is possible. We performed Monte Carlo simulations of the diffusivity of a molecular arrangement similar to Fig. 1共a兲, in which we assume that the modifications of the diffusion potential are additive. The open symbols of Fig. 1共c兲 show the results. The interaction potential found here can reproduce the enhancement of diffusivity at increased local coverage. However, the reduction of the diffusivity at elevated coverages, as observed experimentally beyond ⬇0.04 ML, are not reproduced at the correct coverage; the simulations predict deceleration of diffusion at about three times the experimental value 共not shown兲. This indicates that effects beyond a linear superposition of adsorbate potentials, i.e., multi adsorbate interactions, play an important role at local coverages beyond 0.04 ML. This coincides well with prior observations of variations of the desorption behavior of CO in that coverage regime,27 whose precise origin is under ongoing discussion.28 In summary, we found that the evaluation of molecular diffusion directions in the vicinity of neighboring adsorbates can provide valuable information about intermolecular interactions, which allows reconstruction of the local perturbation of the diffusion potential on the meV level. This evaluation reaches insofar beyond analysis of pair separations, as it provides diffusion barriers both for transversal and radial diffusions of adsorbates. Knowledge of these barriers is crucial for reproducing the acceleration of diffusivity in the realm of coverages below 0.04 ML.
This study would not have been possible without generous support from the US Department of Energy 共DE-FGO203ER15464兲 and the Petroleum Research Fund of the American Chemical Society. Equipment support and maintenance were provided by the Air Force Office of Scientific Research 共F49620-01-1-0286兲 and DARPA 共DMEA90-02-0216兲, respectively. 1
J. Wintterlin, S. Volkening, T. Janssens, T. Zambelli, and G. Ertl, Science 278, 1931 共1997兲. 2 H. Ibach, Surf. Sci. Rep. 29, 195 共1997兲. 3 A. Jardine, S. Dworski, P. Fouquet, G. Alexandrowicz, D. Riley, G. Lee, J. Ellis, and W. Allison, Science 304, 1790 共2004兲. 4 L. Bartels, F. Wang, D. Moller, E. Knoesel, and T. Heinz, Science 305, 648 共2004兲. 5 A. Heinrich, C. Lutz, J. Gupta, and D. Eigler, Science 298, 1381 共2002兲. 6 P. Han, B. Mantooth, E. Sykes, Z. Donhauser, and P. Weiss, J. Am. Chem. Soc. 126, 10787 共2004兲. 7 J. Repp, F. Moresco, G. Meyer, K. Rieder, P. Hyldgaard, and M. Persson, Phys. Rev. Lett. 85, 2981 共2000兲. 8 N. Knorr, H. Brune, M. Epple, A. Hirstein, M. Schneider, and K. Kern, Phys. Rev. B 65, 115420 共2002兲. 9 K. Fichthorn and M. Scheffler, Phys. Rev. Lett. 84, 5371 共2000兲. 10 S. Horch, H. Lorensen, S. Helveg, E. Laegsgaard, I. Stensgaard, K. Jacobsen, J. Norskov, and F. Besenbacher, Nature 共London兲 398, 134 共1999兲. 11 T. Mitsui, M. Rose, E. Fomin, D. Ogletree, and M. Salmeron, Nature 共London兲 422, 705 共2003兲. 12 T. Mitsui, M. Rose, E. Fomin, D. Ogletree, and M. Salmeron, Phys. Rev. Lett. 94, 036101 共2005兲. 13 B. Briner, M. Doering, H. Rust, and A. Bradshaw, Science 278, 257 共1997兲. 14 L. Bartels, G. Meyer, and K. Rieder, Surf. Sci. 432, L621 共1999兲. 15 D. Skelton, D. Wei, and S. Kevan, Surf. Sci. 370, 64 共1997兲. 16 H.-L. Dai and W. Ho, Laser Spectroscopy and Photochemistry on Metal Surfaces 共World Scientific, Singapore, 1995兲, p. 625. 17 R. Verhoef and M. Asscher, Surf. Sci. 376, 389 共1997兲. 18 E. Seebauer, A. Kong, and L. Schmidt, J. Chem. Phys. 88, 6597 共1988兲. 19 B. Stipe, M. Rezaei, and W. Ho, Rev. Sci. Instrum. 70共1兲, 137 共1999兲. 20 G. Meyer, Rev. Sci. Instrum. 67, 2960 共1996兲. 21 L. Bartels, G. Meyer, and K. Rieder, Appl. Phys. Lett. 71, 213 共1997兲. 22 See EPAPS Document No. E-JCPSA6-123-708542 for two STM movies. A direct link to this document may be found in the online article’s HTML reference section. The document may also be reached via the EPAPS homepage 共http://www.aip.org/pubservs/epaps.html兲 or from ftp.aip.org in the directory /epaps/. See the EPAPS homepage for more information. 23 P. Feibelman, B. Hammer, J. Norskov, F. Wagner, M. Scheffler, R. Stumpf, R. Watwe, and J. Dumesic, J. Phys. Chem. B 105, 4018 共2001兲. 24 S. Corcelli and J. Tully, J. Phys. Chem. A 106, 10849 共2002兲. 25 S. Gao, D. Busch, and W. Ho, Surf. Sci. 344, L1252 共1995兲. 26 L. Bartels, M. Wolf, G. Meyer, and K. Rieder, Chem. Phys. Lett. 291, 573 共1998兲. 27 S. Kevan, D. Skelton, and D. Wei, Crit. Rev. Surf. Chem. 4, 77 共1994兲. 28 F. Zaera, Acc. Chem. Res. 35, 129 共2002兲.
Downloaded 02 Dec 2005 to 138.23.132.101. Redistribution subject to AIP license or copyright, see http://jcp.aip.org/jcp/copyright.jsp