Apr 17, 2013 - to lists, requires prior specific permission and/or a fee. Eurosys'13 .... type). Figure 4 shows data for
CPI2: CPU performance isolation for shared compute clusters Xiao Zhang
Eric Tune
Robert Hagmann Rohit Jnagal Vrigo Gokhale John Wilkes Google, Inc. {xiaozhang, etune, rhagmann, jnagal, vrigo, johnwilkes}@google.com
Abstract
(a) 100%
Performance isolation is a key challenge in cloud computing. Unfortunately, Linux has few defenses against performance interference in shared resources such as processor caches and memory buses, so applications in a cloud can experience unpredictable performance caused by other programs’ behavior. Our solution, CPI2 , uses cycles-per-instruction (CPI) data obtained by hardware performance counters to identify problems, select the likely perpetrators, and then optionally throttle them so that the victims can return to their expected behavior. It automatically learns normal and anomalous behaviors by aggregating data from multiple tasks in the same job. We have rolled out CPI2 to all of Google’s shared compute clusters. The paper presents the analysis that lead us to that outcome, including both case studies and a large-scale evaluation of its ability to solve real production issues.
1.
CDF
80% 60% 40% 20% 0% 0
10
20
30 40 50 60 70 Number of tasks per machine (b)
80
90
100
100%
CDF
80% 60% 40% 20% 0% 0
1000 2000 3000 4000 5000 6000 7000 8000 9000 10000 Number of threads per machine
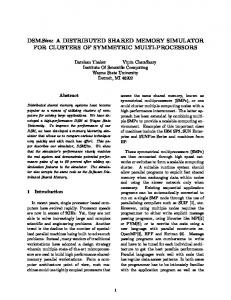
Figure 1: The number of tasks and threads running on a machine, as cumulative distribution functions (CDFs).
Introduction
Google’s compute clusters share machines between applications to increase the utilization of our hardware. We provision user-facing, latency-sensitive applications to handle their peak load demands, but since it is rare for all the applications to experience peak load simultaneously, most machines have unused capacity, and we use this capacity to run batch jobs on the same machines. As a result, the vast majority of our machines run multiple tasks (Figure 1). The number of tasks per machine is likely to increase as the number of CPU cores per machine grows. Unfortunately, interference can occur in any processor resource that is shared between threads of different jobs, such as processor caches and memory access-paths. This interference can negatively affect the performance of latency-
sensitive applications: an internal survey elicited examples such as “latency for one task skyrocketed for the period during which a batch job was running on the machine” and “1/66 of user traffic for an application in a cluster had a latency of more than 200 ms rather than 40ms for more than 1 hr”. Predictable, low latency is key to end-user satisfaction, so this is a real problem: engineers are paged when an important task or job becomes a victim of such interference. The current state of performance isolation in commodity Linux operating system kernels gives us limited options: we can tolerate the poor performance (undesirable), grant additional resources to the victim applications (wasteful, and since most Linux kernels do not manage shared processor resources like caches and memory controllers, it might not fix the problem), or grant the victims dedicated, unshared resources (even more wasteful). None of these choices are attractive. Fortunately, applications designed for large-scale compute clusters often have hundreds to thousands of similar tasks, so it is possible to use a statistical approach to find performance outliers (which we call victims), and address them by reducing interference from other tasks (we call such tasks
Permission to make digital or hard copies of all or part of this work for personal or classroom use is granted without fee provided that copies are not made or distributed for profit or commercial advantage and that copies bear this notice and the full citation on the first page. To copy otherwise, to republish, to post on servers or to redistribute to lists, requires prior specific permission and/or a fee. Eurosys’13 April 15-17, 2013, Prague, Czech Republic c 2013 ACM 978-1-4503-1994-2/13/04. . . $15.00 Copyright
379
antagonists even though the interference may be accidental). Finding such outliers requires a metric that is relatively stable across well-behaved executions of applications, and is well-correlated with the bad behavior caused by antagonists. An application’s cycles per instruction (CPI) is such a metric: most latency-sensitive applications in our compute clusters have fairly consistent CPIs across tasks and time, provided the CPI is averaged over a period that is much longer than the time to perform a single user-facing transaction or query, and the CPI calculations are done separately for each processor type. This paper describes CPI2 , a system that builds on the useful properties of CPI measures to automate all of the following: 1. observe the run-time performance of hundreds to thousands of tasks belonging to the same job, and learn to distinguish normal performance from outliers; 2. identify performance interference within a few minutes by detecting such outliers; 3. determine which antagonist applications are the likely cause with an online cross-correlation analysis; 4. (if desired) ameliorate the bad behavior by throttling or migrating the antagonists. The result is that troublesome performance interference can be detected and acted on, which makes it possible to continue to share resources between applications, and maintain high utilization levels. A prototype of CPI2 has already been deployed in Google’s compute clusters. The contributions of this paper are to demonstrate the viability of CPI as an appropriate measure in this environment; describe the structure of the CPI2 system; and show that it works by studies from production systems.
2.
Background
In Google’s cluster management system, both latency-sensitive and batch jobs are comprised of multiple tasks, each of which is mapped to a Linux process tree on a machine. All the threads of a task run inside the same resourcemanagement container (a cgroup [27]), which provides limits on the amount of CPU and memory the task can use. Jobs with many tasks are the norm: 96% of the tasks we run are part of a job with at least 10 tasks, and 87% of the tasks are part of a job with 100 or more tasks. Tasks in the same job are similar: they run the same binary, and typically process similar data. A typical web-search query involves thousands of machines working in parallel [6, 19, 29, 25], each one contributing some portion of the final result. An end-user response time beyond a couple of hundred milliseconds can adversely affect user experience [33], so replies from leaves that take too long to arrive are simply discarded, lowering the quality of the search result and wasting the resources spent to gen-
380
erate them. Reducing the performance variation that results from imperfect isolation is one way to minimize this problem. Even MapReduce [12, 18] applications can benefit: a typical MapReduce job doesn’t finish until all its processing has been completed, so slow shards will delay the delivery of results. Although identifying laggards and starting up replacements for them in a timely fashion [39, 3] often improves performance, it typically does so at the cost of additional resources. And it doesn’t always help: consider the case of a slow storage server, where adding another map task that reads from it will make things worse. Better would be to eliminate the original slowdown. Each of our clusters runs a central scheduler and admission controller that ensures that resources are not oversubscribed among the latency-sensitive jobs, although it speculatively over-commits resources allocated to batch ones. Overcommitting resources is a form of statistical multiplexing, and works because most jobs do not use their maximum required resources all the time. If the scheduler guesses wrong, it may need to preempt a batch task and move it to another machine; this is not a big deal – it’s simply another source of the failures that need to be handled anyway for correct, reliable operation. Jobs are classified and prioritized into “production” and “non-production” by users or the framework that runs them (e.g., MapReduce jobs are batch by default). In one typical cluster, 7% of jobs run at production priority and use about 30% of the available CPUs, while non-production priority jobs consume about another 10% CPU [30]. Although severe resource interference between tasks is relatively rare, the scale of the compute load at Google means that it does happen, and sometimes causes bad performance. Tracking down the root cause of such problems consumes a great deal of effort, since poor performance isolation is just one possible cause amongst many. CPI2 improves behavior of latency-sensitive jobs when they experience interference by: detecting CPU performance isolation incidents, automatically identifying which jobs are causing the problem, and (optionally) shielding victim jobs by throttling the antagonists. CPI2 is one of many techniques to reduce or compensate for variability in response time, which becomes increasingly important at scale [11]. Our goal is to identify inter-job CPU interference so that it can be addressed by throttling. We do not attempt to determine which processor resources or features are the point of contention; that typically requires low-level hardware event profiling as well as human analysis, and is beyond the scope of this work. Nor do we attempt to address interference on other shared resources such as network and disk. We focus on CPU interference because we find enough examples where this is a problem to make it worthwhile. The remainder of the paper is structured as follows. It starts by showing that CPI is a well-behaved metric with
Normalized Slowdown
Normalized throughput
2X 1.8X 1.6X 1.4X IPS TPS
1.2X 1X 0
20
40
60
80
100
120
2X 1.8X 1.6X 1.4X 1.2X 1X 0
CPI Latency
4
8
12
20
24
1.5X Normalized CPI
Normalized TPS
2X 1.8X 1.6X 1.4X 1.2X 1X 1X
16
Time in hour
Time (minutes)
1.2X
1.4X
1.6X
1.4X 1.3X 1.2X 1.1X 1X 1X
1.8X
Normalized IPS
1.2X
1.4X
1.6X
1.8X
2X
Normalized Latency
Figure 2: Normalized application transactions per second (TPS) and instructions per second (IPS) for a representative batch job: (a) normalized rates against running time; (b) scatter plot of the two rates, which have a correlation coefficient of 0.97. Each data point is the mean across a few thousand machines over a 10 minute window. The data is normalized to the minimum value observed in the 2-hour collection period.
Figure 3: Normalized application request latency and CPI for a leaf node in a user-facing web-search job: (a) request latency and CPI versus time; (b) request latency versus CPI; the correlation coefficient is 0.97. The latency is reported by the search job; the CPI is measured by CPI2 . The results are normalized to the minimum value observed in the 24-hour sample period. • CPI only shows a symptom, not the root cause. Yes, but
it doesn’t really matter: treating the symptom can restore good performance.
good predictive powers (section 3) and that it is useful for finding antagonists (section 4) before describing how we handle those antagonists (section 5). Section 6 describes our experience of deploying CPI2 in Google’s production clusters and section 7 evaluates its effectiveness via a largescale experiment. We discuss related work (section 8) and future work (section 9 before summarizing our conclusions in section 10.
3.
• CPI doesn’t measure network or disk interference effects.
True. Other techniques are needed to detect and handle I/O-interference. But there are enough examples of CPU interference to make it worth addressing. In support of the first point, consider Figure 2, which compares an application-specific measure of throughput (transactions per second, TPS) and CPU instructions per second (IPS) for a 2600-task batch job. The transaction rate is reported by the job; the CPU instruction rate is calculated by dividing the observed CPU cycle speed by the observed CPI. The rates track one another well, with a coefficient of correlation of 0.97. Figure 3 shows data for average CPI and request latency in a latency-sensitive application (a web-search leaf node), with similar results. Again, we see a coefficient of correlation of 0.97. The CPI is a function of the hardware platform (CPU type). Figure 4 shows data for CPI and request-latency of individual tasks in three web-search jobs on two different platforms; the CPU clock speed was not changed in these experiments. Two of the jobs are fairly computation-intensive and show high correlation coefficients (0.68–0.75), but the third job exhibits poor correlation because CPI does not capture I/O behavior: it is a web-search root node, whose request latency is largely determined by the response time of other nodes, not the root node itself.
CPI as a metric
Our system relies on cycles per instruction (CPI) measures as a performance indicator for detecting interference. In this section, we explain that choice, and argue that CPI correlates well with observed application behavior. CPI can be measured easily and cheaply on existing hardware and doesn’t require application-level input. But is it useful for performance-interference detection with the kinds of applications that run in cloud computing clusters? There are a few potential concerns: • CPI might not be well correlated with application-level
behavior. We show that it is. • The number and mix of instructions required to accom-
plish a fixed amount of work may vary between tasks of the same job, or over time in one task (e.g. due to just-intime compilation or synchronization overheads). In practice, we have not found this to be an issue.
381
Normalized Latency
(b) Normalized Latency
Normalized Latency
(a) 1.8 1.6 1.4 1.2 1 1.0
1.1 1.2 Normalized CPI (c)
1.3
cluster scheduler
1.8 1.6 1.4 1.2 1 1.0
CPI samples
1.2 1.4 Normalized CPI
1.6 agent task task task
2.5 2
1.15 1.3 Normalized CPI
1.45
agent task task task
CPI sampling CPI data is derived from hardware counters, and is defined as the value of the CPU CLK UNHALTED.REF counter divided by the INSTRUCTIONS RETIRED counter. These are counted simultaneously, and collected on a percgroup basis. (Per-CPU counting wouldn’t work because several unrelated tasks frequently timeshare a single CPU (hardware context). Per-thread counting would require too much memory: running thousands of threads on a machine is not uncommon (figure 1b).) The CPI data is sampled periodically by a system daemon using the perf event tool [13] in counting mode (rather than sampling mode) to keep overhead to a minimum. We gather CPI data for a 10 second period once a minute; we picked this fraction to give other measurement tools time to use the counters. The counters are saved/restored when a context switch changes to a thread from a different cgroup, which costs a couple of microseconds. Total CPU overhead is less than 0.1% and incurs no visible latency impact to our users. A cluster typically contains several thousand machines; the CPI samples are collected from all the machines by a percluster data-gathering system, and sent back to a centralized component for further data aggregation. The data gathered for each task consists of the following fields:
2 1.8
Avg CPI
agent task task task
to each machine that is running a task from that job. Anomalies are detected locally, which enables rapid responses and increases scalability.
Figure 4: Normalized request latency and CPI of tasks in three web-search jobs: (a) a leaf node; (b) an intermediate node; (c) a root node. Each point represents a 5-minute sample of a task’s execution. Different colors indicate different hardware platforms.
Tue.
Wed.
Thu.
Fri.
Sat.
1.4 1.2 6am
6pm
6am
6pm
6am
6pm
6am
6pm
6am
6pm
Time of day
Figure 5: Average CPI across thousands of web-search leaf tasks over time. The first day is 2011.11.01. CPI changes slowly over time as the instruction mix that gets executed changes. Figure 5 plots the mean CPI of the tasks of a web-search job over 5 days. It demonstrates a diurnal pattern, with about a 4% coefficient of variation (standard deviation divided by mean). Similar effects have been observed before (e.g., [25]). We conclude that there is a positive correlation between changes in CPI and changes in compute-intensive application behavior, and that CPI is a reasonably stable measure over time. 3.1
agent task task victim
Figure 6: The CPI2 data pipeline.
1 1.0
1
agent task task task
machines
1.5
1.6
CPI sampleaggregator
smoothed, averaged, CPI specs
string jobname; string platforminfo; // e.g., CPU type int64 timestamp; // microsec since epoch float cpu_usage; // CPU-sec/sec float cpi;
Collecting CPI data
CPI data aggregation Most jobs are structured as a set of identical tasks, and their CPIs are similar (see Table 1 for some examples). Although individual latency-sensitive requests may have noticeably different CPIs, these variations are smoothed out over the 10s sample period. Many of our clusters contain multiple different hardware platforms (CPU types) which will typically have different
In order to use CPI as a predictive metric, we need to collect it from all the machines in a cluster. This section describes how we do that. Figure 6 shows our CPI pipeline: CPI data is gathered for every task on a machine, then sent off-machine to a service where data from related tasks is aggregated. The perjob, per-platform aggregated CPI values are then sent back
382
CPI 0.88 ± 0.09 1.36 ± 0.26 2.03 ± 0.20
tasks 312 1040 1250
7%