time â and hence delta-V. The General Motors (GM). EDR for example measures ... EDR is the delta-V versus time history of the vehicle during the crash.
2004-01-1194
Crash Severity: A Comparison of Event Data Recorder Measurements with Accident Reconstruction Estimates Hampton C. Gabler Carolyn E. Hampton Rowan University
John Hinch National Highway Traffic Safety Administration
ABSTRACT The primary description of crash severity in most accident databases is vehicle delta-V. Delta-V has been traditionally estimated through accident reconstruction techniques using computer codes, e.g. Crash3 and WinSmash. Unfortunately, delta-V is notoriously difficult to estimate in many types of collisions including sideswipes, collisions with narrow objects, angled side impacts, and rollovers. Indeed, approximately 40% of all delta-V estimates for inspected vehicles in the National Automotive Sampling System / Crashworthiness Data System (NASS/CDS) 2001 are reported as unknown.
the National Highway Traffic Safety Administration (NHTSA) estimates both longitudinal and lateral delta-V from detailed measurements of vehicle deformation using a computer code such as WinSmash [Stucki et al, 1998]. WinSmash and similar codes, e.g. Crash3 [NHTSA, 1982], are most accurate for frontal crashes with full frontal engagement. As crashes deviate from this ideal configuration, the estimates become increasingly less accurate [O’Neill et al, 1996; Stucki et al, 1998]. Delta-V for some crash configurations is notoriously difficult to estimate. These configurations include sideswipe, collisions with narrow objects, e.g. poles and trees, angled side impacts, and rollover. Reflecting this difficulty, approximately 40% of all delta-V estimates for inspected vehicles in NASS/CDS 2001 are reported as unknown.
The Event Data Recorders (EDRs), now being installed as standard equipment by several automakers, have the potential to provide an independent measurement of crash severity which avoids many of the difficulties of accident reconstruction techniques. This paper evaluates the feasibility of replacing delta-V estimates from accident reconstruction with the delta-V recorded by EDRs. The analysis is based on over 500 NASS/CDS cases from 2000 - 2002 which have corresponding EDR datasets. The potential of extracting manual belt use from EDRs is also discussed and compared with the corresponding results from NASS gathered by accident investigators. Although EDRs can greatly enhance the investigation of a crash, the study finds that current EDRs are not perfect. The paper discusses the limitations of current EDR technology and the opportunites for enhancement of future Event Data Recorders.
The Event Data Recorders (EDRs), now being installed as standard equipment by several automakers, have the potential to provide an independent measurement of crash severity which avoids many of the difficulties of accident reconstruction techniques. For vehicles equipped with an EDR, sensors on the vehicle itself provide a direct measurement of vehicle velocity versus time – and hence delta-V. The General Motors (GM) EDR for example measures longitudinal change in velocity vs. time. Other automakers record both longitudinal and lateral acceleration vs. time. An earlier study of WinSmash vs. EDR data showed that an EDRgenerated delta-V is available for many of the cases in which the WinSmash-generated delta-V was listed as unknown [Gabler et al, 2003].
INTRODUCTION
OBJECTIVE
The vehicle resultant change in velocity, commonly referred to as simply resultant delta-V, is the primary description of crash severity in most crash databases. For the National Automotive Sampling System / Crashworthiness Data System (NASS/CDS) database,
The objective of this paper is to evaluate the potential to supplement and possibly replace WinSmash-estimated delta-Vs with the delta-V recorded in EDRs. The paper will examine those NASS/CDS cases from 2000 - 2002 for which there are corresponding EDR datasets.
DESCRIPTION OF THE ROWAN UNIVERSITY EDR DATABASE NHTSA has collected EDR records from several hundred crashes investigated as part of NHTSA NASS/CDS investigations. NASS/CDS is a national sample of 4,000 to 5,000 crashes investigated each year by NHTSA at 27 locations throughout the United States. To date, the majority of cases in NASS/CDS involving EDR data are GM vehicles. At the time of this study, GM and Ford Motor Company were the only automakers that had publicly released the format of their EDRs. In addition, both GM and Ford had signed agreements with the Vetronix Corporation to produce a Crash Data Retrieval System capable of downloading, decoding, and displaying the data recorded in GM and selected Ford EDRs. As the majority of NASS/CDS cases with EDRs are currently from GM, the analysis which follows will focus exclusively on GM vehicles. As shown in Table 1, NASS/CDS teams from 2000-2002 successfully collected EDR data from 527 GM vehicles involved in traffic crashes.
both a boon and a challenge to researchers who seek to compare the crash performance of vehicles equipped with different generations of the GM EDR. The two most common GM EDRs in the Rowan EDR database are the SDM-R and the SDM-G modules. GM has released several variants of these two modules. COMPUTING EDR DELTA-V Arguably, the most valuable data element stored in an EDR is the delta-V versus time history of the vehicle during the crash. In GM EDRs, the change in longitudinal velocity is recorded every ten milliseconds for up to 300 milliseconds in the older SDM-R design and up to 150 milliseconds in newer EDR designs, e.g. the SDM-G. GM EDRs do not begin to record delta-V until the vehicle experiences sufficient acceleration to wakeup the air bag deployment algorithm, sometimes referred to as ‘algorithm enable’. Change in lateral velocity is not recorded. Time from Algorithm Enable (milliseconds) 0
50
100
150
200
250
300
350
0
Table 1. Contents of the Rowan University EDR Database by Source Source
Total Number of Cases
NASS/CDS 2000
21
NASS/CDS 2001
192
NASS/CDS 2002
314
Total
527
Longitudinal Velocity (mph)
-5 -10 -15 -20
Maximum Velocity Change (37.52 mph)
-25 -30
Final Recorded Velocity Change (32.91 mph)
-35 -40
To analyze this dataset, Rowan University developed a database of the NHTSA EDR cases collected from NASS/CDS 2000-2002. The cases extracted from this database and used in this analysis included only crashes in which an EDR had been successfully downloaded and matched with a corresponding NASS/CDS case [Gabler et al, 2002].
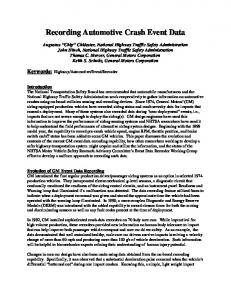
DESCRIPTION OF THE GM EDR CASES GM EDRs have the capability to store a description of both the crash and the pre-crash phase of a traffic collision. Crash event parameters include longitudinal change in velocity vs. time during the impact, air bag trigger times, and seat belt status. Later versions of the GM EDR also store 5 seconds of precrash data including a record of vehicle speed, engine throttle position, engine revolutions per minute and brake. Since their introduction in the early 1990’s, GM has continuously improved their EDR design. This has been
Figure 1. EDR record of Longitudinal Change in Velocity vs. Time for a 1999 Pontiac Grand Am involved in a frontal collision with another vehicle Figure 1 shows the longitudinal change in velocity vs. time recorded by an EDR in a 1999 GM Pontiac Grand Am involved in a frontal collision with another vehicle. For this paper, the EDR delta-V was obtained for each case by finding the maximum change in velocity as shown in Figure 1. WinSmash and similar computer codes assume fully plastic deformation, i.e. the vehicles do not separate or rebound [Stucki et al, 1998]. In reality, most collisions also involve a rebound phase in which some of the crash energy is restored as kinetic energy. WinSmash and similar computer codes make the assumption that the rebound velocity is small compared with the overall delta-V and can be ignored. In contrast, the maximum EDR delta-V more accurately includes the entire change in longitudinal velocity including the rebound velocity. VALIDATION OF GM EDR DELTA-V To validate the delta-V measurements of GM EDRs, NHTSA examined the performance of GM EDRs in staged frontal-barrier crash tests [Chidester et al, 2001].
In each test, NHTSA compared the delta-V vs. time measured by the EDR with the delta-V computed from accelerometers mounted in the occupant compartment of the vehicle. The study found that the EDR delta-V vs. time was comparable, but slightly lower than that measured by the crash test instrumentation. In an independent validation, Lawrence et al (2002) found that that, in non-deployment events, GM EDRs underestimated the true delta-V by 1-2 mph. In both studies, the underestimation of delta-V was due in part to the fact that GM EDRs do not begin to record delta-V until the vehicle experiences sufficient acceleration to wakeup the air bag deployment algorithm. STORING MULTIPLE CRASH EVENTS GM EDRs can store three types of events: a nondeployment event, a deployment event, and a deployment-level event. A non-deployment event is defined as a crash of too low a severity to warrant deploying the air bag. A deployment event is an impact in which the air bag was deployed. A deployment-level event is an impact of sufficient severity that the air bag would have been deployed if a previous event had not already deployed the air bag. GM EDRs can store up to two (2) events associated with a crash. For NASS/CDS 2000-2002 cases, Table 2 lists the distribution of cases in the EDR database. As shown in Table 2, approximately one-half of the cases in the database were of sufficient severity to deploy the air bag. This paper will focus on EDR data from these deployment events only. Table 2. Non-Deployment vs. Deployment EDR Cases for NASS/CDS 2000-2002
Non Deployment Events Only Case with both Non Deployment + Deployment Events Cases with both Deployment + Deployment-Level Events Deployment Events Only Total
Total
Type of Event
Deployment Only Deployment + Non Deployment Deployment + Deployment -Level Total
Cases with Delta-V vs. Time
Cases with Zero Delta-V vs. Time
Cases with Missing Delta-V vs. Time
Total
79
-
-
79
177
4
1
182
12
-
-
12
269
4
1
273
In GM EDRs, the change in longitudinal velocity is recorded every ten milliseconds for up to 300 milliseconds in the older SDM-R design and up to 150 milliseconds in newer EDR designs, e.g. the SDM-G. For deployment events, the SDM-G may not record the full 150 ms of delta-V vs. time: the SDM-G will record for only 100 milliseconds after the air bag is deployed and up to 50 milliseconds before the air bag is deployed. As illustrated for four selected EDR cases in Figure 2, this may be an insufficient amount of time to completely record the event. In one of the cases (CDC= 11FLAE9), the vehicle reaches a constant velocity at about 125 ms after impact signaling that the crash event is over. Note however that in the other three cases velocity is still decreasing at the point when the EDR stopped recording. In these cases, the EDR does not provide a correct final delta-V. 0
254
0
50
100
150
200
182
79 527
300
11FLAE09 12FREW02 12FLAE08 12FYEW02
-10
12
250
-5
Velocity (mph)
Source
Table 3. Deployment Events: Availability of EDR Delta-V versus Time Data
-15 -20 -25 -30 -35 -40
AVAILABILITY OF EDR LONGITUDINAL DELTA-V Table 3 shows that delta-V data were successfully recovered from EDRs in 98% of the deployment events. Delta-V was not recovered in only 5 of 273 air bag deployment cases.
Time (milliseconds)
Figure 2. The Effect of Recording Time for four selected GM EDR cases
350
Figure 3 shows the distribution of longitudinal delta-V for deployment events with complete delta-V vs. time data. 30%
% of Total Deployments
25%
20%
15%
The NASS/CDS 2000-2002 dataset contains 146 singleevent deployment collisions with EDR data. In 77% of the single-event deployment collisions, both the EDR and the WinSmash delta-V were available. In an additional 21% of the cases, a WinSmash estimate of delta-V could not be obtained, but the delta-V was recorded by the EDR. In 2% of the cases, a WinSmash estimate of delta-V was available for collisions in which the EDR failed to record non-zero delta-V versus time data.
10%
Table 4. EDR vs. WinSmash: Delta-V Availability in Single Event, Deployment Events
5%
WinSmash Delta-V Delta-V estimate estimate available unavailable
>5 560
>5 055
>4 550
>4 045
>3 540
>3 035
>2 530
>2 025
>1 520
>1 015
>5 -1 0
05
0%
Longitudinal Delta V (mph)
EDR
Figure 3. Deployment Events: Distribution of EDR Longitudinal Delta-V (NASS/CDS 2000-2002)
RESULTS The following section explores the use of EDR data as an improved method of collecting data in crash reconstruction. Specifically, this section discusses (1) the feasibility of obtaining delta-V estimates in crashes where a WinSmash estimate was not available, (2) a comparison of recorded EDR delta-V versus WinSmash delta-V estimates, and (3) a comparison of belt usage rate as obtained from crash investigators versus direct EDR measurement.
Known delta-V vs. time Zero delta-V vs. time Missing delta-V vs. time Total
The analysis which follows excludes any EDR-equipped vehicles which NASS designated as having experienced multiple events. When a vehicle experiences multiple crash events, it can be difficult to identify which event was recorded by the EDR. In addition, only crashes severe enough to deploy the air bag are included. EDR cases meeting these criteria are hereafter referred to as single event deployment collisions. In single event deployment collisions, the single NASS/CDS event corresponding to the single EDR event can be identified without ambiguity. The EDR-recorded delta-V was compared with the NASS/CDS most harmful event deltaV. For single event deployment collisions, the most harmful event is also the event which deployed the air bag.
112
31
143
3
-
3
-
-
-
115
31
146
EDR Delta-V Known / NASS Delta-V Unknown 21%
NASS Delta-V Known / EDR DeltaV Unknown 2%
CAN EDRS RECOVER UNKNOWN DELTA-VS? The following analysis evaluates the potential of EDRs to provide a measurement of delta-V in collisions for which a WinSmash estimate of delta-V was not possible. In NASS/CDS, these cases have delta-V coded as unknown. As shown in Figure 4 and tabulated in Table 4, EDR delta-V data were frequently available in crashes where a WinSmash delta-V estimate was not possible.
Total
Both EDR and NASS Delta-V Known 77%
Figure 4. EDR vs. NASS: Delta-V Availability in Single Event Deployment Collisions EDRs are clearly a promising means to determine deltaV for crashes in which crash severity is difficult to estimate using conventional methods. In all single-event collisions for which a WinSmash estimate of delta-V could not be obtained, and which were severe enough to deploy the air bag (31 of 146), an EDR delta-V estimate was available as an alternative measure. WINSMASH DELTA-V VERSUS EDR DELTA-V
EDRs directly measure the acceleration of a vehicle from onboard sensors and have the potential to be a more accurate gauge of vehicle response to a crash than would an after-the-fact crash reconstruction. This section compares delta-V as directly measured by EDRs with delta-V as reconstructed using the WinSmash computer code. As before, the comparison is restricted to EDR-equipped vehicles subjected to single event deployment collisions. In addition, EDR cases in which the entire crash pulse was not completely recorded or was invalid were excluded from the analysis.
WinSmash Longitudinal Delta-V (mph)
60 Front (Overlap>=50%) Front (Overlap