TSAI & WARDELL Creating Individualized Data Sets for Student Exercises Using Microsoft Excel and Visual Basic
Creating Individualized Data Sets for Student Exercises Using Microsoft Excel and Visual Basic Weiyu Tsai Don G. Wardell Management Department David Eccles School of Business University of Utah 1645 E. Campus Center Dr. #106 Salt Lake City, Utah 84112-9304
[email protected] [email protected]
Abstract In this paper we describe an approach that utilizes Excel macros to help OR/MS instructors to enhance and assess their students' learning. We begin by explaining a specific macro, Data Generator, which mainly helps statistics instructors to create assignment questions where numbers or data sets used in the questions are randomly generated according to the instructions specified by instructors. Because of the potentially narrow application range of our particular macro, we also describe an approach that can be used for more general questions. For the most part, this more general approach requires simply recording a macro and then pasting a few other instructions into the resulting code to make the recorded macro more user-friendly. We also provide a suggested procedure to help instructors to grade the students' answers automatically.
1. Introduction
tion to the material taught in class and learn to be more confident in solving problems.
In order to improve and assess a student's skill in solving numeric problems, our preference is to ask questions that require students to analyze data and subsequently reach conclusions. This is especially true for instructors who teach quantitative courses such as business statistics, data analysis, and optimization in a large class setting. Asking such questions in class is sometimes impractical because a computer and a significant amount of time are required to answer them. Consequently it becomes desirable to create take-home assignments, quizzes and exams. Unfortunately, takehome assignments are susceptible to undesirable collaboration, which may cause the instructor to be reluctant to use them (Strickland, 2006).
The challenge, however, lies in finding an effective means to provide a wide variety of values in problem sets and exams that allow students to practice and demonstrate these skills. It greatly increases the required administration time and effort from instructors if they choose to manually design different versions of the same assignment question. Moreover, the required time and effort to grade these problem sets and exams increase dramatically. In fact, the potential workload caused one OR/MS professor to lament, "I am considering ... different versions of take-home assignments for each student (ugh)" (Strickland, 2006).
One way to mitigate opportunities for cheating is to provide students with different versions of the assignment. It may also be the case that instructors want students to talk about problems, but in the end solve them individually. With different versions, instructors don't need to worry as much about the problem of free-riding and at the same time can encourage students to discuss homework assignments with their fellow students. In addition, students pay more attenINFORMS Transactions on Education 7:1(136-148)
136
One way to meet the challenge is to automate the process of randomly generating data sets for questions used in quantitative courses. In fact, using computer programs to resolve this challenge is not new. Indeed, the advent of computers has created many opportunities for testing student knowledge that were heretofore unavailable. These opportunities have come in the form of types of questions that were impractical in the past, as well as in the form of exams that can be tai-
© INFORMS ISSN: 1532-0545
TSAI & WARDELL Creating Individualized Data Sets for Student Exercises Using Microsoft Excel and Visual Basic
lored to meet the needs of the person taking them (Wainer,2000). Computer-based testing (CBT) utilizes questions in several formats including multiple choice, true/false, fill-in-the-blank, short answer, essay, calculated and drag and drop. The calculated questions are most similar to what we are proposing in this article because they provide each examinee his or her own input values. In other words, the algorithmically generated questions are those where the computer randomly selects (from a pre-specified range) values for input numbers. Students are then asked to manipulate the input values to determine output values. Based on the correct formula supplied by the instructor, the computer calculates the correct answer and compares it to the student's answer and can provide immediate feedback. Example providers of e-learning systems for educational institutions that provide the functionality of generating calculated questions with algorithmic-styled formulae in their on-line course platforms include WebCT(1), WebAssign(2) ,Blackboard(3), PHGrade Assist(4), and eCollege(5). Furthermore, there are software packages (such as Respondus 3.0(6), that can be used for off-line editing to ease the difficulty of editing directly on-line on these platforms. Perhaps the most individualized type of CBT is computerized adaptive testing (CAT). In CAT, each subsequent question presented to the examinee depends on her or his performance on previous questions. The computer uses responses to adapt questions so that items that are "maximally informative about the examinee's ability level are administered" (Hambleton et al.,1991). Hence the computer is used to store test bank items, to estimate the examinee's ability level and to select items that are most appropriate for the examinee. There are several purported advantages of CAT. These include enhanced security, convenience, efficiency, comfort, accuracy, immediate test scoring and report(1) (2) (3) (4) (5) (6) (7) (8) (9)
ing, greater test standardization and improved ability to add and remove test bank items (Prometric FAQ(7) , Hambleton et al., 1991). A similar type of testing is referred to as computer mastery testing (CMT). In theory, CMT simulates an interactive oral examination. As with CAT, the computer analyzes responses to each section of the exam and estimates the probability that the examinee has mastered a particular subject and therefore how the examination should proceed(8). Besides Prometric, another system that uses CMT is ALEKS(9), which is a learning and testing system that works to make students proficient in various subjects, including statistics. Despite the availability of these CBT tools, there are several limitations. Obviously, cost is a main concern. Educational institutions have to subscribe to such elearning systems before their instructors can take the advantage of the tools. In addition, these e-learning systems and software alike are limited by the formulas included in the algorithmic-styled questions. Such systems don't always have statistical functions built in to allow for automatic grading. Furthermore, a technical issue arises due to the fact that these randomly generated values are provided to students on-line or printed out on paper. Because most business school students use Excel in quantitative courses, they oftentimes would have to manually input the generated data into Excel. Such data entry is tedious and susceptible to error. Finally, Larreamendy-Joerns et al. (2005) argue that the benefit that students derive from problem-solving activities depends upon the exercises' frequency, cognitive complexity and authenticity. The algorithmicstyled exercises described above should allow for adequate frequency, but may lack the necessary complexity and authenticity. To be cognitively complex, an exercise "requires multiple inferential steps, involves multiple possible solutions, and allows for multiple paths to a solution." Authenticity means that the tasks
http://www.webct.com/ http://www.webassign.com http://www.blackboard.com/us/index.aspx http://www.prenhall.com/phga/html/business/index.html http://www.ecollege.com/indexflash.learn http://www.respondus.com/ http://www.prometric.com/Candidates/FAQs/TestingQuestions.htm#4 http://www.prometric.com/Candidates/FAQs/TestingQuestions.htm#4 http://www.aleks.com/about#whatis
INFORMS Transactions on Education 7:1(136-148)
137
© INFORMS ISSN: 1532-0545
TSAI & WARDELL Creating Individualized Data Sets for Student Exercises Using Microsoft Excel and Visual Basic
assigned to students are similar to those that professionals in the area encounter. We believe that by providing full data sets, rather than just a few input values, the Excel-based procedure that we describe provides students with some of the advantages of cognitive complexity and authenticity. It is true that much of what we propose is algorithmic and asks students to perform the somewhat rote tasks of data analysis. However, by providing data sets as complex as the instructor wants to simulate, students can be engaged in higher levels of problem solving. In this paper we describe an Excel macro called, "Data Generator," and provide a generic approach that instructors can use to create customized data sets that do not have most of the drawbacks mentioned above. In section 2, we provide a simple regression question we use in our MBA Data Analysis and Decision Making course. We then describe how instructors can use Data Generator to set up a file that can generate data for this regression question automatically when students first open the file. Section 3 provides instructions to grade the question once instructors receive submitted files from their students. In section 4, we describe a more general algorithm (i.e., one where our macro is not necessary) that can be used to create customized data sets. Finally, we conclude in section 5.
2. Creating the Data Set: Instructions for Using "Data Generator" In this section we present a motivating example, give the steps needed to create the customized data set, and explain how students will use the file.
2.1. Motivating Example
for data collection. Data were collected on sales of coffee (in hundreds of gallons and coded as SALES) and the number of coffee dispensers (coded as DISPENSE) within the cafeteria. Students are then asked to fit a regression model to the data and answer questions about the output. To make the question set richer, we desired to create the possibility that the relationship between the variables be nonlinear. Doing so allowed us to test students' knowledge of curvilinear regression, including polynomial regression. By asking the students to perform polynomial regression, we were able to assess their knowledge of multiple regression, including questions on testing regression assumptions (i.e., residual analysis, multicollinearity checks, etc.). For our example, Data Generator is used to create a worksheet named "Coffee" that contains the input data. In this worksheet, there are two columns of data, SALES and DISPENSE, and each column has 14 data points in our example. The variables, SALES and DISPENSE may have a linear, polynomial, logarithmic, or exponential relationship.
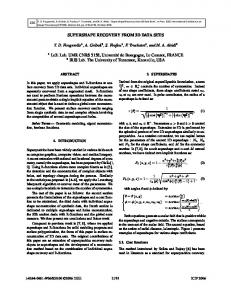
2.2. Instructions for Creating the Customized Data Sets Instructors can use Data Generator to set up an Excel file that creates the student worksheet ("Coffee" in our example) when opened. The steps for doing so are described below. 1. Upon opening the Data Generator(10) file, instructors see a worksheet named Data Generator, which is blank except for one green START button as shown in Figure 1.
Using a simple regression question discussed in our MBA Data Analysis and Decision Making course, we demonstrate how to take advantage of Data Generator to create customized data files for the students. The sample scenario is based on an example given in Neter, Wasserman and Kutner (1985) and is as follows. A marketing manager for a large cafeteria chain wished to investigate sales of coffee. Fourteen cafeterias that were similar in such respects as volume of business, type of clientele, and location were chosen
Figure 1: Instructor Data Generator Screen 2. Click the green START button. The green button disappears and a dialog box, CREATE VARIABLES,
(10) http://ite.pubs.informs.org/Vol7No1/TsaiWardell2/DataGenerator.xls
INFORMS Transactions on Education 7:1(136-148)
138
© INFORMS ISSN: 1532-0545
TSAI & WARDELL Creating Individualized Data Sets for Student Exercises Using Microsoft Excel and Visual Basic
appears. Instructors use this Create Variables dialog box to provide the desired parameters for the variables, SALES and DISPENSE. One completed sample is shown in Figure 2. In this completed sample, the value of the variable DISPENSE can be drawn from a Normal, Exponential, or Uniform distribution. The reason for the 3 choices is to add variety to the possible data sets that students will see. The relationship between SALES and DISPENSE can be linear, polynomial, logarithmic, or exponential. In other words, there are 12 different possible formulae for SALES. In order to determine starting values and ranges for the parameters, we typically START with a real or textbook data set and analyze it. Not only does the analysis provide starting values, but it makes sure that the simulated data reflect numbers that would occur in the actual scenario. For the coffee dispenser example, Neter, Wasserman and Kutner (1985) had the number of dispensers range from 0 to 6. We preferred using 1 to 7, so selected parameter values that would give us such a range. The original sales values were between 600 and 1,200 (hundreds of gallons) based on the number of the dispensers in a particular store. We thus set the intercept equal to 550 and then chose the slope and other parameters accordingly to generate sales within the range of 600 and 1,200. Since the exponential case is quite different from the others, we made sure to choose the parameters such that the minimal sales were above 600 and that a store with 7 dispensers had about 1,200 (hundred of gallons) of coffee sales. 3. After specifying the desired information for these two variables, there are four buttons at the bottom of the dialog box from which instructors can choose. Excel automatically saves the information of the two newly created variables when the instructor clicks any of the four buttons. The CREATE NEW Y button is used to create another variable Y, which is not related to the current variable Y in any way. The second button ADD NEW X to THIS Y is used to add another independent variable to the current relationship. The button LOAD VARIABLES TO WORKSHEETS creates a new worksheet and adds the created variables to the worksheet. The last button Take a break will simply save the newly created variables and exit the VBA macro.
INFORMS Transactions on Education 7:1(136-148)
139
Figure 2: A Completed CREATE VARIABLES Dialog Box 4. The macro is designed so that the error term must be treated as another variable. In our example, we clicked the button ADD NEW X to THIS Y to enter the values corresponding to the error term (see the dialog box shown in Figure 3). With three more distributions of the error term, totally there are 36 different possible combinations of formula for SALES.
Figure 3: A Completed ADD NEW X to THIS Y Dialog Box 5. Now we can create the "Coffee" worksheet by clicking the LOAD VARIABLES to worksheets button. The CREATE WORKSHEETS dialog box appears with the variables we just created shown in the list box. By typing in the worksheet name ("Coffee" in our example-the Error Term should never be selected) and selecting the variables we want displayed in the worksheet (SALES and DISPENSE in our example), we can design the data sheet that students will see. A completed dialog box is shown in Figure 4. At the bottom of the dialog box, instructors can use the buttons to create another worksheet, create more variables, seal the file, or take a break. For example, if we click the button Take a break, the worksheet "Coffee" is created as shown in Figure 5. The worksheet is not © INFORMS ISSN: 1532-0545
TSAI & WARDELL Creating Individualized Data Sets for Student Exercises Using Microsoft Excel and Visual Basic
protected, so it is possible for the instructor to add other information if desired. (For example, the instructor can insert a new column to store numbers in column A as long as the names, SALES and DISPENSE, are in row 1 and all data columns are adjacent to each other.)
create the file that the students will open. Upon sealing the file, all worksheets are hidden except a blank worksheet. At this point, a message box shows up and reminds instructors to save the file using SAVE AS and giving the file a different name so as not to overwrite the original Data Generator. At that point the process of setting up the student file is completed and the saved file can be distributed to students.
Figure 6: Three Buttons in the Worksheet 'Data Generator'
Figure 4: A Completed CREATE WORKSHEETS Dialog Box
2.3. Instructions for Students
Figure 5: The 'Coffee' Worksheet 6. On the original worksheet "Data Generator," three new buttons appear as shown in Figure 6: CONTINUE, RENEW FORMULA, and SEAL FILE. The CONTINUE button brings you back to the CREATE VARIABLES dialog box. The RENEW FORMULA button is used for demo purposes to show that Data Generator does re-generate the underlying formulae for all created variables that are designed to recalculate new values. This same mechanism is automatically triggered when students open the file and also whenever the F9 button is pressed(11). Therefore, each student will not only get a file of different values, but also the values come from different sets of underlying formulae. The SEAL FILE button is used when the instructor finishes creating all worksheets and is ready to
When a student first opens the file, the student will be informed that the file contains macros, and will be asked if (s)he wants to enable them or not. The students should select ENABLE MACROS(12). Once a student opens the file, Excel automatically unseals the file, regenerates all formulae and converts all formulae to values (using the COPY/PASTE SPECIAL/VALUES option in Excel). The file with the macro then closes and each student is left with a file containing his or her own unique data set. Excel then displays the following message: "Your data file is completely generated. Remember to save this TempDataFile.xls file with the name assigned by your instructor in a specific folder that you can find it."
3. Grading the Customized Questions After following the instructions in section 2.3 above, the students are ready to use the data file to answer the questions on the exam. In order to facilitate the discussion that follows, we have provided a few supplementary files that are explained in more detail in Appendix 1. The files are Final_Part_2.doc(13), which contains the test questions given to students as the
(11) If
users do not want to have the numbers constantly recalculate, they can select Options from the Tools menu and in the Calculation tab, check the Manual box and uncheck the Recalculate before saving box. Note that choosing these options will prevent all formulas from recalculating until the F9 key is pressed. (12) If the students' Excel security level is set so that it won't open macros, they will need change the security level for macro virus protection using the following steps: (In the Tools menu, point to Macro, and then click Security. Click the Security Level tab, and then click the Medium option. (13) http://ite.pubs.informs.org/Vol7No1/TsaiWardell2/Final_Part_2.doc
INFORMS Transactions on Education 7:1(136-148)
140
© INFORMS ISSN: 1532-0545
TSAI & WARDELL Creating Individualized Data Sets for Student Exercises Using Microsoft Excel and Visual Basic
take-home portion of the exam; final06.xls(14), which is the student's version of the data generator as explained in section 2.3; and sample_student_final.xls(15), which is an answer file that a student actually submitted; and grading_file.xls(16) , which we use to grade the students' exams as described in the rest of this section. Once students complete the exam, we ask that they turn their spreadsheet files in electronically (we usually have them do so via WebCT). We ask that the file that they submit contain a summary sheet with their answers (which is described in more detail below and which we usually provide). The file sample_student_final.xls(17) > is an example of what students turn in. At that point, we as instructors face the (sometimes monumental) task of grading the files that the students have submitted. As mentioned earlier, an obvious downside of creating a unique data set for each student is the time required to grade, as one answer key is not sufficient. Hence it is helpful if the grading procedure is also automated, which we have also done by using an Excel macro. We have found that the grading is greatly facilitated by giving students very explicit directions on how and where to report their answers (see the cover sheet of Final_Part_2.doc(18) ). In this section we describe the student instructions and then describe the grading macro.
3.1. 3.1 Instructions to Students When providing the questions on the regression model, we instruct students that they not change anything about the original data (e.g., don't delete the "Coffee" worksheet; don't move the data to other columns or rows). These instructions are necessary because the grading macro must copy the students' data into a grading worksheet and hence has to look for the data in specific locations(19). We also note to students that there are specific instructions as to where to put their answers. In fact, we have found it helpful to provide for them a separate worksheet that they can use to report their answers. Figure 7 and the result
of running the macro in final06.xls(20) show an example "Answer Summary" worksheet. The answer worksheet can vary in its sophistication. Some of the questions that we use require non-numeric responses. In early attempts of implementing these assignments, even though we gave students the exact verbiage to use in their responses, they often would slightly
Figure 7: Sample Answer Summary Sheet modify the wording and cause the grading macro to conclude the student response was incorrect. To alleviate this problem, we have used Excel's Data/Validation menu item. This feature in Excel allows users to create dropdown boxes (among other things) containing the possible answers. For example, in the coffee example we have students compare linear, quadratic and logarithmic fits to the data and select the model they consider to have the best fit. We have used data validation to provide them with the 3 choices. The bottom of Figure 7 shows how the answer cell (B21, for question 2f) appears. The dropdown box is visible, combined with short instructions. When students click on the dropdown box, the 3 choices appear as in Figure 8.
(14) http://ite.pubs.informs.org/Vol7No1/TsaiWardell2/final06.xls (15) http://ite.pubs.informs.org/Vol7No1/TsaiWardell2/sample_student_final.xls (16) http://ite.pubs.informs.org/Vol7No1/TsaiWardell2/grading_file.xls (17) http://ite.pubs.informs.org/Vol7No1/TsaiWardell2/sample_student_final.xls (18) http://ite.pubs.informs.org/Vol7No1/TsaiWardell2/Final_Part_2.doc (19) Another
option, which was suggested to us by a referee, is to alter the macro that creates the data file so that the student's data sets are pasted into a separate worksheet and stored for later use by the grading macro. We have not tried this option yet, but plan to in the future. (20) http://ite.pubs.informs.org/Vol7No1/TsaiWardell2/final06.xls
INFORMS Transactions on Education 7:1(136-148)
141
© INFORMS ISSN: 1532-0545
TSAI & WARDELL Creating Individualized Data Sets for Student Exercises Using Microsoft Excel and Visual Basic
Figure 8: Choices Using Excel's Data Validation Feature The idea behind the answer sheet is to do some "foolproofing" so that students put the answers in the right place and in the right form so that the grading macro finds and checks the right responses. As can be seen in Figures 7 and 8, we use a different color for the cells where we want students to report their answers. We also find it helpful to lock cells that are not to be used for student answers (and we protect the sheet so that students do not make other changes that would alter where and how answers are reported-see the result of running the file final06.xls(21), where you cannot click on a cell unless it is one provided for student answers, i.e., it is yellow). It may also be advisable to ask students to report answers to a specific number of decimal places, although we have found that the grading macro can be written so that it compares the first few decimal places of the students' response to those of the correct answers.
3.2. The Grading File and Macro The first grading step is for the instructor to create solutions to the problems. These solutions need to be dynamic rather than static. For example, we ask students to create a regression model that relates the sales of coffee to the number of dispensers. Our students use Excel's "Data Analysis" tools to find the solution. The results from the tools are static, i.e., do not change with changes to the data set (the data analysis has to be "re-run" if any changes to the original data are made). For the grading file, however, the instructor needs to use Excel functions that automatically update with data changes. For simple regression, for example, the functions SLOPE, INTERCEPT and RSQ can be used. For multiple regression, the array function LINEST is needed to find most of the regression statistics. (See the "Coffee" worksheet of the grading_file.xls(22) file. For example, in cells H2:J6 we use the LINEST function to estimate the quadratic regression model.)
Our grading file typically has one worksheet for each major problem. These worksheets have a place for the data and include the functions that find the solutions. The grading file also has a summary sheet (called "Grade Sheet" in grading_file.xls(23) ) that typically consists of 4 columns: one for question labels, one for the correct solutions, one for the student's solutions, and one that compares the student's solutions to the correct solutions using IF functions. For the last column, we also use conditional formatting as a visual cue to the grader to more easily see which questions the student answered correctly. We use green font if the student response is correct and red font if it needs to be checked further for details. Once the grading file is created, a grading macro can be used to check student answers. Our grading macro accomplishes two tasks. First, it copies the student's data to the corresponding worksheets in the grading file. Second, it copies the student's answers from her or his Answer Summary sheet into the third column of the grading file's summary sheet. This macro is quite easy to create. First, instructors can use TOOLS/MACRO/RECORD NEW MACRO and then record the key strokes required to copy and paste. The resulting VBA code, however, will specifically reference the student's file that was used (open) to record the macro. To alleviate this problem, we insert the following command into the code as the first line: CurrentFile = ActiveWorkbook.Name. (The code can be viewed and edited in the Visual Basic Editor, accessed using Alt-F11.) This command causes the student's file to be called CurrentFile. Then instructors can do a search and replace to insert CurrentFile wherever the name of the student's file occurs. Figure 9 shows the results of applying the grading macro to the file sample_student_final.xls(24). Note that we also added a column called, "Possible" to help with the grading task. Another thing that we have found useful is to keep a listing of comments that can be pasted into students' files providing them with feedback on what they have done incorrectly. We usually accompany those comments with the corresponding point deduction to help with making the grading consistent across students.
(21) http://ite.pubs.informs.org/Vol7No1/TsaiWardell2/final06.xls (22) http://ite.pubs.informs.org/Vol7No1/TsaiWardell2/grading_file.xls (23) http://ite.pubs.informs.org/Vol7No1/TsaiWardell2/grading_file.xls (24) http://ite.pubs.informs.org/Vol7No1/TsaiWardell2/sample_student_final.xls
INFORMS Transactions on Education 7:1(136-148)
142
© INFORMS ISSN: 1532-0545
TSAI & WARDELL Creating Individualized Data Sets for Student Exercises Using Microsoft Excel and Visual Basic
we used early on may prove useful. These methods should help mitigate both disadvantages above: namely, they can be used for almost any kind of problem that requires input data and they do not require extraordinary amounts of time. We have created a relatively simple algorithm that synthesizes the steps we have used to create customized data sheets. The steps of the algorithm follow. 1. For a specific problem, create a worksheet that has the data in a desired format or structure. For example, suppose that the instructor wants to have students solve a transportation problem. He or she would decide how the supply and demand values, as well as the cost matrix, should be presented to students and possibly type some sample numbers into the spreadsheet in the designated areas.
Figure 9: Sample Grading Sheet
4. A More General Approach to Data Set Creation The VBA file "Data Generator" that we have described has advantages and disadvantages. Most of the advantages have been described earlier. There are also some apparent disadvantages. First, the file is most directly applicable to statistics, and in particular, regression problems. Not all OR/MS instructors need such data sets. While the macro can be used to create data for other applications, using it to do so is not transparent. Second, the time required to create the VBA file was substantial and instructors may feel that the development cost outweighs the potential benefits of such an application. In this section, we describe an algorithm that we believe overcomes both disadvantages. Some historical background may be helpful in understanding how simpler, more general purpose macros can be created. We did not initially set out to create the Data Generator file. Instead, we tried simpler approaches to create more customized exams. The lessons that we learned were incorporated into more sophisticated applications until we decided to try to create an application from which many instructors might benefit (i.e., Data Generator). In most cases, the lessons that we learned had to do with making the files fool proof so that students did not modify the files in a way that would make it difficult to grade. For OR/MS instructors who don't feel that Data Generator meets their needs, some of the "methods" that INFORMS Transactions on Education 7:1(136-148)
143
2. Determine what distribution the input data will follow. For the transportation problem example, the instructor may want to have demands that are normally distributed, supplies that follow a discrete distribution, and costs that are uniformly distributed. This step also requires that parameters of the distribution be specified. We typically enter such parameters on the spreadsheet in a location that is somewhat far from the location of the data the students will see. 3. Replace the hard coded data entered in step 1 with functions that will simulate the desired distribution functions. For example, the function NORMINV(RAND(),μ,σ) will simulate a normal distribution. If whole numbers are desired, the ROUND function can be used (so for normal demands the function would be ROUND(NORMINV(RAND(),μ,σ),0)). In some cases we have created problems where the parameters themselves are also random variables within a small range. Any time a value needs to vary randomly, the RAND function can be used in Excel to accomplish the task. Many OR/MS textbooks have simulation chapters that describe how the RAND function can be combined with other functions to create the desired simulated distributions (see Albright and Winston 2005, for example). 4. Hide the worksheet (using Format/Sheet/Hide) that was just created and save the file. This step is in preparation for what will be presented to the students when they open the file.
© INFORMS ISSN: 1532-0545
TSAI & WARDELL Creating Individualized Data Sets for Student Exercises Using Microsoft Excel and Visual Basic
5. Repeat steps 1 - 4 for each subsequent test problem that requires a customized data sheet. At this point, we also create the Answer Summary Sheet described in section 3.2 and hide it. If desired, protect the workbook using Tools/Protection/Protect Workbook so that students will not be able to reveal the hidden worksheets. 6. Use Excel's TOOLS/MACRO/RECORD NEW MACRO command to create the VBA code "engine" of the macro. With the recorder on, unhide the worksheet(s), press the F9 key to recalculate the values, copy the cells with the embedded RAND functions, and use EDIT/PASTE SPECIAL/VALUES to "freeze" the data (i.e., to remove the formulas and paste only their values). Next, erase any auxiliary cells (e.g., those containing the parameters for the distributions) that the students don't need to see. The worksheet should now only have the data as the instructor wants them presented to the student. With the recorder still on, follow the above steps for every worksheet that is hidden. Once all sheets are revealed and the data are frozen, stop the macro recorder. 7. Open the VBA editor (TOOLS/MACRO/VISUAL BASIC EDITOR or Alt-F11) and add to the code that was recorded in previous steps in the following ways, if desired. 1. If the workbook was protected in step 5 above, the following code can be used to unprotect it automatically: ACTIVEWORKBOOK.UNPROTECT ("PASSWORD"), where PASSWORD is the password that was selected in step 5 above. 2. Our preference is for the macro to run automatically when the students open the file. The code provided in Appendix 2 causes Excel to prompt the student for his or her student id and then copies all of the desired worksheets into a new file named after the student's id. These lines of code should be copied into the "ThisWorkbook" object within the Microsoft Visual Basic Project. There are three specific names that we use in the code that other users may want to change. First, we assume that the macro that was recorded in step 6 above is called "Macro1." Second, we assume that the answer summary sheet is called "Answer Summary." Third, we assume that the only unhidden sheet of the file containing the macro is called "Intro." INFORMS Transactions on Education 7:1(136-148)
144
3. As mentioned in the footnote from section 3.1, the instructor may want to store the student's data for use later by the grading macro. For example, a new worksheet could be created where all of the student's data would be pasted. Then that worksheet could be hidden to the student. Doing so would alleviate the need to instruct students explicitly not to move or otherwise alter their data. In other words, this step would be a safeguard if the student alters his or her data in some way, so that the grading macro will use the "true" data used by the student. As this suggestion came to us from a referee, we have not implemented it at this point but plan to do so in the future. 4. We prefer that the students not see the code that we use to create the data set. Therefore we protect the macro file. To do so, use TOOLS/VBA PROJECT PROPERTIES, select the PROTECTION tab, lock the project for viewing and then select a password. At this point the instructor should have a file that can be distributed to students. The procedure does not require advanced knowledge of VBA programming and should be generally applicable to any type of problem that OR/MS instructors may want to create.
5. Conclusions We have suggested the use of individualized data sets for each student in classes requiring data analysis. Such exams allow instructors to provide students with interesting and challenging questions while reducing the chances of undesirable student collaboration. We have provided instructions for a macro that can be used to create such data sets for correlation and regression questions and have discussed a grading procedure for such assignments. We have also described an approach that allows instructors to create more general, yet customized, data sets. Our experience with customized exams and assignments is that they allow a greater learning opportunity for students because they compel students to do their own work rather than relying on work done by other students. Students are able to hone their analysis skills by practicing the methods on different data sets. By using full data sets rather than just a few numbers, © INFORMS ISSN: 1532-0545
TSAI & WARDELL Creating Individualized Data Sets for Student Exercises Using Microsoft Excel and Visual Basic
instructors also have the opportunity to discuss assumptions and interpretation of the analyses. We recognize that these data sets are not able to test students' ability to understand all of the underlying concepts that we attempt to teach in our courses. Hence we also ask conceptual questions about interpretation and assumptions. We honestly hope that no machine is ever able to duplicate completely the high level questions and responses that complex data analysis requires. Hopefully students will always be able to rely on engaging and creative instructors who help them to attack the most interesting and messy problems.
References Albright, C. and W. Winston. 2005. Spreadsheet Modeling and Applications: Essentials of Practical Management Science, Duxbury Press, Australia. Hambleton, K. H., H. Swaminathan and H.J. Rogers. 1991. Fundamentals of Item Response Theory, Sage Publications, Newbury Park, pp. 145-152. Larreamendy-Joerns, J., G. Leinhardt and J. Corredor. 2005. "Six Online Statistics Courses: Examination and Review," The American Statistician, Vol. 59, pp. 240-251. Neter, J., W. Wasserman, and M. H. Kutner. 1985. Applied Linear Statistical Models: Regression, Analysis of Variance and Experimental Design, Richard D. Irwin, Inc., Homewood, IL, pp. 305-313. Strickland, D. 2006. "Cheaters Never Win, But Sometimes They Make Better Grades," OR/MS Today, Vol. 33, pp. 14-15. Wainer, H. 2000. Computer Adaptive Testing: A Primer, 2nd Edition, Lawrence Erlbaum Associates, Publishers, Mahwah, New Jersey.
INFORMS Transactions on Education 7:1(136-148)
145
© INFORMS ISSN: 1532-0545
TSAI & WARDELL Creating Individualized Data Sets for Student Exercises Using Microsoft Excel and Visual Basic
Appendix Appendix I - Included Supplemental Files We have included 4 supplemental files with our submission. The files are Final_Part_2.doc(25), final06.xls(26), sample_student_final.xls(27) , and grading_file.xls(28) . Each is described briefly below. Final_Part_2.doc This is the Word file that contains the questions that we asked the students. It also includes instructions to the students. Note that it is Part 2 of a two-part exam. The first part of the exam contained more conceptual questions and did not require Excel. final06.xls This is the file that generates the data sets as explained in section 4. When opened the macro will begin automatically, prompt the student for his or her id, and then create the data file using the supplied id to name the file. Typically we would hide and protect the code, but for the purposes of the paper we have not done so. In order to see the VBA code associated with the file, it is necessary to disable the macro when opening it (because the macro starts automatically and closes the final06.xls file as soon as it is done running). Also, we have protected the workbook so that students cannot change its structure. The file can be unprotected using Tools/Protection/Unprotect Workbook and entering password when prompted for a password. Once unprotected, it is possible to unhide the hidden worksheets and see the functions that we used to simulate the data. sample_student_final.xls This is a file that a student submitted for the exam. It can be used to experiment with the grading macro. Both this file and "grading_file.xls" should be open, but this file should be the active file before running the grading macro. grading_file.xls This file contains the grading macro that we created using the methods described in section 3.2. It is used to check student answers automatically. With this file and the "sample_student_final.xls" file open, and the latter active, use CTRL-SHIFT-g to invoke the macro.
Appendix II - Code to Automatically Run the Recorded Macro Upon Opening the File Option Explicit Private Sub Workbook_Open() Dim NewFile, CurrentFile As String
(25) http://ite.pubs.informs.org/Vol7No1/TsaiWardell2/Final_Part_2.doc (26) http://ite.pubs.informs.org/Vol7No1/TsaiWardell2/final06.xls (27) http://ite.pubs.informs.org/Vol7No1/TsaiWardell2/sample_student_final.xls (28) http://ite.pubs.informs.org/Vol7No1/TsaiWardell2/grading_file.xls
INFORMS Transactions on Education 7:1(136-148)
146
© INFORMS ISSN: 1532-0545
TSAI & WARDELL Creating Individualized Data Sets for Student Exercises Using Microsoft Excel and Visual Basic
Dim WSheet As Worksheet Dim WSName As String Dim i, j, n As Long ' Store the name of the workbook containing the macro as CurrentFile. ' Then call the macro that unhides the worksheets and freezes the randomly ' generated values. CurrentFile = ActiveWorkbook.Name Call Macro1 ' Prompt the student for his or her student id and then name a new file ' using that id. NewFile = Application.InputBox(Prompt:="Please type in your student ID: ", _ Type:=2) NewFile = NewFile & ".xls" Workbooks.Add ActiveWorkbook.SaveAs Filename:=NewFile ' Count the number of default worksheets in the newly created file (to be used ' later) n = Workbooks(NewFile).Worksheets.Count ' Copy all of the worksheets that contain student data from the CurrentFile into ' the NewFile. The only worksheets that are not copied at this point are the ' intro and Answer Summary sheets. Windows(CurrentFile).Activate i =-1 For Each WSheet In ActiveWorkbook.Worksheets If WSheet.Name "Intro" And WSheet.Name "Answer Summary" Then WSName = WSheet.Name Worksheets(WSName).Copy before:=Workbooks(NewFile).Sheets(i) INFORMS Transactions on Education 7:1(136-148)
147
© INFORMS ISSN: 1532-0545
TSAI & WARDELL Creating Individualized Data Sets for Student Exercises Using Microsoft Excel and Visual Basic
End If i=i+1 Windows(CurrentFile).Activate Next ' Now copy the Answer Summary worksheet into the new file. For Each WSheet In ActiveWorkbook.Worksheets If WSheet.Name = "Answer Summary" Then WSName = WSheet.Name Worksheets(WSName).Copy before:=Workbooks(NewFile).Sheets(1) End If Next ' Delete all worksheets from the new file that don't contain data. For j = 1 To n Workbooks(NewFile).Worksheets(i + j).Visible = False Nextj ' Close the file that generates the data (the CurrentFile) Windows(CurrentFile).Activate ActiveWindow.Close SaveChanges:=False EndSub
INFORMS Transactions on Education 7:1(136-148)
148
© INFORMS ISSN: 1532-0545