APPLIED MEASUREMENT IN EDUCATION, 21: 141–161, 2008 Copyright © Taylor & Francis Group, LLC ISSN: 0895-7347 print / 1532-4818 online DOI: 10.1080/08957340801926151
Creating IRT-Based Parallel Test Forms Using the Genetic Algorithm Method
1532-4818 0895-7347 HAME Applied Measurement in Education Education, Vol. 21, No. 2, February 2008: pp. 1–41
Creating SUN, CHEN, Irt-Based TSAI, Parallel CHENG Test Forms
Koun-Tem Sun, Yu-Jen Chen, Shu-Yen Tsai, and Chien-Fen Cheng Institute of Computer Science and Information Education National University of Tainan
In educational measurement, the construction of parallel test forms is often a combinatorial optimization problem that involves the time-consuming selection of items to construct tests having approximately the same test information functions (TIFs) and constraints. This article proposes a novel method, genetic algorithm (GA), to construct parallel test forms effectively. The sum of squared errors of the generated TIFs produced by GA were compared with those of the Swanson and Stocking method, and the Wang and Ackerman method. Experimental results show that tests constructed using GA yielded lower error, and an average improvement ratio above 90%.
INTRODUCTION In education, many problems, such as the construction of parallel tests, are often difficult to solve with item response theory (IRT). The design of such parallel test forms can be performed by selecting items to approximate test information functions under constraints (Lord, 1952; Lord & Novick, 1968; Lord, 1980; Weiss, 1982; Hambleton & Swaminathan, 1985). The test construction problem (or item selection problem) also can be formulated as a zero-one combinatorial optimization problem (Papadimitrion & Steiglitz, 1982) but processing time will increase exponentially with the number of items in the item bank. This problem has been proven to be an “NP-hard” problem, that is, the solution time is not bounded by a polynomial of the size of the problem (van der Linden, 1998).
Correspondence should be addressed to Koun-Tem Sun, 33, Sec. 2, Su-Lin St., Tainan, Taiwan 700, ROC. E-mail:
[email protected]
142
SUN, CHEN, TSAI, CHENG
Many mathematical programming methods and heuristic methods have been developed to address the problem of solution time. These methods commonly involve the construction of parallel test forms in which the test information function (TIF) varies as little as possible between forms. The test information function can be computed by calculating the sum of the item information functions Ii(q) for the items included on the test (Birnbaum, 1968):
I (q ) =
m
∑ Ii (q ) ,
(1)
i =1
where m is the number of items in the test and q is the ability level. For constructing parallel tests, one test is dedicated the target test (see Table 1) and another test is designed to approximate the test information function of the target test. This can be expressed as Equation 2:
minimize E = ∑ (d (q ) − I (q ))2 ,
(2)
q
where d(q) is the target test information function and I(θ) is the constructed test information. The less deviation there is between the target test information function and the constructed test information function, the more satisfactory the test would be. With this approach, a test designer selects items which allow the information function of the constructed test to most closely approximate the target test information function. Because the item selection problem is a combinatory optimization problem, the number of combinations increases exponentially with the number of items in the item bank. For this reason, designers typically use weak methods (heuristic algorithms) such as linear programming (LP) techniques that are capable only of finding “good” but not “optimal” solutions (BoekkooiTimminga, 1987; Baker, Cohen, & Barmish, 1988; van der Linden & BoekkooiTimminga, 1989; Swanson & Stocking, 1993; Wang & Ackerman, 1997; van der
TABLE 1 An Example of the Target Test Information Function (One-Peak Shape) with Ability Levels Ranging from –2 to 2 Index of Ability Level (j)
Ability Level (qj) Target Test Information (d(qj) or dj)
1
2
3
4
5
–2.0 5
–1.0 7
0.0 20
1.0 6
2.0 4
CREATING IRT-BASED PARALLEL TEST FORMS
143
Linden, 1998). In linear programming techniques, items are selected to optimize objectives under certain constraints. Good solutions can be produced by a variety of other heuristic methods as well—methods such as the branch-and-bound method (Adema, 1989), the revised simplex method (Adema, 1990), the weighted deviation model (Swanson & Stocking, 1993), the network-flow algorithm (Armstrong & Jones, 1992; Armstrong, Jones, & Rutgers, 1996), the 0-1 linear programming (LP) techniques (Adema, 1992; Boekkooi-Timminga, 1990; Theunissen, 1986; van der Linden, 1994, 1998), the neural network technique (Sun & Chen, 1999), and the greedy approach (Sun, 2001). As noted earlier, test construction problems commonly involve a list of constraints (objective functions) serving various purposes (van der Linden & BoekkooiTimminga, 1989; Sanders & Verschoor, 1998; van den Linden & Reese, 1998z; Wightman, 1998), but the test information function (TIF) is the most common constraint or objective of all test design problems. With fewer constraints, the search space is larger, and vice versa. In this article, we will apply a novel method, genetic algorithm (GA), to solve two kinds of item selection problems. One problem considers only the deviation (error) of the TIFs between parallel tests having the same number of items. The other considers a variety of constraints, such as test length, content, topic, skill, and item length. Both of them have been labeled as “NP-hard” problems (Papadimitrion & Steiglitz, 1982). Since John Holland introduced the Genetic Algorithm (GA) in 1975 (Holland, 1975), many problems, especially optimization problems and search problems, have been studied and solved by the application of this technique (Goldberg, 1989; Davis, 1991; Whitley, 1993; Mitchell, 1996). The genetic algorithms have also been used in a large number of scientific and engineering problems and models, such as, optimization problems, machine learning, automatic programming, economics, and social systems (Mitchell, 1996). One after another, these areas have applied genetic algorithms and found very good results. Because the item selection problem can be seen as an optimization problem, the GA technique may be readily applied to it. The basic concept of GA is to generate solutions from one population of “chromosomes” (e.g., strings of zeros and ones, or “bits”) to a new population by using a kind of “natural selection” together with the genetics-inspired operators of crossover, mutation, and reproduction. Each chromosome consists of “genes” (e.g., bits), each gene being an instance of a particular “allele” (e.g., 0 or 1). The crossover operator exchanges subparts of two chromosomes with roughly mimicking biological recombination between two single-chromosome organisms; mutation randomly changes the allele values of some locations in the chromosome; and reproduction chooses which chromosomes in the population will be allowed to reproduce, and on average the fitter chromosomes produce more offspring than the less fit ones. Based on Schema Theorem (Holland, 1975; Goldberg, 1989), the generated chromosomes would come closer to optimal or
144
SUN, CHEN, TSAI, CHENG
near optimal solutions with each evolutionary process, resulting in a higher average-fitness of individuals in the population than existed in the previous cycle. Schema Theory A schema is a set of bit strings of ones, zeros, and asterisks, where each asterisk can assume either value 1 or 0. For example, 0**1 stands for a set of 4-bit strings. Each string in this set begins with 0 and ends with 1. These strings are called instances of the schema. Because GAs use a technique that makes the probability of reproduction proportional to chromosome fitness, the presence of a given schema in the next chromosome generation is predictable. Both crossover and mutation can destroy instances of a schema. The probability of survival under reproduction, crossover, or mutation can be represented as an equation (Equation 3) to describe the growth of a schema from one generation to the next. This is known as the Schema Theorem. ^
mH (i + 1) =
⎡ ⎛ l ⎞⎤ mH (i ) ⎢1 − pc × ⎜ d ⎟ ⎥ (1 − pm )n ⎝ l − 1⎠ ⎦ ⎣ f (i )
f H (i )
(3)
^
where i is the index of a generation, mH (i + 1) is the number of instances^ of the ^ schema H; f H (i )is the average fitness of the instances of the schema H; f (i ) is the average fitness of the chromosomes in generation i; pc and pm are, respectively, the probabilities of crossover and mutation; and l and ld are, respectively, the length of the chromosome and the defining length of schema H. The GA has the ability to recombine instances of good schemas to form instances of equally good or better schemas with higher fitness. A schema with above-average fitness will indeed tend to occur more frequently in the next generation of chromosomes, and a schema with below-average fitness will tend to occur less frequently. The optimal or good solutions will be found after hundreds or thousands of generations. Genetic Algorithm (GA) A simple GA works as follows: 1. Randomly generate a population with k n-bit chromosomes (each chromosome is the candidate solution to the problem and each bit in the chromosome represents the state of the gene). 2. Calculate the fitness, f(X), of each chromosome X in the population. 3. Repeat the following steps until k offspring have been generated: 1. Cross over a pair of chromosomes with probability pc (crossover probability, defined by the user, is a value that may be changed for different
CREATING IRT-BASED PARALLEL TEST FORMS
145
applications) at a randomly chosen point or multiple points to exchange parts of chromosomes and to form two offspring (as shown in Figures 1 and 2). 2. Mutate the state of the gene in the chromosome with probability pm (mutation probability, defined by the user, is a value that may be changed for different applications), and place the resulting chromosomes in the new population (as shown in Figure 3). 3. Select a number of chromosomes with the probability pr (reproduction probability, defined by the user, is a value that may be changed for different applications) from the current population, the probability of selection of a given chromosome being its higher degree of fitness. The greater the fitness of a chromosome, the higher the probability of being selected. In addition, the best solution in the current population is selected. The selected chromosomes reproduce to create the new population. 4. Replace the current population with the new population. 5. If the number of generations reaches the preset value or if the required solution is obtained, then stop. Else, go to step 2 to produce the next generation. Each iteration of this process is called a generation, and the entire set of generations is called a run. The flow chart of the basic GA is shown in Figure 4.
crossover point
crossover point Parent: A = 0011 0011 001100 B = 1100 1100 000000
cross over
Offspring: A’= 0011 1100 001100 B’= 1100 0011 000000
FIGURE 1 An illustration of a 1-point crossover operation at the 8th bit position for a pair of chromosomes.
crossover point
crossover point
Parent: crossover Offspring: A = 0011 0011 001100 B = 1100 1100 000000
A’ = 0011 1100 001100 B’ = 1100 0011 000000
FIGURE 2 An illustration of the two-point crossover operation in the middle of chromosome strings.
146
SUN, CHEN, TSAI, CHENG
mutation point Parent: mutation A = 00110011001100
FIGURE 3
mutation point Offspring: A’= 00110011101000
An example of mutation operation at the 9th and the 12th bit positions.
There is no formula for setting the parameters for evolution, but knowing the effect the parameters have on the results helps in selecting appropriate parameters. For example, if the reproduction probability, pr, is set high, it results in fewer changes to the individuals in the next generation and, consequently, the evolution rapidly converges to a local optimal solution, which may not be good enough. But if the reproduction probability, pr, is set low, this results in a variety of individuals in the next generation and, as a result, the evolution slowly converges to a good solution. Hence, the reproduction probability, pr, is often set to 0.1 ~ 0.2. For a similar reason, the crossover probability, pc, is set high, resulting in a higher probability of generating new individuals with better fitness in the next generation and, as a result, the evolution converges to a good solution with higher probability. But if the crossover probability, pc, is set low, this results in fewer changes to the individuals in the next generation and, as a result, the evolution converges to a good solution, but with difficultly. Consequently, the crossover probability, pc, is often set to 0.8 ~ 0.9. The mutation probability, pm, is often used to escape from the local minimums during the evolutionary processes. A larger pm may cause instability and, as a result, the evolution may not converge to an optimal or even to a local optimal solution. Thus, the pm is often set to a small value of 0.01 ~ 0.0001. These values can also be dynamically updated instead of remaining a fixed value during evolutionary processes.
TEST CONSTRUCTION METHODS Many effective methods have been proposed to automatically select items for parallel test forms (e.g., Yen, 1981; Theunissen, 1985; Theunissen, 1986; van der Linden, 1987, 1994, 1998; Ackerman, 1989; Boekkooi-Timminga, 1989; van der Linden & Boekkooi-Timminga, 1989; Adema, 1990; Boekkooi-Timminga, 1990; Adema, 1992; Swanson & Stocking, 1993; Wang & Ackerman, 1997; Sanders & Verschoor, 1998; van den Linden & Reese, 1998; Wightman, 1998; Sun & Chen, 1999; and Sun, 2001). The item selection problem can be formulated as a kind of linear programming problem. It could be represented as follows.
CREATING IRT-BASED PARALLEL TEST FORMS
Start Randomly generate a population of chromosomes (possible solutions) of size N: x1, x2, ..., xN
Calculate the fitness of each chromosome (evaluate the quality of each possible solution): f(x1), f(x2), ..., f(xN)
Is the termination criterion satisfied?
Yes
No
According to the fitness, select a pair of chromosomes for mating (the fitter one with the higher probability)
With the crossover probability Pc, exchange parts of the two selected chromosomes and create two offspring
With the mutation probability Pm, randomly change the gene values in the two offspring chromosomes
With the reproduction probability Pr, select the chromosome with the better fitness as offspring
Place the resulting chromosomes in the new population
No
Is the size of new population equal to N? Yes
Replace the current chromosome population with the new population
Stop
FIGURE 4
Flowchart for the GA method.
147
148
SUN, CHEN, TSAI, CHENG
Linear Programming Method The basic model of this method is n
maximizeO j = ∑ I i (q j ) xi , j = 1 ~ s.
(4)
i =1
(maximize the information at each ability levelθj; xi is the state (0 or 1) of item i) subject to
kq ≥
∑ Ai,q xi ≥ kq′ ,
q = 1 ~ p,
(5)
i ∈Cq
where p is the number of total constraints, Ai,q is the qth content attribute of item i, Cq is the qth constraint and kq and kq′ are the constraint values. However, because our goal is to minimize the deviation between the parallel s
2 tests, Equation 4 is modified to Equation 2: minimize E = ∑ (d j − O j ) . Under j =1
this modification, the LP technique would not find the optimal solution, but rather an approximate solution. Some other strategies would then be required to solve this problem. A common strategy for selecting items uses binary programming. However, due to the rapidly increasing complexity of a computation, the binary programming model has difficulty solving a problem with a large number of constraints. Several heuristic methods have been developed to address this problem. Two heuristic methods (the Swanson and Stocking method [1993] and Wang and Ackerman method [1997]) were compared to the genetic algorithm. Swanson and Stocking Method The Swanson and Stocking method (1993), based on binary programming model, adds some slack variables into the constraints to generate weighted deviations. The heuristic involves two phases, a selection phase and a replacement phase, to solve the optimal equation. These phases can be expressed in the following steps and equations: 1. Binary programming models Let i = 1, 2, …, N index the items in the pool, and xi denote the item i that is included in (xi = 1) or excluded from (xi = 0) the test. Let j = 1, 2, …,J index the item properties associated with the constraints; let Lj and Uj be the lower bound and upper bound, respectively, and let aij be 1
CREATING IRT-BASED PARALLEL TEST FORMS
149
if item i has property j and 0 if it does not. Then, the model optimizing the objective function z (e.g., minimizing the sum of positive deviation from the target test information) for a test of fixed length n is specified as: Minimize z subject to N
∑ xi = n, where x i ∈{0, 1}, i = 1, ..., N ,
(6)
i =1
N
∑ aij xi ≥ L j , j = 1,..., J ,
(7)
i =1
N
∑ aij xi ≤ U j , j = 1,..., J ,
(8)
i =1
2. Weighted deviations model Some slack variables (dLj, dUj, eLj, eUj) are added into Equations 7 and 8, resulting in a new model, the weighted deviations model: J
J
j =1
j =1
Minimize z and ∑ w j dLj + ∑ w j dUj ,
(9)
subject to N
∑ xi = n,
where xi ∈{0, 1}, i =1, ..., N ,
i =1 N
∑ aij xi + dLj − eLj = L j , j = 1,..., J ,
(10)
i =1
N
∑ aij xi − dUj + eUj = U j , j = 1,..., J , i =1
dLj , dUj , eLj , eUj ≥ 0, j =1, ..., J .
(11)
150
SUN, CHEN, TSAI, CHENG
3. Heuristic approach The heuristic approach contains two phases: the selection phase and the replacement phase: Selection phase: 3.1. For every item i not already included in the test, compute the expected weighted sum of positive deviations that would be obtained if item i were added to the test. 3.2. Sum the weighted dLj and dUj across all constraints j to form the weighted sum of positive deviations that would be expected if item i were added to the test. 3.3. Select the item i* with the smallest expected weighted sum of positive deviations, and add it to the test. 3.3. Repeat steps (3.1) to (3.3) until n items have been selected. Replacement phase: 3.3. Select the (n+1)th item according to steps (3.1) through (3.3). Provisionally add the item to the test. 3.3. Find an item already included in the test whose removal would most reduce the weighted sum of positive deviations. 3.3. If the addition and removal process would reduce the weighted sum of positive deviation, then add the replacement item (found in step (3.5)) to the test, remove the item found in step (3.6), and repeat steps (3.5) and (3.6). Otherwise, stop. This method can monotonically improve the weighted sum of positive deviations, and efficiently find good solutions. Wang and Ackerman Method Wang and Ackerman (1997) proposed two algorithms: TESTGEN1 and TESTGEN2. TESTGEN2 is similar to TESTGEN1, but is capable of handling multiple content information functions. For minimizing the deviation between the parallel tests, we consider only the TESTGEN1 algorithm. The basic idea of TESTGEN1 is to select the item according to the size of difference between the target test information function and the test information function of the test being constructed. In this way, the new selected item will minimize the greatest difference if it is added to the test. The compute difference and add item process is repeated until n items are selected. Then, the “EQUALIZER1” process is carried out to minimize the difference in information between all of the created forms until no further improvement occurs. TESTGEN1 can be described as the following steps:
CREATING IRT-BASED PARALLEL TEST FORMS
151
1. Select an item from the pool such that the difference between the target test information and the test information of the test being constructed is at a minimum when that item is brought into the test. 2. Compute the test information and content information after an item is added. 3. Repeat steps (1) and (2) until n items are selected for each form. EQUALIZER1: 4. Compute the difference between all of the created forms and select the pair of forms having the greatest difference. 5. Exchange two items that exist in the pair of forms having the greatest difference in step (4) between the two forms to minimize the difference. 6. Go to step (4) if the difference can be further improved. Otherwise, stop. This method essentially follows the pattern of a “goal seeking” and “exchange items” heuristic that can efficiently obtain multiple parallel test forms. These previously proposed methods can efficiently construct parallel test forms. However, there is typically a gap in the test information functions between the parallel test forms. The following section will introduce a novel technique, GA, to construct the parallel test forms designed to reduce this problem.1
PARALLEL TEST CONSTRUCTION BY THE GENETIC ALGORITHM The basic idea of the proposed GA to the test construction problem is to randomly code a set of solutions (i.e., initial population) to this problem as a set of binary strings with each bit in the string representing the state of an item which is selected to be included in (set to one) or excluded from (set to zero) the test. Then, a new set of solutions is generated by the genetic operations of crossover, mutation, and reproduction. The evolution of chromosome strings (e.g., the selection of items) will proceed until the number of generations reaches a preset value. Then, the most “fit” chromosome string is the solution to the problem. For the test construction problem, the chromosome string and the fitness function are designed as follows. A binary string (i.e., chromosome), X, is used to represent the state of all items in the item bank. For example, if there are 1000
1 This approach was simple and the execution time of generating parallel form is similar in each iteration. Execution time was linearly increased proportional to the number of parallel test forms.
152
SUN, CHEN, TSAI, CHENG
items in an item bank, then the length of chromosome is set to 1000. Each element in X, xi, i = 1 ~ n, is used to represent the state of item i which is included in (xi = 1) or excluded from (xi = 0) the test being constructed. Then, the fitness function for evaluating the score of a chromosome is defined as in Equation 2: s
E = ∑ (d j − O j )2 . The lower the value of the fitness function, the less deviaj =1
tion there is between the parallel tests. In other words, the lower the value of the fitness function, the higher the fitness in the population. Based on the fitness function, the chromosome strings in the new population can be generated by genetic operations and then a better solution can be found. At the final generation, the best chromosome string with the lowest fitness value (i.e., the least deviation) will be the final solution that closely approximates the target test information function. The detailed operations of the proposed approach are described in what follows. The Genetic Algorithm for Item Selection Problem In applying the GA to the item selection problem, the system first computes the item information function at the specified ability level for each item. It then sets the initial state of each chromosome string, X, containing n-bits, where n is the number of items in the item bank, randomly assigning m bits to be “1” and the rest to be “0.” The state of bit xi in the chromosome represents the corresponding item i that is included in (xi = 1) or excluded from (xi = 0) the test. For each chromosome, the deviation between the test information function of the constructed test and the test information function of the target test is computed. The value of Equation 2 ( E = ∑ (d j − O j )2 ) is then defined as the fitness function for the j
evolutionary process. By applying the genetic operations of crossover, mutation, and reproduction, the population in the new generation can be obtained such that better chromosome strings (i.e., those having the least deviation) may be generated. The detailed operations for this approach are stated as follows: 1. Set the initial population of chromosome strings and parameters of the evolutionary process. An initial population of P chromosome strings is randomly generated, with each containing n binary bits in which m bits are randomly selected to be “1” and the rest are “0”. The crossover, mutation, and reproduction probabilities are set to pc, pm, and pr, respectively. The maximum number of generations is set to gener_no, and the initial generation number, t, (the iteration index) is set to one. 2. Compute the values of fitness functions for all chromosome strings k in the population.
CREATING IRT-BASED PARALLEL TEST FORMS
153
s
fitness( X k ) = ∑ (d j − O kj )2 , k = 1 ~ p,
(12)
j =1
where O kj is the value of the test information function at ability level j of s ability levels for chromosome k. This can be computed by: n
O kj (t ) = ∑ wij xik (t ), ∀j = 1 ~ s.
(13)
i =1
where wij is the item information function for item i at ability level j, and xik (t )is the state of item i in the chromosome k at time t. The lower the fitness value (deviation), the better the result. When the constraints (listed in Table 2) are considered, the fitness(Xk) (in Equation 12) is increased by one when one constraint is obeyed in Equation 5
fitness(X k ) = fitness(X k ) + r , if r of p satisfies
∑ Ai,q xi > kq or ∑ Ai,q xi < kq′
Cq i ∈C
(14)
i ∈Cq
where r is the number of constraints which are not satisfied by the constraints in Equation 5. 3. For each chromosome k in the population, complete the following genetic operations for generating P offspring. TABLE 2 Examples of Constraints Often Included in the Item Selection Problem Description Test length (the number of items in the test, Item Number) Test information function (TIF) Number of items per topic (Topic) Number of items using a certain skill (Skill) Item length (number of words in the item) (Length) Number of items per cognitive level (Level) Limits on number of items used (Exposure Rate) Number of items per content category (Content) Mutually exclusive/dependent items (Dependence) Number of overlapped items (Overlapped)
154
SUN, CHEN, TSAI, CHENG
3.1. The offspring for each pair of parents is generated with the probability pc. A section of the chromosome string in the offspring is the same as one parent and else is the same as the other parent (as shown in Figure 2). Note that a two-point crossover is used in our method since it is more flexible than one-point crossover. 3.2. For all chromosome strings, a mutation probability, pm, is used to select some parent chromosomes that will change the state of the gene (xi) randomly. Gene (xi) then becomes the offspring. 3.3. The best chromosome strings are found in the “parent” population having the reproduction probability pr. These then become the offspring which make up the new population. 3.4. If the best chromosome in the offspring satisfies the requirements of the test designer, or the generation number reaches the maximum (= gener_no), then the evolutionary process is stopped. Otherwise, the generation number is increased by one, and the cycle continues again starting at step 2.
t ← t + 1.
(15)
4. Stop. At the end of computation, the best chromosome string is the solution of the GA method for the item selection problem and the genes with state xi = 1, for all i, are the items selected for inclusion in the constructed test. In the proposed GA approach, all chromosome strings are selected by the genetic operations such that the newly generated chromosome strings are more fit in light of the requirements defined by the test designer. In this way, a better solution for the item selection problem can be obtained after each generation. Performance Evaluation In this section, we present experimental results comparing the test construction methods. We developed a simulation tool to generate a virtual item bank containing 1000 three-parameter items and constraints (see Table 3). The values of the parameters and attributes in the constraints were randomly generated. In this way, we could select items for constructing various test forms. For example, if a test designer wanted to filter out two groups of students with abilities at the midhigh and the mid-low, then a two-peak target test information function (i.e., an “M” shape with one peak located at the mid-high ability level and the other at the mid-low ability level) is required. If a test designer wants only to separate students into two groups— those who have passed intermediate ability versus
CREATING IRT-BASED PARALLEL TEST FORMS
155
TABLE 3 The Ranges of Item Parameters and Constraints Used in the 1000-Item Bank Three parameters Attributes Information Range Type Mean SD
Constraints
a
b
c
Content
Topic
Skill
Length
0.8 ~ 3.0 real 1.916 0.627
–3.0 ~ +3.0 real –0.013 1.740
0.1 ~ 0.3 real 0.201 0.059
1 ~ 10 integer 5.396 2.893
1~5 integer 2.989 1.381
1~6 integer 3.515 1.675
20 ~ 50 integer 34.854 8.909
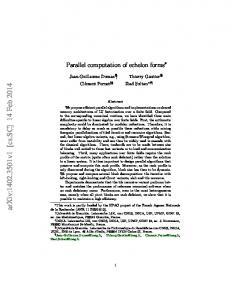
those who have not, then a single peak information function (i.e., a “^” shape with the peak located at the intermediate ability level) is required. For evaluating the performance of our method, we first constructed the parallel test forms by using the proposed genetic algorithm and the Swanson and Stocking method (1993), and Wang and Ackerman method (1997). The amount of information on the target tests varied within the ranges 4~5, 6~8, 18~21, 6~8, 4~5 for ability levels –2, –1, 0, 1, 2, respectively, for a one-peak shaped test information curve and 5~6, 11~13, 7~9, 11~13, 5~6 for ability levels –2, –1, 0, 1, 2, respectively, for a two-peak shaped test information curve. Following the limitations of the information quantities defined in these two distributions, one hundred target test information functions were randomly generated for each one. The parameters for evolution were defined as follows: n = 1000, m = 40, P = 150, pc = 86.3%, pm = 0.4%, pr = 13.3%, and the gener_no = 2000. Within 100 generations, GA yielded very good results. The curves of test information functions constructed by the different methods are shown in Figures 5 and 6. The average deviations (i.e., the sum of the squared errors) between the information functions of the target tests and those of the constructed tests are shown in Table 4. We see that the proposed genetic approach greatly reduced error, with average improvement ratios greater than 98.40%. To evaluate the GA method on more ability levels, we specified the test information functions at 21 ability levels (θ). The values of the information functions were about 6.5 ± 0.1 at 21 ability levels –2.0, –1.8, –1.6, …,2.0, respectively. One hundred target test information functions were randomly generated and the parameters of GA were defined as in previous cases except a smaller item bank (n = 320) and a shorter evolution time (generation_no = 600) were used. These methods were executed on a personal computer (Pentium 4) with 512M RAM. Figure 7 shows the target information curves generated by the GA, Swan and Stocking’s method and Wang and Ackerman’s method. The sum of squared errors and computing time for the GA, Swan and Stocking’s method, Wang and Ackerman’s method are shown in Table 5. The quality of the results generated by the GA method is much better than other methods with an improvement ratio above 95%.
156
SUN, CHEN, TSAI, CHENG
Test Information Curves 25 Target
Information
20 Swanson & Stocking
15 10
Wang & Ackerman
5 GA 0
–2
–1
0 Ability
1
2
FIGURE 5 Test information curves (one-peak shape) for a target test. The tests were produced by the Swanson & Stocking Method, the Wang & Ackerman Method, and the genetic algorithm.
14
Test Information Curves
13
Target
12 Information
11 Swanson & Stocking
10 9 8
Wang & Ackerman
7 6
GA
5 4 –2
–1
0 Ability
1
2
FIGURE 6 Test information curves (two-peak shape) for a target test. The tests were produced by the Swanson & Stocking Method, the Wang & Ackerman Method, and the genetic algorithm.
We also considered more constraints such as Content, Topic, Skill, and Length. The numbers assigned to the Content, Topic, Skill, and Length were, 5, 10, 6, and 40, respectively, which resulted in 62 constraints overall. The sum of squared errors for the GA, Swan and Stocking, and Wang and Ackerman methods shown in Table 6 reveal that the results generated by the GA were much
CREATING IRT-BASED PARALLEL TEST FORMS
157
TABLE 4 Average Deviations between the Information Function of the Target Test and the Information Function of the Constructed Test for the Construction Methods Methods Conditions One-peak distribution Two-peak distribution Average Improvement Ratio* (%)
Genetic Algorithm
Swanson & Stocking
0.01392 0.00569 0.00981 —
Wang & Ackerman
0.9715 0.2755 0.6245 98.3976
12.8340 2.9536 7.8938 99.8758
*Improvement Ratio (%) = (errorx– errorg) / errorx × 100.errorg: the errors (deviations) generated by the genetic algorithm.errorx: the errors (deviations) generated by the Swanson & Stocking Method, or the Wang & Ackerman Method.
Test Information Curves
9
Target
Information
8 Swanson & Stocking
7
Wang & Ackerman
6 5 4
Genetic Algorithm –2 –1.6 –1.2 –0.8 –0.4 0 0.4 0.8 1.2 1.6 Ability
2
FIGURE 7 Test information curves for a target test (uniform distribution). The tests were produced by the Swanson & Stocking Method, the Wang & Ackerman Method, and the genetic algorithm.
TABLE 5 Average Deviation, Improvement Ratio, and Computing Time for Each Solution Generated by Different Methods for the Target Test Information Values in Uniform Distribution Methods Conditions Average of squared error Improvement Ratio* (%) Computing time (min.:sec’)
Genetic Algorithm 0.5321 — 2:13’
Swanson & Stocking 13.7572 96.1321 0: 0.95’
Wang & Ackerman 12.4689 95.9021 0: 1.63’
158
SUN, CHEN, TSAI, CHENG
TABLE 6 The Deviation (Sum of Squared Errors) of the Experimental Results in Constructing 40-Item Parallel Tests from a 1000-Item Bank by Using GA, the Swanson & Stocking Method, and the Wang & Ackerman Method Type 1 (considered only TIF)
Methods Conditions
GA
Target TIF is (4, 6, 12, 6, 4) 0.03412 Target TIF is (4, 10, 4, 10, 4) 0.03328 Average 0.03370 Improvement Ratio* (%) —
Swanson & Wang & Stocking Ackerman 0.05182 3.96273 2.02405 98.3
Type 2 (additional constraints*)
GA
0.01098 0.06009 1.10379 0.03328 0.55739 0.04668 93.9 —
Swanson & Wang & Stocking Ackerman 0.81049 2.51856 1.66453 97.2
0.02819 1.06994 0.54907 91.5
*Constraints: (1) Topic (1 ~ 5): at least four items were selected from each topic, (2) Content (1 ~ 10): at least 2 items were selected from each content area, (3) Skill (1 ~ 6): at least three items were selected from each skill, and (4) Length (20 ~ 50): the length of each selected item was less than 45 (for 40 items).
better than those for the other methods. Note that the sum of squared errors is considerably lower for the GA technique with improvement ratios for 91.5% and 97.2%. The sum of squared errors for the GA, Swan and Stocking’s method, Wang and Ackerman’s method are shown in Table 6. The quality of the results generated by the GA method is much better than other methods. In practice, the genetic algorithm also can be used to develop two parallel test forms to evaluate contrasting abilities between two groups of students. Because the similarity of contents and test information functions between these two parallel tests will affect the precision of ability estimation among these two groups of students, the less the deviation between parallel tests have, the higher the precision of ability estimation. In Table 7, we report results for both single and double peaked TIFs. In each case, we generated multiple (1–6) parallel test forms using the GA. Tests included in each form were mutually exclusive and were executed 100 times for different initial states of the GA. The simulation results shown in Table 7 indicate that the GA yielded very low error even when the number of parallel test forms was increased.2
2 The method of GA to produce three or more parallel test forms is similar to the procedure for two parallel test forms. The procedure for generating n parallel test forms is: 1. Initially set the number of parallel test forms to be 0. 2. Based on the setting constraints, generate one parallel test form with respect to the target TIF (the same procedure as two parallel test forms’ construction, the selected items would be excluded from other test forms) and the parallel test form number is increases by one. 3. If the parallel test form’s number is equal to n, then stop; else go to step 2 for next generation.
159
CREATING IRT-BASED PARALLEL TEST FORMS
TABLE 7 The Averages of Deviation (Sum of Squared Error) of the Experimental Results in Constructing 30-Item Multiple Parallel Tests by Using GA Number of parallel test forms Target TIF (4, 6, 12, 6, 4) (4, 10, 4, 10, 4) Average of squared errors ( × 10–1)
1
2
3
4
5
6
0.45438 0.79524 0.62481
0.52138 0.96115 0.741265
0.55350 1.0768 0.81515
0.83788 1.4582 1.1480
0.71245 1.4561 1.0842
0.67262 1.2379 0.9552
CONCLUSIONS In this article, a novel method based on the genetic algorithm (GA) was proposed to construct a desired test from an item bank. The proposed method can effectively construct parallel tests whose test information functions closely approximate that of a target test. Two different sizes of item banks, one with 1000 items and the other with 320 items, were used to evaluate the performance of our method against two popular alternate methods. The experimental results show that the proposed approach is able to efficiently obtain very good results that are much better than those of other methods with an average improvement ratio exceeding 90%. The GA successfully constructs parallel tests under a large number of constraints. When the test specifications are formulated as model constraints, the fitness function of the GA can be derived by combining the constraint equations and the goal function. After applying the genetic operations (crossover, mutation, and reproduction), the solutions are nearly optimal in satisfying all test specifications. The primary advantages of the GA are (1) that it can solve very large problems that cannot be run on a microcomputer implementing a linear programming approach and (2) that the GA approach is flexible in solving various constraints in that it only requires inputting the constraint equations into the fitness function of the GA. In future work, we hope to improve the efficiency of the genetic algorithm, and to construct multi-parallel forms for IRT-based and classical-test theorybased test construction. More constraints will also be considered such as restrictions on item overlap. As a sequential process, items that overlap with a selected item can be easily excluded from further consideration. Similarly, the simultaneous production of multiple parallel tests should be easily incorporated into the GA method by transforming the constraints fed into the fitness function. The GA can be used operationally to generate parallel forms for a wide variety of educational and psychological measures. Comparisons between results obtained from
160
SUN, CHEN, TSAI, CHENG
the GA approach and other methods reported here underscore the promise of the GA for improving measurement practice and decision making.
ACKNOWLEDGMENTS This research was supported by the National Science Council of Taiwan, ROC, under the grant NSC 93-2520-S-024-004.
REFERENCES Ackerman, T. (1989). An alternative methodology for creating parallel test forms using the IRT information function. The Annual Meeting of the National Council for Measurement in Education, San Francisco. Adema, J. J. (1989). Implementations of the branch-and-bound method for test construction problems. Research Report 89-6. Enschede: Department of Education, University of Twente, The Netherlands. Adema, J. J. (1990). A revised simplex method for test construction problems. Research Report 90-5. Enschede: Department of Education, University of Twente, The Netherlands. Adema, J. J. (1992). Methods and models for the construction of weakly parallel tests. Applied Psychological Measurement, 16(1), 53–63. Armstrong, R. D., & Jones, D. H. (1992). Polynomial algorithms for item matching. Applied Psychological Measurement, 16(4), 365–371. Armstrong, R. D., Jones, D. H., & Rutgers, X. L. (1996). A study of a network-flow algorithm and a noncorrecting algorithm for test assembly. Applied Psychological Measurement, 20(1), 89–98. Baker, F. B., Cohen, A. S., & Barmish, B. R. (1988). Item characteristics of tests constructed by linear programming. Applied Psychological Measurement, 12(2), 189–199. Birnbaum, A. (1968). Some latent trait models and their use in inferring an examinee’s ability. In F. M. Lord & M. R. Novick (Eds.), Statistical theories of mental test scores (pp. 395–479). Reading, MA: Addison-Wesley. Boekkooi-Timminga, E. (1987). Simultaneous test construction by zero-one programming. Methodika, 1, 101–112. Boekkooi-Timminga, E. (1989). Models for computerized test construction. The Haag, The Netherlands: Academisch Boeken Centrum. Boekkooi-Timminga, E. (1990). The construction of parallel tests from IRT-based item bank. Journal of Educational Statistics, 15, 129–145. Davis, L. (Ed.) (1991). Handbook of genetic algorithms. NY: Van Nostrand Reinhold. Goldberg, D. E. (1989). Genetic algorithms in search, optimization, and machine learning. Reading, MA: Addison-Wesley. Hambleton, R. K., & Swaminathan, H. (1985). Item response theory—Principles and applications. Netherlands: Kluwer Academic Publishers Group. Holland, J. H. (1975). Adaptation in natural and artificial systems. Ann Arbor: University of Michigan Press. Lord, F. M. (1952). A theory of test scores. Psychometric Monograph, No. 7. Lord, F. M. (1980). Applications of item response theory to practical testing problems. Hillsdale, NJ: Erlbaum.
CREATING IRT-BASED PARALLEL TEST FORMS
161
Lord, F. M., & Novick, M. R. (1968). Statistical theories of mental test scores. Reading, MA: Addison-Wesley. Mitchell, M. (1996). An introduction to genetic algorithms. London: MIT Press. Papadimitrion, C. H., & Steiglitz, K. (1982). Combinatorial optimization: Algorithms and complexity. Englewood Cliffs, NJ: Prentice-Hall, Inc. Sanders, P. F., & Verschoor, A. J. (1998). Parallel test construction using classical item parameters. Applied Psychological Measurement, 22(3), 212–223. Sun, K. T., & Chen, S. F. (1999). A study of applying the artificial intelligent technique to select test items. Psychological Testing, 46(1), 75–88. Sun, K. T. (2001). A greedy approach to test construction problems. Proceedings of the National Science Council (Part D): Mathematics, Science, and Technology Education, 11(2), 78–87. Swanson, L., & Stocking, M. L. (1993). A model and heuristic for solving very large item selection problems. Applied Psychological Measurement, 17(2), 151–166. Theunissen, T. J. J. M. (1985). Binary programming and test design. Psychometrika, 50, 411–420. Theunissen, T. J. J. M. (1986). Optimization algorithms in test design. Applied Psychological Measurement, 10(4), 381–389. van der Linden, W. J. (1987). Automated test construction using minimax programming. In W. J. van der Linden (Ed.), IRT-based test construction (pp. 1–16). Enschede, The Netherlands: Department of Education, University of Twente. van der Linden, W. J. (1994). Optimum design in item response theory: Applications to test assembly and item calibration. In G. H. Fischer & D. Laming (Eds.), Contributions to mathematical psychology, psychometrics, and methodology (pp. 308–318). New York: Springer-Verlag. van der Linden, W. J. (1998). Optimal assembly of psychological and educational tests. Applied Psychological Measurement, 22(3), 195–211. van der Linden, W. J., & Boekkooi-Timminga, E. (1989). A maximum model for test design with practical constraints. Psychometrika, 54, 237–247. van der Linden, W. J., & Reese, L. M. (1998). A model for optimal constrained adaptive testing. Applied Psychological Measurement, 22(3), 259–270. Wang, C. S., & Ackerman, T. (1997). Two item selection algorithms for creating weakly parallel test forms using the IRT information functions. Psychological Testing, 44(2), 123–140. Weiss, D. J. (1982). Improving measurement quality and efficiency with adaptive testing. Applied Psychological Measurement, 6(4), 379–396. Wightman, L. F. (1998). Practical issues in computerized test assembly. Applied Psychological Measurement, 22(3), 292–302. Whitley, L. D. (1993). Foundations of genetic algorithms 2. San Francisco, CA: Morgan Kaufmann. Yen, W. M. (1981). Using simulation results to choose a latent trait model. Applied Psychological Measurement, 5(2), 245–262.