31
CREATING MODEL FOR TECHNOLOGICAL PROCESS OF INERTISATION MODELOVÁNÍ TECHNOLOGICKÉHO PROCESU INERTIZACE Lukáš OTTE 1, Vladislav VANČURA 2, Roman DANEL 3, Michal ŘEPKA 4 1
Ing, Ph.D, Institute of Economics and Control Systems, Faculty of Mining and Geology , VŠB – Technical University of Ostrava, 17. listopadu 15, Ostrava , tel. (+420) 596 993 840 e-mail:
[email protected]
2
Ing, Ph.D, Institute of Economics and Control Systems, Faculty of Mining and Geology , VŠB – Technical University of Ostrava, 17. listopadu 15, Ostrava , tel. (+420) 596 995 449 e-mail:
[email protected]
3
Ing, Ph.D, Institute of Economics and Control Systems, Faculty of Mining and Geology , VŠB – Technical University of Ostrava, 17. listopadu 15, Ostrava , tel. (+420) 596 994 446 e-mail:
[email protected]
4
Ing, Ph.D, Institute of Economics and Control Systems, Faculty of Mining and Geology , VŠB – Technical University of Ostrava, 17. listopadu 15, Ostrava , tel. (+420) 596 995 140 e-mail:
[email protected] Abstract
Underground coal mine environment is an environment with dynamic manifestations of methane. In this environment it is quite difficult to control various technological processes occurring therein. The technological process of collapse preventing inertisation is carried out by supply of compressed nitrogen to areas at risk of spontaneous combustion of coal. Petri nets allow the modelling of parallel dynamic systems and systems with discrete time. In conjunction with the software HPSim or WinPeSim, the individual processes can be modelled and then the results processed using a spreadsheet (Excel). Based on the results of the performed simulations, it is then much easier to determine the optimal solution or decision. Abstrakt Prostředí uhelného hlubinného dolu je prostředí s dynamickými projevy výskytu metanu. Takovéto prostředí je poměrně složité pro řízení jednotlivých technologických procesů, které se v něm vyskytují. Technologický proces preventivní inertizace závalu se provádí přívodem stlačeného dusíku do oblastí s rizikem vzniku samovznícení uhlí. Petriho sítě umožňují modelování paralelních dynamických systémů a systémů s diskrétním časem. Ve spojení se softwarem HPSim, popř. WinPeSim lze jednotlivé procesy modelovat a následně výsledky zpracovat pomocí tabulkového procesoru. Na základě výsledků provedených simulací lze pak mnohem snáze určit optimální řešení či rozhodnutí. Key words: Inertisation, Petri Nets, Underground Mine, Modelling
1
INTRODUCTION
Inertisation of a gob (goaf) area in a longwall coal mine with nitrogen gas is an effective measure against spontaneous heating of coal. With regards to spontaneous heating indicators (CO concentration and coal temperature) the use of nitrogen inertisation can be applied in three different cases: - preventive inertisation, - inertisation to suppress spontaneous combustion, - inertisation to extinguish fire. The preventive inertisation aims at reaching safe levels of oxygen concentrations alongside the gob (goaf) area. In terms of the Ostrava-Karvina Coalfield, this means an O2 concentration of 10%. In case of inertisation used to suppress spontaneous combustion, when the temperature of the coal is higher than the temperature of the surrounding rock, injection of nitrogen is used to reduce oxygen concentrations alongside the gob (goaf) area below 10% (i.e. 3 - 5 % O2).
GeoScience Engineering http://gse.vsb.cz
Volume LVIII (2012), No.3 p. 31-38, ISSN 1802-5420
32 It is good to use the CFD modelling of spontaneous combustion zones for a longwall face using Y type ventilation. Modelling results show that the most likely areas (7~18% oxygen) for spontaneous combustion to occur spatially in the goaf are: the goaf edge on the belt road side some 200 m behind the face and 60 m into the goaf; within 50 m behind the chocks, and the unconsolidated areas about 60 m inside the retaining wall along the bleeder (return) road up to the start-up line. Air leakage is most excessive in the unconsolidated goaf boundary inside the retaining wall along the bleeder road. Both goaf gas monitoring and proactive inertisation are recommended to minimise the occurrence of spontaneous goaf heating. Optimum goaf inertisation can be achieved by pumping inert gas (nitrogen at a rate of 0.25 m3.s-1) at least 100 m behind the face on the belt road side, or ideally, if surface access permitting, via surface goaf hole(s). [10], [11] For the purpose of preventive inertisation, Nitrogen Generator Units (hereinafter referred to as NGUs) are located on the surface, which provide nitrogen flow rate of 8,500 m3h-1. If need be, for short periods of time, the NGUs can increase the flow rate up to 18,000 m3h-1 in order to extinguish mine fires. Measuring the flow rate of nitrogen gas at various points of the underground piping system is a standard part of the system used to adjust and optimize the inertisation process in a particular longwall panel in a coal mine. [1], [2] The coal mine in question presently does not have any control system that would allow to control the flow rate of nitrogen based on an assessment of the current situation. However, the MTA Ostrava company intends to develop an autonomous control system that will be able to evaluate the situation and control the inertisation process based on current flow rate measurements in different parts of the mine and other metrics. In order to explore all possibilities of controlling this technological process (hereafter TP), appropriate models of the situation need to be used. The aim of this paper is to present an initial study on the possibilities of using Petri nets to model the process of gob (goaf) inertisation in longwall coal mines. The HPSim v1.1 modelling software is used for modelling the situation; the data is then imported into the Microsoft Excel spreadsheet application and evaluated.
Fig. 1 Scheme of a longwall panel fitted with the CO and CH4 concentration sensors.
2
MODEL
The overall model for the technological process of gob (goaf) inertisation will ultimately consist of several sub-models linked together. It will be a model for the NGU (nitrogen generator unit), which supplies gas to the piping network and is capable to temporarily increase the nitrogen production multiple times. For the purpose of the initial study, a stable source of nitrogen shall be considered, which will be delivered to the network and then used up in full volume in individual longwall panel operations. The network output, i.e. the throttle valve located in the gob (goaf) area, comprises a sub-model in itself. It is also necessary to model the CO sensors, which function as primary indicators of fire. The model has to incorporate elements that will generate problem situations, i.e. elements that will change the levels of CO and will simulate the occurrence of spontaneous heating.
GeoScience Engineering http://gse.vsb.cz
Volume LVIII (2012), No.3 p. 31-38, ISSN 1802-5420
33 END POINT A sub-model, called End Point, is one of the fundamental elements of the whole model. This End Point is situated in the longwall panel operation in the immediate vicinity of the gob (goaf) area. A throttle valve controls the flow of nitrogen supplied to the gob (goaf) area. This sub-model is shown in Fig. 2. The throttle valve is represented by two Petri net elements (in the upper left part), called Transitions. In order to simplify the model only two valve states are considered – valve fully open and valve throttled to 50 %. These transitions, together with evaluated edges, are responsible for transporting a given amount of nitrogen from a NGU to an element labeled End Point P1. Test (read) edges and inhibitor edges represent the conditions for collecting a certain amount of nitrogen from the NGU. The element located in the center of the image represents opening the valve to 100 % or 50 % and the subsequent delay of the inertisation effect in terms of the CO concentration measured by the sensor located in the tailgate. The valve throttling conditions are also represented by test and inhibitor edges leading from the models of the CO concentration sensors. This part of the End Point sub-model is very complex. It is necessary to consider and model all conditions that affect the opening of the throttle valve in response to the measured CO concentration.
Fig. 2: Sub-model representing the End Point with the throttle valve
Fig. 3 Sub-model representing the CO sensors and passage of the diesel engine GeoScience Engineering http://gse.vsb.cz
Volume LVIII (2012), No.3 p. 31-38, ISSN 1802-5420
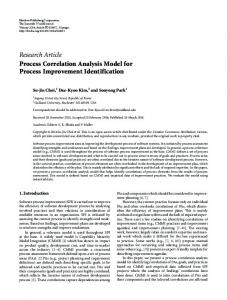
34 CARBON MONOXIDE SENSORS Another fundamental element of the model is a CO sensors sub-model, which can be seen in Fig. 3. Every longwall panel operation has two CO concentration sensors (in Fig. 1, they are labeled as 199 and 205). One sensor is located in the maingate, the other one in the tailgate. For the model, it is important that the first sensor is linked to the simulated passage of the diesel engine (right part of Fig. 3). Thus the control model will be able to evaluate the effect of the passing engine on the increasing concentration of CO measured by the second sensor. The simulated passage of the engine is represented by the area delimited by the dashed line.
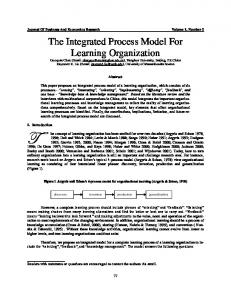
Fig. 4 Sub-model for a random increase in the concentration of CO RANDOM SIMULATION OF SPONTANEOUS HEATING Fig. 4 illustrates how the model incorporates the occurrence of “risk”. It is the part of the model that invokes a CO concentration increase only at the sensor located in the tailgate which simulates the occurrence of spontaneous heating. Increasing the concentration of CO is simulated at two levels. The element at the top of the model represents the starting point with one initiation token. This will enable to generate different levels of risk in terms of various levels of CO concentrations to different points of delivery (i.e. individual longwall panel operations). However, it is necessary to set the transitions to generate random time delays within certain limits (i.e. Time Mode: Uniform Distribution). After creating individual elements of an End Point, the overall model was created based on a model situation. This model works with defined elementary conditions. The model (Appendix No.1 - Figure 7) thus consists of two End Points. At these end points, a random passage of a diesel engine through the maingate and random emergence of risk, i.e. increased CO concentration levels at the sensor located in the tailgate, are being simulated. The modelled control system is capable to respond to increased concentrations of CO in one particular longwall panel by throttling the valve in another panel where no risk is being indicated. While maintaining a constant volumetric flow rate entering the network, the flow rate in the area at risk increases. If the CO concentration at the sensor drops below a certain level, the modelled control system will set the volumetric flow rate of nitrogen in both panels to the original settings. The HPSim software allows exporting the data to a CSV file. The modelling results stored in the CSV file were imported into Microsoft Excel, graphically visualized and evaluated. Fig. 5 shows the data obtained from the software HPSim after a time simulation. The software HPSim allows to use the output data in a form of integer values only. Within the design of the models, it was therefore necessary to count with the option to convert the decimal numbers. It is visible especially in the concentration of the CO sensors. The real output values of these sensors are in a form of decimal numbers. In the model, this is implemented by integer values of concentration, which are ultimately converted to decimal numbers. In this figure, you can see this in the field for the CO sensor maintage – Mod. It is a modified field, where the initial value is obtained from the model (CO sensor maintage) and then it is divided by 100. It is possible to compare the result of the model with measured values of concentration after the correct setting. The first graph in Fig. 5 shows the graphical representation of the CO concentration measured by sensors for the point P1. The figure shows that the concentration of CO increased in the first phase at the input of the mine working (labelled as P1) as well as at the output. This corresponds to a passing locomotive. In the second simulated phase, the concentration increased only at the output of mine, suggesting a formation of heating. GeoScience Engineering http://gse.vsb.cz
Volume LVIII (2012), No.3 p. 31-38, ISSN 1802-5420
35
Fig. 5 Output simulation of the HPSim software After the verification of the results, further efforts were made to create individual files for sub-models, which would enable a simple modular application for future use in other modelled situations. WinPeSim was used as a complementary software tool that enables to create, save and insert other sub-models into the overall model. Fig. 6 shows such a sub-model, which includes another sub-model labeled as Sensor I/O P1.
Fig. 6 End Point sub-model
GeoScience Engineering http://gse.vsb.cz
Volume LVIII (2012), No.3 p. 31-38, ISSN 1802-5420
36
3 CONCLUSIONS By modelling the technological process in the HPSim software and by subsequent simulations, it was verified that this application is viable, but the created models are not simple and modular. The WinPeSim software was tested as a tool that enables to create, save and re-use sub-models. But it was just a not fully functional Beta Preview version of the software and errors occurred due to interconnected inputs and outputs. Therefore, we concluded that Petri nets do not comprise an optimal solution for the needs defined by the MTA Ostrava Company. REFERENCES
[1]
Adamus A., Hanák Z. & Molnári, P. Listovka ZÁCHRANÁŘ, Czech Republic, vol. 3, pp 6-9, 2003.
[2]
Adamus A. Měření objemového průtoku plynného dusíku v potrubí, Uhlí-Rudy Geologický průzkum, Czech Republic, vol. 10, pp 14-20, 2002.
[3]
Škorpík J. Škrcení plynů a par, Transformační technologie [online]. 2006[cit. 2012-04-13]. ISSN 18048293. Dostupné z: http://www.transformacni-technologie.cz/skrceni-plynu-a-par.html
[4]
Vančura V. Analýza informačních obsahů signálů automaticky snímaných veličin na plynujícím dole. Ostrava, 2005. Disertační práce. VŠB - TU Ostrava. Vedoucí práce BURÝ A.
[5]
Strakoš V. & Vančura V. Intelligent model of safety management on gassy mines, 20th World Mining Congress & Eexpo2005, Tehran. Iran, November 7, 2005.
[6]
Vančura V. & Otte L. Model of Safety Control Included into Monitoring Systém. International Carpathian Control Conference ICCC`2006, Rožnov pod Radhoštěm, Czech Republic, May 29-31, 2006, p. 589-591, ISBN 80-248-1066-2.
[7]
Vančura V., Otte L. & Kodym, O. News Working Information on Gassy Mines. Mine Planning and Equipment Selection – MPES 2006, September 20-22, 2006, Torino, Italy, p. 208-21, ISBN 88-901342-40.
[8]
Wesley, C R , Wynne, T M, Urosek,, J E and Diederich, K S, 2006. The successful recovery of the Dotiki Mine after a major mine fire. Proceedings, Eleventh US Mine Ventilation Symposium, State College, Pennsylvania, Balkema, The Netherlands, 337-343, June2006.
[9]
Otte L. Využití Petriho sítí pro tvorbu simulačních modelů horizontální dopravy na uhelných hlubinných dolech. Ostrava, 2009. Disertační práce. VŠB - TU Ostrava. Vedoucí práce BURÝ A.
[10]
Ren, T & Balusu, R, 2009. Proactive goaf inertisation for controlling longwall goaf heatings, Procedia Earth and Planetary Science Volume 1, Issue 1, September 2009, pp 309-315.
[11]
Ren, T., Wang, Z., Nemcik, J., Aziz, N. & Wu, J. Investigation of spontaneous heating zones and proactive inertisation of longwall goaf in Fenguangshan Mine, 12th Coal Operators' Conference, University of Wollongong & the Australasian Institute of Mining and Metallurgy, 2012, 212-220.
GeoScience Engineering http://gse.vsb.cz
Volume LVIII (2012), No.3 p. 31-38, ISSN 1802-5420
37 RESUMÉ K tomu, aby případný model mohl fungovat správně, je zapotřebí prostudovat základní teoretická východiska a analyzovat danou situaci. Je tedy nutné zjistit informace o centrálním dusíkovém hospodářství, potrubní síti, kterou je dusík rozváděn do důlních prostor a podmínkách řízení TP v současné době. Potrubní síť není v tomto případě přímočará a je tvořena odbočkami různých tvarů, oblouky zúžením, filtry, měřidly apod. V těchto částech potrubní sítě vzniká tlaková ztráta, která je mnohem intenzivnější než na rovném úseku potrubí. Z pohledu tlakové ztráty se tyto prvky nazývají místní odpory. Za speciální případ místního odporu, lze považovat i výstupy dané sítě, v tomto případě škrtící ventily. Škrcením ventilu se sníží průtok a zvýší se tlaková ztráta, respektive sníží se tlak za ventilem, což je způsobeno nehomogenním prouděním v oblasti nejužšího průřezu a vířením. V naší problematice vycházíme z naměřených hodnot oxidu uhelnatého. Oxid uhelnatý vzniká při hoření za vyšších teplot při nedostatku kyslíku, redukcí oxidu uhličitého v žáru, rozkladem vody na žhavém uhlí a také redukcí oxidu uhličitého vodíkem. Nejčastějším zdrojem výskytu oxidu uhelnatého jsou trhací práce a z havarijních případů je to vznik požáru nebo zápar. Požadavkem společnosti MTA Ostrava, s.r.o. je najít vhodný nástroj k modelování technologického procesu inertizace závalu stěnového porubu uhelného hlubinného dolu. Za určitých okolností lze technologický proces inertizace považovat za systém, který je ovlivněn stochastickými, tedy náhodnými procesy. Petriho sítě jsou moderní prostředek pro modelování stochastických systémů a cílem bylo prověřit možnosti použití Pteriho sítí pro účely modelování již zmíněného technologického procesu. Modelováním technologického procesu v softwaru HPSim a následnými simulacemi bylo ověřeno, že tento prostředek lze použít, ale vytvořené modely nejsou jednoduché a modulární. Následně byla ověřena i možnost použití softwaru WinPeSim, který udává právě možnost tvorby, ukládání a znovupoužití dílčích modelů. Jde však o tzv. WinPeSim Beta Preview verzi, která není zcela funkční a dochází k chybám vlivem uložení propojených vstupů a výstupů. Proto jsme dospěli k závěru, že Petriho sítě nejsou pro definované potřeby společnosti MTA Ostrava, s.r.o. příliš vhodné a doporučujeme využít dalších možností.
GeoScience Engineering http://gse.vsb.cz
Volume LVIII (2012), No.3 p. 31-38, ISSN 1802-5420
38 Appendix No. 1
Fig. 7 Total model
GeoScience Engineering http://gse.vsb.cz
Volume LVIII (2012), No.3 p. 31-38, ISSN 1802-5420