Creating Ontology Chart Using Economy Domain Ontologies Waralak V. Siricharoen, Thitima Puttitanun
Creating Ontology Chart Using Economy Domain Ontologies Waralak V. Siricharoen*1, Thitima Puttitanun*2 *1, Corresponding author School of Science, University of the Thai Chamber of Commerce, 126/1, Dindeang, Bangkok, Thailand, 10400 *2 Department of Economics, San Diego State University, San Diego, California, USA
[email protected],
[email protected] doi: 10.4156/jdcta.vol3.issue3.8 Abstract
2. What is Ontology and Ontology Chart?
Ontologies are parts of an Artificial Intelligent advance research area where it is a very familiar topic in computer science. There are many domains of interests that can utilize ontolologies to use them as the knowledge repository. Economy is one of the widely interesting topics that anyone can relate to. This research simplifies ontologies concepts using economy domain to guide people in the field of economics to understand how ontology works as well as to guide the computer software developers to understand the basic concept of economy. The economy ontology is illustrated in ontology chart and hierarchical chart.
One of the significant characteristics of ontology is the hierarchical relationship between classes, as well as looping or cycling of these classes. Looping in this case means a path which ends at the node where it began. The connection between nodes within ontology can represent as a graph where the nodes might be completed or might not be completed. This paper will use some examples of economy ontology as a case study to help explaining the concept of ontologies. The author will illustrate the ontology chart showing how each class connects to each other. Some suggestions will be addressed in order to make ontology more proper.
Keywords
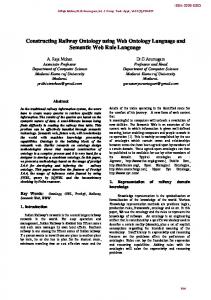
Ontology charts are a graphical representation of partially order set graph. The major characteristic of ontology chart is hierarchical. The ontology chart can be represented in a acyclic graph pattern. It typically began with drawing trees to represent hierarchies of categories. However, more general acyclic graphs are needed to represent an arbitrary partial ordering, such as the subtype-supertype relation between categories. Figure 1 is a simple acyclic graph, in which some nodes have more than one parent. Such graphs support multiple inheritances, since a node can inherit properties from any or all of its parents. A common convention is to omit the arrows that show the direction of the ordering and to assume that the lower node represents a subtype of the higher node.[2]” By the definition given in Wikipedia, “Ontology charts are a graphical representation of semi-lattice structures”[3]. “The nodes of an Ontology chart represent universal affordances and rarely represent particulars. The exception is the Root which is a particular agent often labelled ‘Society’ and located on the extreme left of an Ontology chart. The Root is often dropped in practice but is implied in every Ontology chart” [3]. They also describe the concept of ontological dependency as “a relationship known mathematically as a partial order set relation (poset).
Ontology Economy Ontology Chart.
1. Introduction Ontologies have become an increasingly important research topic. However, it is time consuming to construct ontologies from the beginning. Moreover, how ontologies are used is not easily understood by people outside the filed. In order to fully use ontology to its full capacity, we need to thoroughly understand how ontologies’ classes are interrelated and how classes’ properties are described. Unfamiliar users who are not ontologies experts/developers should also understand the concepts behind ontologies to fully use ontologies functions accurately. Therefore, the aim of this paper is to explain the concept of ontologies through a specific example that people can relate to, “economy”. The reason why we choose “economy” ontology is because everyone is a part of an economy. Therefore, explaining ontology using this particular domain should be easily understood to any general audience. In doing so, we construct an easy to understand ontology chart illustrating how ontology’s concepts (classes) are connected to each other by using parts of the “economy” domain.
74
International Journal of Digital Content Technology and its Applications Volume 3, Number 3, September 2009 Posets are an object of study in the mathematical discipline of order theory. They belong to the class of binary relations but they have three additional properties: reflexitivity, anti-symmetry and transitivity” [3].
suggests that we can also use the open source tool called Protégé to merge the existing ontologies description in XML, OWL and export them to UML 1.4 which have to installed UML backend plug in before. After that you can generate class diagram by importing UML 1.4 in form of XMI to any UML compatible software for example Visual Paradigm or Rational Rose. The outcome of transforming ontology to UML class diagram is rising and more manual, this can eliminate the time consuming process in software engineering. The ontologies can be reused easily since it might be provided online as ontology library or through a semantic search engine; for example, swoogle, ontaria, etc. However, ontology is mostly found in description or text version in XML or OWL syntax. Since ontologies can be difficult to understand by non-expert users, this paper makes use of economy concept as an example to draw out an ontology class. Another benefit of ontology is that it can be shared, reused through the development of domain knowledge. Currently, there are many ontologies editor available; however, Protégé might be the tool that is easiest to understand among other ontology editors such as OntoEdit, Ontolingua, and Chimaera. As explained by the Protégé official web site, “Protégé is an opensource tool developed at Stanford Medical Informatics. Protégé is one of the most widely used ontology editors with currently. Its extensible open-source platform supports several ontology file formats including CLIPS (Protégé’s native format), various XML dialects, databases, DAML + OIL (DARPA Agent Markup Language + Ontology Inference Layer), and RDF(S). Very recently, storage plug-ins or the Unified Modeling Language UML and OWL have been added”. Protégé is an open source ontologies editor and knowledge-base framework [6]. “Protégé can represent ontologies consisting of classes, properties (slots), property characteristics (facets and constraints), and instances. And it can be used to load, edit and save ontologies in various formats, including RDF, XML, UML, relational databases, and OWL”[7]. Currently, Protégé serves more than 150,000 community users.
Figure 1. The Simple Directed Acyclic Graph (DAG) 1
Figure 2. the Ontology chart 2 Moreover, there is a prototyping generation from ontology chart in order to create class diagram by [4] as can be seen from the figures above that “for generating prototypes were implemented in an open source software tool developed at 2006 by the Authors, called Semantic Analysis Toolkit (SAT). SAT provide a graphical interface implemented in Java Swing that allow that designer to drag and drop affordances and form an Ontology Charts. The tool then can evaluate the chart against the basic rules of semantic analysis spotting basic mistakes and produce a prototype. Extending an existing prototype is also possible. The tool can read the ’Universal’ table of an already existing system and extend its schema by adding new affordances. This will not affect the legacy system. The tool can also produce an XMI file that can be imported by MDA tools, if the users decide to use the MDA approach instead.” The approach of Sirichareon[5]
3. “Economy” Domain and its explanation One of the definitions of “Economy” in a dictionary is the management of the resources of a community or a country with a view to its productivity. We can think of an economy as a social system of production, consumption, and distribution of goods and services in an area. An economy does not have to be specific in size since we can talk about an economy of a city, a country, or the world. Given the above definition, we can see that an ontology domain that describes an
1
http://upload.wikimedia.org/wikipedia/commons/0/08/ Directed_acyclic_graph.png 2 http://en.wikipedia.org/wiki/File:Ocw.jpg
75
Creating Ontology Chart Using Economy Domain Ontologies Waralak V. Siricharoen, Thitima Puttitanun economy must include a wide range of objects that describes not only the types of the systems an economy is run on (whether it is a market economy or a controlled economy), but also economic agents that involve in the process of production, consumption, and distribution, and the goods and services that are produced, distributed, and consumed. Moreover, the domain should include a measure of economic activities. These measures can be used to describe the value (price) of a product or service where it can be in a form of different country’s currencies. Some measures are used to describe how well an economy is doing by measuring the size of production of goods and services that a country can produce in a specific year (gross domestic product, GDP) or measuring how many people are unemployed in percentage term (unemployment rate) or measuring how price of products and services change in a given year (inflation rate). In order to explain interactions between economic agents in a simple way, we can rely on an uncomplicated chart that can be found in most of the principles of economics textbook such as Figure 3. The chart explains that households (consumers) purchase goods and services from firms (producers), generating a flow of money to firms and a flow of goods and services to households. The money also flows back to households as firms purchase factors of production from the households in factor markets (households supply labor needed to produce goods and services).
chart. However, from the computer science perspectives, we need to see more details showing the economy objects and the relationships among them.
Source: Microeconomics 1st edition, Paul Krugman and Robin Wells, Worth Publisher. Figure 3. The Circular-Flow Diagram Next, we compare the Economy concept to what is available in the Economy Ontology provided online and displayed in Protégé as shown in Figure 4. As can be seen from Figure 3, only the main major objects (households, firms, goods and services, money, and factors of production) are shown in the Economy flow
76
International Journal of Digital Content Technology and its Applications Volume 3, Number 3, September 2009 Figure 4.1, 4.2 Economy ontology 3 displayed in Protégé version 3.4 Economy Ontology in Protégé 4.0, as seen in Figure 4, shows the hierarchical relationship of the economy ontology. As seen above, there are many significant classes. For example, class Agent is composed of Producers, Consumers, and Governments, which are the main characters within any economy. This Agent class has no subclass (Subclass is a lower class of child class which is can be inherited all the properties of upper class called superclass or parent class). An example of Goods and Services circulated in an economy is such as class Beverage, where Wine is a subclass in it. To represent a Market, an ontology class can list countries for that purposes. In order to purchase any goods and services in a market, we need to use Money, which has a unit listed in different currencies used in each market, such as British Pound, or US dollar, etc. In order to produce those products to distribute in the market, we need to use inputs or factor of production such as workers that is listed in the class Factor Market.
Figure 6. Object Properties (Industry Attributes) of Geopolitical Area We can interpret some parts of classes shown in Protégé to the Class hierarchy in order to make it easier to understand. However, even when it can explain the main concepts in the economy (Figure 3) almost completely, Figure 7 still shows different points of view of an economy between an economics perspective and computer science perspective. The main difference is in the concept of how to divide each item into levels. An economy in economics perspective does not necessarily have to be divided in hierarchical format since they are intertwined in many levels rather than just a one to one mapping like what shown in Figure 7. However, some relationships provided in ontology, are not a one-to-one mapping. By showing them in class hierarchical would not describe the correct information. Therefore, it is necessary to show multiple inheritances in ontology.
Figure 5. Data Properties
3
http://reliant.teknowledge.com/DAML/Economy.owl
77
Creating Ontology Chart Using Economy Domain Ontologies Waralak V. Siricharoen, Thitima Puttitanun
Figure 7. Economy Class hierarchy As mentioned above, even though the hierarchical chart can clearly define the relationship between classes, it is difficult to incorporate the multiple hierarchical link and would complicate the chart further. Therefore, in the case where some classes are contained in several super classes or have more than one subclasses, the best way to show those relationships is to use an “ontology chart” such as one depicted in Figure 9. Ontology chart can show how classes are connected through hierarchical patterns as well as graphing patterns. Subclasses in ontology can have more than one super classes, which is called multiple hierarchical inheritances (see DAG graph in Figure 1). In other words, the lower classes can be inherited all properties from more than one super classes. From Figure 9, we can see that the class Industry Attribute has three super classes, which are Rational Attribute, Object, and Geopolitical Area. Moreover, some classes can be an instance of more than one super classes. For example, British Pounds and Canadian dollar are subclasses of Currency Measure class as well as the Unit Of Measure class.
Figure 8.1, 8.2 British Pound is a subclass of Currency Measure and an Instance of class Unit Of Measure
78
International Journal of Digital Content Technology and its Applications Volume 3, Number 3, September 2009
Figure 9. Partial Economy Ontology Chart
4. What is missing from “Economy” Domain? How to edit ontology using Protégé?
There are many ontology editors, for example, Protégé, OntoEdit, KAON, Swoop, Semantic Turkey that allow developers to edit ontologies. Focusing on the Protégé, currently, there are two versions available to download, and it is an open source developed using java. There are more than 150,000 registered users that help develop ontologies and solve problems that may occur in Protégé. In the case that we find a more detailed ontology in a related topic to Economy, such as Economy-Government ontology, we can merge the two existing ontologies together using Protégé conveniently as shown in Figure 10.
The economy ontology gives some basic ideas of how classes are related to each other in ontologies. On an important concept, such as an “Economy,” there generally are more than one ontologies created on the basic of economy. Since different groups of developers create their own economy ontology, many times they are different. Furthermore, there are always some missing concepts or relationships or even classes in different ontologies. For example, in one ontology, Exporting is an object property of two classes: Financial Transaction and Change of Possession where Change of Possession can be associated with other classes such as Importing and not restricted to only Exporting. Therefore, one might want to be able to adjust, edit, or combine ontologies, to make it more complete.
5. Conclusion Since the ontology concept are not easily understood by people outside the filed, this paper explain how ontologies’ classes are interrelated and how classes’ properties are described using a specific example “economy”. We construct easy to understand charts, both hierarchy chart and ontology
79
Creating Ontology Chart Using Economy Domain Ontologies Waralak V. Siricharoen, Thitima Puttitanun chart to illustrate how ontology’s concepts (classes) are connected to each other by using parts of the “economy” domain. However, each ontology might have missing super classes, classes, and subclasses that we can borrow from another ontology concept. Therefore, the ability to edit and merge existing ontologies are very important and crucial to develop a complete ontology without redesigning it from the beginning.
This part that come from EconomyGovernment Ontology
This part that come from Economy Ontology
Figure 11. Merge result of Economy –Government Ontology and Economy Ontologies
6. References [1] http://en.wikipedia.org/wiki/Directed_acyclic_graph [2] John F. Sowa, 01/18/2009 Building, Sharing, and Merging Ontologies http://www.jfsowa.com/ontology/ontoshar.htm 19 March 2009 [3] http://en.wikipedia.org/wiki/Ontology_chart [4] Poernomo, I., and Tsaramirsis, G., “Prototype Generation from Ontology Charts” the Fifth International Conference on Information Technology: New Generations, March 17, 2009 [5] Siricharoen W. V., “Merging Ontologies for Object Oriented Software Engineering”, Proceedings of the 2008 Fourth International Conference on Networked Computing and Advanced Information Management Volume 02 NCM2008, pp 525-530. [6] http://protege.stanford.edu/download/ontologies.html [7] Fergerson, R.W., Noy, N. F., and Musen M. A., “The Protégé OWL Plugin: An Open Development Environment for Semantic Web Applications”, October 19, 2004 Volume 3298/2004, pp 229-243.
Figure 10. Economy –Government Ontology 4
4
http://reliant.teknowledge.com/DAML/Mid-levelontology.owl
80