Creating shared situation awareness in a multi-platform sensor network Miranda van Iersel, Leon Kester, Jeroen Bergmans, Peter Hiemstra, Koen Benoist, and Bas van den Broek TNO Defense, Security & Safety Oude Waalsdorperweg 63, 2597 AK The Hague the Netherlands Email:
[email protected]
Abstract— Networked systems that gather sensor data in order to react to phenomena in their surroundings are faced with a growing need for adaptive behavior to operate in dynamically changing environments. In designing a networked system the data processing chain can be decomposed into functional components. These functional components interact by requesting information they need and fulfilling requests received from other components. The available data should be evaluated with respect to the requests and available resources. This way a shared and consistent situation awareness can be created. We will give an example of a networked system in a naval scenario.
effectors acting on the environment fulfills the role of the classic Observe-Orient-Decide-Act (OODA) cycle [2] in the NAIHS model (see Fig. 1). Evaluation of the available data observe
Environment
System
Keywords: Tracking, data evaluation, situation awareness, multi-platform sensor network act
I. I NTRODUCTION One of the problems created by the movement of maritime operations from the high seas to the coastal waters, is the increase in the complexity of the image formation and the situation awareness. Nowadays the image formation is platform centric, i.e., using active and passive sensors a common picture is built up separately on each platform and only when it is more or less complete it will be exchanged through classical data links (e.g. Link 11 & 16) in the form of tracks. Considerable improvement of the quality of the common picture can be achieved through a (multi-platform) networkcentric approach. In such an approach the data from the sensors on different platforms can be exchanged (e.g., like plots) and combined in an early stage. Advantages of this approach are, amongst others, an increased chance of detection, a higher accuracy and a better track continuity. In general, a system interacts with its environment by observing phenomena in the environment and acting on these observations to reach its goals. When this environment is dynamically changing it becomes more difficult to design such a system, in particular a decentralized networked system that is appropriate for multi-platform situation awareness. We have chosen to design the sensor network following the Networked Adaptive Interactive Hybrid Systems (NAIHS) model [1]. Using this model the architecture is decomposed into several functional components. These functional components interact by posing requests for information they need and fulfilling requests they receive from other components. This chain of interacting components from data collectors to
Fig. 1. A system interacts with its environment by observing phenomena and acting on the environment to achieve its goals.
with respect to the different requests and available resources is a key process in each component. This allows for a robust and flexible system where the number of interfaces needed by each function to perform its task is limited. In section II the functional network and platform architecture are described briefly. The method used to evaluate the data is discussed in section III. The outline of our software demonstrator is given in section IV together with the scenario’s and outcome of our tests. Finally, some conclusions will be given. II. F UNCTIONAL ARCHITECTURE A networked system can be decomposed in functional components that interact by requesting information and providing requested information amongst each other. The Observe-Orient-Decide-Act (OODA) cycle [2] and the Joint Directors of Laboratories (JDL) model [3] are two models that make a decomposition of the system. Just like these models, the Networked Adaptive Interactive Hybrid Systems [1] (NAIHS) model decomposes the system into several functional components ranging from collector to effector. The NAIHS model uses a decomposition into eight functional components (see also Fig. 2):
448
1) Signal processing - generate a feature space from raw sensor data (sense).
2) Filtering in feature space - select phenomena from the feature space likely to originate from objects of interest (detect). 3) Filtering in time - associate detected phenomena in time and estimate state (track). 4) Recognition - Classify and identify phenomena and/or objects (recognize). 5) Situation assessment - determine relationships between entities (ass.sit.). 6) Relevance assessment - threat evaluation and/or risk assessment (ass.rel.). 7) Action assessment - decide on the actions to take (ass.act.). 8) Execution - execute action (act).
Fig. 3. The three decomposition directions of the system in interacting modules or components according to the NAIHS model: (1) Horizontal: separation of the processing cycle into functional components, (2) Vertical: processing cycle on separate platforms, (3) Back-to-front: cycles achieving goals on separate reaction timescales.
Fig. 2. Functional decomposition and the interaction between components according to the NAIHS model.
A crucial characteristic is that along the functional chain the amount of data decreases while the amount of contextspecific knowledge and modeling necessary to process the data increases, i.e. the level of data representation increases and the quality of the information increases from a decision making perspective. This ordering holds up to and including the decision phase of the cycle, and reverses towards the act phase. The decomposition into different functional components is only one dimension in which the NAIHS model makes a decomposition. According to the NAIHS model it is possible to decompose a networked system along three distinct ”dimensions”, as illustrated in Fig. 3: 1) decomposition into different information processing functions, 2) decomposition over physically separated platforms, 3) decomposition in timescales on which the system has to interact with the environment. In a system in which different physical locations or platforms are present, it is possible to make a decomposition into functional components at each platform separately. In principle a functional component is distributed over different platforms and these functions have to communicate data and/or information requests in order to cooperate. The system layout and communication topology over physically separated platforms is the second dimension of the system decomposition.
The third direction in which the NAIHS model separates the system is a separation into different timescales on which the tasks of the system have to be performed. Behavioral requirements of the system can vary from very short (reactive, subsecond) to very long (planning, strategic decisions) times between collecting the data and taking action. These timescales are imposed by the timescale of the relevant phenomena in the environment. Given the application and goals of the system different process cycles can be identified for tasks at different reaction or cycle timescales. This way, complex situation awareness and/or decision-making processes are separated from fast reactive behavior of the system. For each reaction time appropriate choices for the functional cycle have to be made given local processing power, band width and latency in the network. III. DATA EVALUATION Crucial for the operation of a system architecture as described above, is the ability of components to evaluate the utility of data given the actual requests, the internal state of the component, and the resources available for processing, storage and communication. Using the results of the evaluation, the component can decide how and when to deliver the data to consumers, request more data from its providers, and exchange data with its siblings on other platforms. A simple illustration of data evaluation in a decomposed system is given by considering two physically separated cooperating platforms providing a target tracking function to the network (see Fig. 4). Both platforms have a local source of data in the form of ’detect’ modules from which the
449
Sense
Detect
Track
Request Common Picture
Platform 1
Sense
Detect
Track
Request Common Picture
Platform 2
Fig. 4. Schematic layout for the example system of tracker components cooperating to deliver a common picture of the targets detected by the sensors on the platforms.
target detections can be requested. The algorithm used in the modules is able to fuse and filter contacts into tracks (estimates of target position and velocity using nearest neighbor association). Target detections are delivered as contacts describing range and bearing relative to the sensor positions. The tracking module is able to fuse and filter contacts into tracks. A more thorough explanation of this algorithm can be found in [4] and references therein. Both tracking components get the same request: ”Deliver a situational picture consisting of tracks for targets in the environment of the platforms. This common picture should be equal and synchronized for all platforms involved.” Possibly additional conditions could be imposed on the type and qualities of the data: region-of-interest, track accuracy, etc. To provide the requested data, each tracking module requests contacts from the detection modules available on its platform, and requests all sibling modules on other platforms to cooperate in fulfilling the request for a common picture. To be able to keep this common picture synchronized, the tracking modules update the picture at regular points in time with all data considered relevant.
Fig. 5. Schematic layout of a fusion/tracking functional component performing evaluation of sensor data in order to cooperate with sibling components on other platforms.
sensor data, but only those contacts that contribute to tracks are communicated between platforms. In a more adaptive system, evaluation criteria should be dynamically matched to the available bandwidth and requested common picture quality. IV. E XAMPLE To perform simulations of a networked system, we built a software demonstrator. First we will give a short description of this demonstrator. After that we will explain the example scenario we have chosen and give some results. A. Architecture of our demonstrator The schematic layout of the software demonstrator is given in Fig. 6. The Run Time Infrastructure (RTI) performs the
JROADS RCI
For all locally provided contacts which arrive at the tracking module an evaluation is performed to decide whether the contact contributes to the utility of the common picture or not (see Fig. 5). In our evaluation we use either one or both of the following criteria: (1) whether the contact can be associated to an existing track in the common picture, and (2) whether a contact is found in a region of interest. In the case that the criteria are matched, the contact is sent to all other tracking modules and subsequently incorporated in the common picture at the next update time. When the contact cannot be associated, it is stored by the evaluator and an attempt is made to form a new track from the locally stored data. When such a new track can be formed, the constituent contacts are also distributed to be incorporated into the common picture. This way, a complete set of tracks is formed from the combination of local
Sensor Federate
Evaluation Federate
RCI
RCI
RTI Fig. 6.
Schematic layout of the software demonstrator.
communication and synchronization between the different modules or federates. The RTI we use (TNO-RTI [5]) is developped by TNO and is a high performance RTI implementation that supports HLA and IEEE 1516 standard. Each federate communicates with the RTI through a Run Time Communication Infrastructure (RCI). There are several different federates coupled in this way. The Joint Research On
450
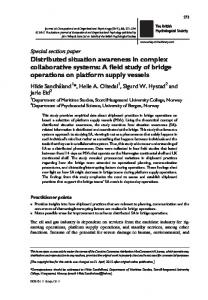
Air Defence Simulation (JROADS) 1 federate performs a dual task; both visualization and scenario generation are performed by this federate. The evaluation federate takes care of the evaluation and fusion of the contacts and the distribution to other platforms. The sensor federate maintains the collection of contact generators and sensors in the simulation. A sensor is a physical subsystem located on a platform and for now can only be a radar or a camera. The contact generator is a functional entity which obtains information from one or more sensors and is able to generate contacts. B. Scenario The scenario we chose to study consists of three friendly ships, each containing a radar on board. An enemy fighter is flying in the area where the ships are located. This scenario was placed at open sea to study the effects of track accuracy. To study the effects of the Line-of-Sight we moved the scenario to the Isle of Skye (Scotland) and changed the path of the fighter. A screen shot of this scenario is given in Fig. 7.
1) no contacts are exchanged between platforms, no evaluation is performed, only tracking, 2) all contacts are exchanged between platforms, no evaluation is performed, only tracking, 3) contacts are exchanged between platforms, evaluation is performed by using association. 1) Track accuracy: For the scenario at open sea we analyzed the results from all three different modes. An overview of the tracks of the platforms in the scenario at open sea is given in Fig. 8, which is generated with the so-called Performance Evaluation Tool (PET). 2 The tracks in this figure
Fig. 8. Overview of the tracks of the platforms at open sea generated by the PET-tool.
Fig. 7. Screen shot as given by JROADS of the scenario of three ships and a fighter around the Isle of Skye.
C. Results Both scenarios described above are run in three different modes: 1 JROADS is a modular simulation environment for concept development and experimentation in the field of joint theatre air and missile defence. Simulated air defence systems or architectures are used in scenarios for analysis purposes or can be controlled by an operator during exercises. JROADS is developed at TNO Defense, Security and Safety.
are all generated with the method of evaluation by association. The ground truth is given in red, the tracks as seen by the radar on ship 1 are given in blue, the tracks as seen by the radar on ship 2 in black and those seen by the radar on ship 3 in yellow. In Fig. 9 the distance between the fighter and ship 1 as detected by the radar on ship 1 is given in the left plot (a). In this plot the tracks and plots lie too close together to be distinguished. In plot on the right-hand side (b) the position error on this distance is plotted. One clearly sees a resulting small error when the distance between the fighter and ship is small. A larger distance results in a larger error. However, the errors are still quite small. At 2 Performance Evaluation Tool (PET) is an interactive track reconstruction tool providing a graphical vector based representation of the tracked tactical elements and can compute and generate unit and force level Measure of Effectiveness (MOEs) and Measure of Performance (MOPs) for these sources. PET analyzes the reconstructed data and provides annotated graphical representations of the Single Integrated Air Picture (SIAP) [6] attributes. PET was designed by the Data Analysis Function within the Naval Sea Systems Command (NAVSEA), 62 Directorate in the USA.
451
EvaluatorMethod ASSOC 3 ships, 1 fighter (target), 3 M6T Trackers 29!Feb!2008
EvaluatorMethod ALL 3 ships, 1 fighter (target), 3 M6T Trackers 29!Feb!2008
1400 all ship1 ship2 ship3
1400 all ship1 ship2 ship3
1200
1200
1000
# contacts
# contacts
1000 800 600
800
600
400
400
200
200
0
0
0
50
100
150 time(s)
200
250
300
0
(a) (a)
(b)
Fig. 9. (a) Distance between the fighter and ship 1 in time as seen by the radar on ship 1. (b) Position error on the distance between the fighter and ship 1.
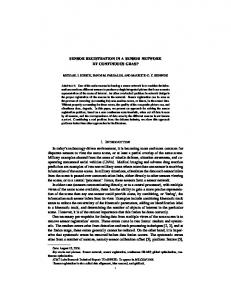
a distance of 5000 m, the error in the tracks is 100 m, which is quite accurate. 2) Line-of-Sight: The scenario around the Isle of Skye clearly shows problems one can come across when the Lineof-Sight is important. Looking at Fig. 7 it becomes clear that due to the Line-of-Sight ship 3 can only detect the fighter at the very last moment. When the contacts are exchanged between the ships a better situation awareness can be generated in ship 3 and it will be able to see the fighter earlier. In Fig. 10 the tracks are shown of the ground truth (a), the tracks of the fighter as seen by the radar on ship 1 (b), as seen by the radar on ship 2 (c), and as seen by the radar on ship 3 (d). In these last three plots the ground truth is given in red, the tracks found by using the settings of tracking and no exchange of contacts is given in blue, the tracks found by using the settings of tracking and exchange of all contacts is given in black, and the track found using the evaluation by association method is given in yellow. It is clear from these figures that ship 2 and 3 only see the fighter when it has almost completely passed over the island in the case of only tracking and no exchange of contacts is used. When we use tracking and exchange of contacts, the fighter is detected better on these ships. The best results are found using the evaluation by association method. In Fig. 11 the number of contacts sent by each ship and the total number of contacts are plotted for the method of exchanging all contacts (a) and using association (b). One clearly sees from these figures that the number of contacts that are sent, decreases when using the method of evaluation by association. From this, one can conclude that it is not necessary to exchange all contacts to create a common picture. Evaluating the contacts and only sending those contacts that can be associated to a track, creates a good common picture. V. C ONCLUSIONS The Networked Adaptive Interactive Hybrid Systems model provides a good way to decompose a networked system into several functional components. Besides this decomposition
50
100
150 time(s)
200
250
300
(b)
Fig. 11. Number of contacts sent by each ship and the total number of contacts for exchange of all contacts (a) or only those contacts that are associated to a existing track (b).
into functional components the NAIHS model also provides a way to decompose a networked system over physically separated platforms and to decompose the system into different timescales. We have chosen to design a sensor network using the NAIHS model. This sensor network was simulated using a software demonstrator. As an example we have taken a naval scenario in which three friendly ships detect an enemy fighter. This scenario was tested using three different methods; (1) no contacts are exchanged and only tracking is performed, (2) all contacts are exchanged and only tracking is performed, (3) contacts are evaluated by association and only those contacts which can be associated to a track are exchanged. We have shown that one gets the best track accuracy when using the method of evaluation by association. In a scenario with Line-of-Sight problems we have shown that a shared and consistent situation awareness can be generated. Using only tracking and exchanging all contacts generates a good common picture as well as using the method of evaluation by association. However, it was shown that the evaluation method needs to exchange a smaller amount of contacts in comparison exchanging all contacts. This means that it is possible to create a shared and consistent situation awareness when limited band width is available. R EFERENCES [1] L.J.H.M. Kester, “Model for Networked Adaptive Interactive Hybrid Systems,” in Proceedings of COGIS 2006, COGnitive systems with Interactive Sensors, Paris, France, March 15-17 2006. [2] J. Boyd, “A discourse on Winning and Losing,” Maxwell AFB Lecture, 1987 . [3] F. White, ”A Model for Data Fusion, ” in Proceedings of the 1st International Symposium on Sensor Fusion, 1988. [4] A. Theil et al, ”Picture Compilation in Multi-Platform Sensor Networks”, presented at the NATO SCI-180 symposium on ”Force Protection in the Littorals”, 25 - 27 September 2006, Ottawa, Canada. [5] R. Jansen, W. Huiskamp, J.-J. Boomgaardt, and M. Brasse´e, ”Real-time Scheduling of HLA Simulator Components”, Simulation Interoperability Workshop, Spring 2004. [6] Single Integrated Air Picture (SIAP) Attributes, Version 2.0, SIAP System Engineering Task Force, USA, August 2003.
452
(a)
(b)
(c)
(d)
Fig. 10. Ground truth (a), tracks of the fighter as seen by the radar on ship 1 (b), ship 2 (c), and ship 3 (d). In red the ground truth. In blue the track as found by using tracking and no exchange of contacts. In black the tracks as found by using tracking and exchange of all contacts. And in yellow the tracks as found by using evaluation by association.
453