create editable illustrations simply and without the aid of a professional designer. ... your SmartArt graphic, visualiz
[Not for Circulation]
Creating Workflow, Relationships, and Sequential Processes Diagrams with Ease in PowerPoint 2007 This document provides instructions for working with SmartArt in Microsoft PowerPoint 2007. SmartArt, a visual representation of a message, is new to Office 2007. SmartArt allows you to create editable illustrations simply and without the aid of a professional designer. You can easily create dynamic workflow, relationship, or hierarchy diagrams.
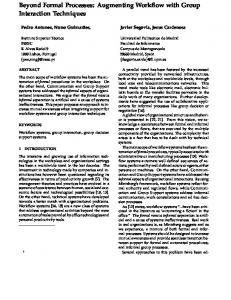
Before You Get Started Microsoft Help provides the following tips to consider when you begin using SmartArt. Before you create your SmartArt graphic, visualize what type and layout are best for displaying your data. Ask yourself: 1. What do you want to convey with your SmartArt graphic? 2. Do you want a certain look? Layouts can be quickly and easily switched, so try a variety of layouts until you find the one that best illustrates your message. Your graphic should be clear and easy to follow. Microsoft provided the table below to use as a starting point. The table is intended to help you get started and is not an exhaustive list. Purpose of graphic
Graphic type
Show non-sequential information
List
Show steps in a process or timeline
Process
Show a continual process
Cycle
Show a decision tree
Hierarchy
Create an organization chart
Hierarchy
Illustrate connections
Relationship
Show how parts relate to a whole
Matrix
Show proportional relationships with the largest component on the top or bottom
Pyramid
Information Technology Services, UIS
1
[Not for Circulation]
Also, remember to consider the amount of text that you have, as the amount of text often determines the layout and how many shapes are needed in the layout. In general, SmartArt graphics are most effective when the number of shapes and the amount of text are limited to key points. Larger amounts of text can distract from the visual appeal of your SmartArt graphic and make it harder to convey your message visually. However, some layouts, such as Trapezoid List in the List type, work well with larger amounts of text. Some layouts for SmartArt graphics contain a fixed number of shapes. For example, the Counterbalance Arrows layout in the Relationship type is designed to show two opposing ideas or concepts. Only two shapes can contain text, and the layout cannot be changed to display more ideas or concepts.
Keep in mind that changing layouts or types can alter the meaning of your information. For example, a layout with arrows pointing to the right, such as Basic Process in the Process type, has a different meaning from a SmartArt graphic with arrows going in a circle, such as Continuous Cycle in the Cycle type.
Inserting SmartArt 1. To insert SmartArt, go to the Insert tab and click SmartArt.
2. From the gallery, select the style of SmartArt you wish to add and click OK. The styles are organized into categories, from which you can browse via the list on the left. Or you can browse through all the styles by selecting the All category on the left. You will be able to customize the SmartArt in the next steps.
Information Technology Services, UIS
2
[Not for Circulation]
3. When you select a layout, placeholder text (such as [Text]) is displayed, so that you can see how your SmartArt graphic looks. Placeholder text is not printed, nor is it displayed during a slide show. However, the shapes are always displayed and printed, unless you delete them. You can replace the placeholder text with your own content.
a. Enter your text by doing one of the following: i. Click in a shape in your SmartArt graphic, and then type your text. ii. Click [Text] in the Text pane, and then type your text. iii. Copy text from another program, click [Text], and then paste into the Text pane. b. If the Text pane is not visible, i. Click your SmartArt graphic. ii. Under SmartArt Tools, on the Design tab, in the Create Graphic group, click Text Pane.
4. The SmartArt graphic can be customized to meet your needs. a. To quickly add a designer-quality look and polish to your SmartArt graphic, apply a SmartArt Style, available on the Design tab in the SmartArt Styles group. Also available in this group is the option to change the colors of the graphic. The Design tab also includes utilities to add and rearrange shapes, adjust the layout, or reset the graphic to its original look.
b. Use the features on the Format tab, in the Shape Styles group, to adjust the formatting of the shapes, including the style, fill color, outline, and effects. You can also change the shape and alter the size of the shape by using the features in the Shapes group. Before you begin adjusting the formatting, make sure the Information Technology Services, UIS
3
[Not for Circulation]
shape you want to format is selected.
Saving Presentations Using SmartArt Because SmartArt is new to Office 2007, it cannot be edited or altered in lower versions of PowerPoint. If you save a presentation using SmartArt in the 97-2003 version, PowerPoint will initialize a compatibility checker, which will let you know that the graphic cannot be edited if opened in PowerPoint 97-2003. It will appear in the presentation as a static graphic. To make changes to the graphic, the presentation must be opened in PowerPoint 2007.
Information Technology Services, UIS
4