Critical phenomena in atmospheric precipitation
arXiv:cond-mat/0606076v1 [cond-mat.stat-mech] 2 Jun 2006
Ole Peters∗ CNLS, Los Alamos National Laboratory, MS-B258, Los Alamos, NM 87545, USA. Santa Fe Institute, 1399 Hyde Park Road, Santa Fe, NM 87501, USA. Department of Atmospheric Sciences and Institute of Geophysics and Planetary Physics, University of California, Los Angeles, 405 Hilgard Ave., Los Angeles, CA 90095-1565, USA.
J. David Neelin Department of Atmospheric Sciences and Institute of Geophysics and Planetary Physics, University of California, Los Angeles, 405 Hilgard Ave., Los Angeles, CA 90095-1565, USA. Critical phenomena near continuous phase transitions are typically observed on the scale of wavelengths of visible light[1]. Here we report similar phenomena for atmospheric precipitation on scales of tens of kilometers. Our observations have important implications not only for meteorology but also for the interpretation of self-organized criticality (SOC) in terms of absorbing-state phase transitions, where feedback mechanisms between order- and tuning-parameter lead to criticality.[2] While numerically the corresponding phase transitions have been studied,[3, 4] we characterise for the first time a physical system believed to display SOC[5] in terms of its underlying phase transition. In meteorology the term quasi-equilibrium (QE)[6] refers to a state towards which the atmosphere is driven by slow large-scale processes and rapid convective buoyancy release. We present evidence here that QE, postulated two decades earlier than SOC[7], is associated with the critical point of a continuous phase transition and is thus an instance of SOC. Journal reference: Nature Physics 2, 393 - 396 (2006). doi:10.1038/nphys314
Self-organized criticality has been proposed as an explanation for scale-free behaviour in many different physical systems[8]. In most of these, however, it is impossible to measure standard observables for critical phenomena, such as order parameters, tuning parameters, or susceptibilities. Consequently, despite theoretical advances[2, 3, 4], SOC has only loosely been connected to the broader field of critical phenomena. The present study helps position SOC as a sub-branch of critical phenomena by examining a system where the identification and measurement of standard observables is feasible. At short time scales the majority of tropical rainfall occurs in intense rain events that exceed the climatological mean rate by an order of magnitude or more. Precipitation has been found to be sensitive to variations in water vapour along the vertical on large space and time scales both in observations[9, 10] and in models.[11, 12, 13] This is due to the effect of water vapour on the buoyancy of cloud plumes as they entrain surrounding air by turbulent mixing. We conjecture that the transition to intense convection, accompanying the onset of intense precipitation, shows signs of a continuous phase transition. The water vapour, w, plays the role of a tuning parameter and the precipitation rate, P (w), is the order parameter Note that such a large-scale continuous phase transition involving the flow regime of the convecting fluid is entirely different from the well-known discontinuous phase transition of condensation at the droplet scale. We analyzed satellite microwave retrievals of rainfall, P , water vapour, w, cloud liquid water and sea surface temperature (SST) from the Tropical Rainfall Measuring Mission
from 2000 to 2005. Observations from the western Pacific provided initial support for our conjecture: a power-law pick up of the order parameter above a critical value of the tuning parameter, wc , was observed. We proceded to test whether other observables also behaved as predicted by the theory of phase transitions. As motivation for our conjecture consider a generic lattice-based model which exhibits a continuous phase transition. Particle-conserving rules defining the model ascribe a number of particles to every lattice site, and demand hopping of particles to nearest-neighbour sites when a local density threshold is exceeded. The global effect of these rules is a phase transition at a critical value of the global particle density between a quiescent phase (where the system eventually settles into a stable configuration) and an active phase (where stable configurations are inaccessible). The tuning parameter is the particle density and the order parameter is identified as the density of active sites[14]. SOC can be described in terms of such absorbing-state phase transitions.[2, 14] Here a coupling between order parameter and tuning parameter is introduced by opening the boundaries and adding a slow drive: whenever activity ceases, a new particle is added to the system, i.e., an increase in the tuning parameter. Large activity on the other hand leads to dissipation (particle loss) at the boundaries, i.e., a reduction of the tuning parameter. Such open, slowly driven systems organise themselves to the critical point of the corresponding (closed boundaries, no drive) absorbing state phase transition. The critical behaviour as derived from finite-size scaling
2
hP i (w) = a(w − wc )β ,
(1)
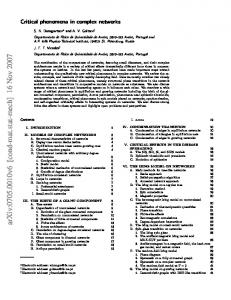
where a is a system-dependent constant and β is a universal exponent. The deviations from power-law behaviour below wc in the main graph of Fig. 1 are typical of critical systems of finite size.[21] The critical value wc is non-universal and changes with regional climatic conditions, as does the amplitude a. To test the degree to which curves from different regions i collapse, we re-scaled the w-values in Fig. 1 by factors fwi , reflecting the non-universality of wc and hP i (w)
σP2
〈P〉(w) 70
20 log〈P〉
60 50
15
40
10
10
0.01
∆w
0.1
30 20
5 10 0 20
30
40
50 Rescaled w (mm)
60
70
Rescaled Precipitation variance (mm/hr) 2
80
25
Rescaled 〈P〉(w) (mm/hr)
analyses is the same in both cases[3, 4], although the reason for this universality is not fully understood.[15] The scale-free avalanche size distributions in SOC models result from the proximity of the system to a critical point. From the meteorological perspective, a related motivation for our conjecture arises. Atmospheric convection has long been viewed similarly in terms of a slow drive (surface heating and evaporation) and fast dissipation (of buoyancy and rainwater) in precipitating convection. Surface heating and evaporation drive turbulent mixing that maintains a moist atmospheric boundary layer. Combined with radiative cooling, conditional instability is created—while sub-saturated air remains stable, saturated condensing plumes can rise through the full depth of the tropical troposphere. The fast dissipation by moist convection prevents the troposphere from deviating strongly from marginal stability.[16] Although observational tests of this approximate QE state of the tropical troposphere have limited precision, it forms the basis of most convective parameterizations in large scale models[17] and much tropical dynamical theory.[18, 19] Taking large-scale flows into account modifies the process in space and time but does not change it fundamentally. This perspective suggests that a critical point in the water vapour would act as an attractor. Indeed this is basically the convective QE postulate.[6] The critical value wc depends, e.g., on atmospheric temperature, but for present purposes this translates well enough into a critical amount of water vapour for a given climatic region. Regions here are defined by longitude ranges given in the caption of Fig. 1 corresponding to major ocean basins, for oceanic grid-points within 20S20N. Data are collected at 0.25 degree latitude-longitude resolution. The observable w captures vertically integrated, or column, water vapour. It is given as a volume per area in units of mm. In Fig. 1 we show as a function of the tuning parameter w the average value of the order parameter hP i (w) and the susceptibility of the system, represented by the order parameter variance, σP2 (w), discussed following Eq. (2). The ensemble size for the average ranges from a few thousand at extremes to 106 at typical w-values. Above wc , the order parameter is well approximated by the standard form[20]
0
FIG. 1: Order parameter and susceptibility. The main figure shows the collapsed (see text) precipitation rates hP i (w) and their variances σP2 (w) for the tropical Eastern (red) and Western (green) Pacific as well as a power-law fit above the critical point (solid line). The inset displays on double-logarithmic scales the precipitation rate as a function of reduced water vapour (see text) for Western Pacific (green, 120E to 170W), Eastern Pacific (red, 170W to 70W), Atlantic (blue, 70W to 20E), and Indian Ocean (pink, 30E to 120E). Data are shifted by a small arbitrary factor for visual ease. The straight lines are to guide the eye. They all have slope 0.215, fitting the data from all regions well.
and σP2 (w) by fPi and fσi 2 , respectively (setting Western Pacific factors to one). For visual clarity, the data collapse in Fig. 1 is shown only for the Eastern and Western Pacific—climatically very different regions. Similar agreement occurs for other regions (steps in the rescaling and figures for all regions are provided in the Supplementary Information). The exponent β seems to be universal and independent of the climatic region. In the inset to Fig. 1 we show the average precipitation as a function of the reduced water vapour ∆w ≡ (w − wc )/wc in a double-logarithmic plot. Importantly, power laws fitted to these distributions all have the same exponent (slope) to within ±0.02. The data points in Fig. 1 represent the entire observational period, including all observed SSTs. Conditioning averages by SST ranges yields similar results (see Fig. 3 and Supplementary Information), reducing the subcritical part of the curves slightly. We define the susceptibility χ(w; L) via the variance of the order parameter σP2 : χ(w; L) = Ld σP2 (w; L),
(2)
where d denotes the dimensionality of the system and L the spatial resolution. Fig. 1 shows a suggestive increase in σP2 near wc , and indicates that standard methods for critical phenomena can sensibly be applied. Next we test for finite-size scaling. Because our system size cannot be changed, we identify the spatial data resolution L as the relevant length scale. Changing L has
3 90
100 10-1 10-2 10-3 10-4
40
500000
101
30
40
50 w (mm)
60
70
30 20 10 0 50
L=2 L=1 L=0.5 L=0.25
55
400000 15 300000 10 200000
0
65
70
75
5
N(w) Precipitating
100000
60
〈P〉(w) 20
N(w)
〈P〉(w) (mm/hr)
50
102
Number of occurrences N(w)
Variance x L2
Precipitation variance x L0.42
60
25
103
80 70
600000
104
20
30
40
50 w (mm)
60
70
0
w (mm)
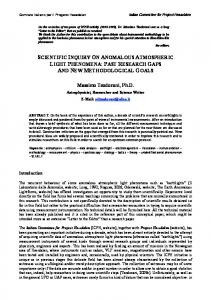
FIG. 2: Finite-size scaling. The variance of the order parameter σP2 (w) as a function of w, rescaled with L0.42 for system sizes 0.25◦ , 0.5◦ , 1◦ , and 2◦ in the Western Pacific. From w ≈ 57 mm, this produces a good collapse. The inset shows that away from the critical point, up to w ≈ 40 mm a trivial rescaling with Ld=2 works adequately. This suggests that the non-trivial collapse is indeed a result of criticality.
the effect of taking averages over different numbers of degrees of freedom and allows one to investigate the degree of spatial correlation. The finite size scaling ansatz for the susceptibility is 1/ν χ(w; L) = Lγ/ν χ(∆wL ˜ ),
(3)
defining γ and ν as the standard critical exponents and the usual finite-size scaling function χ(x), ˜ constant for small arguments |x| ≪ 1 and decaying as |x|−γ for large arguments |x| ≫ 1.[22] The variance σP2 (w; L) is affected by uncertainties in w and wc , making precise quantification of χ(w; L) difficult. We therefore do not estimate γ from the w-dependence of χ(w; L), corresponding to large arguments |x| in Eq. (3) but effectively fix ∆w = 0 = x and obtain γ/ν from the L-dependence of the maximum susceptibility χmax (L). The variance of the average hP i (w; L) over Ld independent degrees of freedom decreases as σP2 (w; L) ∝ L−d . In a critical system, however, the diverging bulk correlation length ξ ∝ (∆w)−ν ≫ L (small argument in Eq. (3)) prohibits the assumption of independence. In this case Eq. (3) with Eq. (2) yields σP2 max (L) ∝ Lγ/ν−d .
(4)
Coarsening the spatial resolution of the data, we find in Fig. 2 that σP2 max (L) scales roughly as L−λ , with λ = 0.46(4). This suggests the exponent ratio γ/ν = 1.54(4). At criticality, the spatial decay of correlations between order parameter fluctuations becomes scale-free.[20] This is equivalent to a non-trivial power-law dependence of the order-parameter variance on L (see Supplementary Information for details and conditions). Hence, Fig. 2
FIG. 3: Residence times. The number of times N (w) an atmospheric pixel of 0.25◦ × 0.25◦ was observed at water vapour w in the western Pacific, given a sea surface temperature within a 1◦ C bin at 30◦ C. The green and blue lines show residence time for all points and precipitating points, respectively. The red line shows the order-parameter pick-up hP i (w) for orientation (precipitation scale on the right).
indicates a scale-free correlation function of fluctuations in the rain rate in the range of 25 km to 200 km. This suggests that the meteorological features known as mesoscale convective systems[23] are long-range correlation structures akin to critical clusters.[24] Synoptic inspection indicates that the high rain rate phase and critical region of Fig. 1 come substantially from points within such complexes (examples are provided in the Supplementary Information). The question of self-organisation towards the critical point of the transition is addressed by displaying the residence times of the system in Fig. 3. This is the number of observations in the 5-year period where the system was found at a given level of water vapour. A slowly driven system would be expected to spend a significant amount of time in the low-w phase because when it fluctuates into this phase e.g. due to some largescale event, it takes a long time to recover. Therefore the distribution decreases slowly towards low values of w. The fast dissipation mechanism, on the other hand, ensures that the system leaves the high-w regime relatively quickly when it fluctuates into it. Consequently the distribution decreases rapidly towards large values of w. For the properties of rainfall, the part of the distribution in Fig. 3 comprised only of observations with rainfall is of interest, seen as the blue line in Fig. 3. We note that the system is most likely to be found near the beginning of the intense precipitation regime. Almost the entire weight of the distribution of rainy times is concentrated here. Meteorologically, these results suggest a means to redefine and extend convective QE, both empirically and theoretically. In its simplest application QE assumes that the relationship among atmospheric column thermody-
4 namic variables is pinned close to the point where deep convection and precipitation set in. Fig. 3 shows this to be a reasonable first approximation , but it also implies associated critical phenomena. A loss term hP i (w) of the form of Eq. (1) implies the absence of any welldefined convective time scale. Scale-free distributions of event sizes[5] and the spatial correlation behavior seen in Fig. 2 may result from this proximity to an apparent continuous phase transition. These findings beg for a simple SOC-type model of the atmospheric dynamics responsible for the critical behaviour. While the physics must conform with recent cloud-resolving model analysis of mesoscale aggregation[11, 25], our results point to the key role of excitatory short-range interactions, essential for critical phenomena of the type seen here. This study advances our understanding of SOC as a critical phenomenon, identifying the underlying phase transition and associated critical phenomena. Beyond scale-free event size distributions it furnishes direct evidence, for the first time, for an underlying phase transition in a physical system. Methods — Data are from the TMI (TRMM microwave imager), processed by Remote Sensing Systems (RSS). The spatial resolution reflects the footprint of the instrument. As with any satellite retrieval product, it is necessary to consider whether the algorithm assumptions could impact the results. The microwave retrieval algorithm is that used on Special Sensor Microwave Imager (SSM/I) data.[26] The combination of four microwave channels permits independent retrieval of water vapour and condensed phase water (with SST and surface wind speed), while an empirical relation is used to partition cloud water and rain. Column water vapour validates well against in situ sounding data, which also show that daily variations are largely associated with the lower troposphere above the atmospheric boundary layer.[9] Validation of TMI rain rate against space-borne precipitation radar (PR) at sub-daily time scales in the tropical Western Pacific[27] show TMI overestimating rain rate but with an approximately linear relationship to PR. We have performed a number of checks to verify that results are not substantially impacted by a high rain rate cutoff in the algorithm (25 mm/h), including comparison to regions where cutoff occurences are very low, such as the eastern Pacific (Fig. 1). The clearest check is that the essential features are identical for the cloud liquid water, whose measurement cutoff of 2.5 mm is never reached (see Supplementary Information). SST data here are averages over non-flagged neighbors in space and time, since SST is not retrieved at high rain rates. The critical value wc is determined by an iterative procedure with an initial guess, followed by a fit to Eq. (1) above wc . Error bars in Fig. 3 are standard errors of the variance σP2 (w; L), determined via the zeroth, second and fourth moments of P (w). Individual measurements of P (w) are considered independent, which holds well be-
tween satellite overpasses, though not within individual tracks.
∗
[1] [2]
[3] [4]
[5] [6]
[7] [8] [9] [10]
[11] [12]
[13] [14]
[15]
[16] [17]
[18] [19]
Electronic address:
[email protected]; URL: http://www.santafe.edu/~ole Klein, M. J. & Tisza, L. Theory of Critical Fluctuations Phys. Rev. 76, 1861-1868 (1949). Dickman, R., Vespignani, A. & Zapperi, S. Self-organized criticality as an absorbing-state phase transition. Phys. Rev. E 57(5), 5095–5105 (1998). cond-mat/9712115 Dickman, R. et al. Critical behaviour of a onedimensional fixed-energy stochastic sandpile. Phys. Rev. E 64, 056104 (2001). cond-mat/0101381 Christensen, K. et al. Avalanche Behavior in an Absorbing State Oslo Model. Phys. Rev. E 70, 067101 (2004). cond-mat/0405454 Peters, O., Hertlein, C. & Christensen, K. A complexity view of rainfall. Phys. Rev. Lett. 88, 018701 January (2002). cond-mat/0201468 Arakawa, A. & Schubert, W. H. Interaction of a cumulus cloud ensemble with the large-scale environment, Part I. J. Atmos. Sci., 31, 674–701 (1974). Bak, P., Tang, C. & Wiesenfeld, K. Self-Organized Criticality: An Explanation of 1/f Noise. Phys. Rev. Lett. 59(4), 381–384 (1987). Christensen, K. & Moloney, N. Complexity and Criticality (Imperial College Press, 2005). Bretherton, C. S., Peters, M. E. & Back, L. E. Relationships between Water Vapor Path and Precipitation over the Tropical Oceans. J. Climate 17, 1517–1528 (2004). Parsons, D. B., Yoneyama, K. & Redelsperger, J.-L. The evolution of the tropical western Pacific oceanatmosphere system following the arrival of a dry intrusion. Q. J. Roy. Met. Soc., 126, 517-548 (2000). Tompkins, A. M. Organization of Tropical Convection in Low Vertical Wind Shears: The Role of Water Vapor. J. Atmos. Sci.. 58, 529-545 (2001). Grabowski, W. W. MJO-like Coherent Structures: Sensitivity Simulations Using the Cloud-Resolving Convection Parameterization (CRCP), J. Atmos. Sci., 60, 847-864 (2003). Derbyshire, S. H. et al. Sensitivity of moist convection to environmental humidity. Q. J. Roy. Met. Soc., 130, 3055-3079 (2005). Marro, J. and Dickman, R. Nonequilibrium Phase Transitions in Lattice Models. (Cambridge University Press, 1999). Pruessner, G. and Peters, O. Absorbing state and SelfOrganized Criticality: Lessons from the Ising Model. Phys. Rev. E 73, 025106 (2006). cond-mat/0411709. Xu, Kuan-man & Emanuel, K. A. Is the tropical atmosphere conditionally unstable? Mon. Wea. Rev., 117, 1471–1479 (1989). Arakawa, A. The cumulus parameterization problem: Past, present, and future. J. Climate, 17, 2493–2525 (2004). Emanuel, K. A., Neelin, J. D. & Bretherton, C. S. On large-scale circulations in convecting atmospheres. Q. J. Roy. Met. Soc., 120, 1111-1143 (1994). Neelin, J. D., & Zeng, N. A quasi-equilibrium tropical
5
[20] [21] [22]
[23] [24] [25]
circulation model–formulation. J. Atmos. Sci. 57, 1741– 1766 (2000). Yeomans, J. Statistical Mechanics of Phase Transitions. (Oxford University Press, 1992). Fisher, M. E. & Barber, M. N. Scaling Theory for FiniteSize Effects in the Critical Region Phys. Rev. Lett., 28 (23), 1516-1519 (1972). Privman, V., Hohenberg, P. C., & Aharony, A. In Phase Transitions and Critical Phenomena, (eds Domb, C. & Lebowitz, J. L.), volume 14, chapter 1, 1–134. (Academic Press, New York, 1991). Houze, R. A., Cloud Dynamics. (Academic Press, 1993). Stauffer, D. and Aharony, A. Introduction to Percolation Theory, 2nd ed. (Taylor and Francis, London, 1992). Bretherton, C. S., Blossey, P. N. & Khairoutdinov, M. An energy balance analysis of deep convective selfaggregation above uniform SST. J. Atmos. Sci., 62, in press.
[26] Wentz, F. J. & Spencer, R. W. SSM/I rain retrievals within a unified all-weather ocean algorithm. J. Atmos. Sci. 56, 1613–1627 (1998). [27] Ikai, J. & Nakamura, K. Comparison of rain rates over the ocean derived from TRMM microwave imager and precipitation radar. J. Atmos. Oceanic Technol., 20, 1709-1726 (2003).
Supplementary Information is provided at www.nature.com/nphys/journal/v2/n6/abs/nphys314.html This work was supported under National Science Foundation grant ATM-0082529 and National Oceanic and Atmospheric Administration grants NA05OAR4310013 (JDN and OP) and the US Department of Energy (W7405-ENG-35) (OP). We thank D. Sornette for connecting the authors, and the RSS rain team for discussion.