Jul 7, 2005 - RAIM is based on stockmarket quotes from the Bloomberg ... are triggered by both good news and bad news relating to the Mass. economy.
The computational challenge Assembling the data automatically Computing the index with Stata Generating the web pages Some issues
cron, perl and Stata: Automated production and presentation of a business-daily index North American Stata Users Group, Boston, 11–12 July 2005
Christopher F Baum1
Atreya Chakraborty2
1 Department
of Economics Boston College
2 College of Management University of Massachusetts–Boston
8th July 2005 Baum & Chakraborty
cron, perl and Stata
The computational challenge Assembling the data automatically Computing the index with Stata Generating the web pages Some issues
Outline 1
The computational challenge
2
Assembling the data automatically Acquire daily stockmarket quotes in real time and store Integrate daily quotes into unbalanced panel
3
Computing the index with Stata
4
Generating the web pages Tabular display Graphics Tab-delimited file format
5
Some issues Baum & Chakraborty
cron, perl and Stata
The computational challenge Assembling the data automatically Computing the index with Stata Generating the web pages Some issues
Risk Appetite Index for Massachusetts (RAIM) RAIM: an index, developed by Profs. Bandopadhyaya and Jones of UMass-Boston College of Management, that measures investors’ sentiment toward firms active in the local economy. The index deals with the notion that regional economies’ market dynamics may differ substantially from national trends, and some investors may have a local preference in forming their portfolios. RAIM is based on stockmarket quotes from the Bloomberg “Massachusetts Index” of about 240 traded firms based in or doing considerable business in Massachusetts. The firms’ quotes and the Mass Index are available daily from the Bloomberg website. Baum & Chakraborty
cron, perl and Stata
The computational challenge Assembling the data automatically Computing the index with Stata Generating the web pages Some issues
Quantifying the Market’s Appetite for Risk Research in currency markets has shown that the market’s changing appetite for risk is the most influential factor affecting currency returns. Values of the RAIM index, measuring the market’s appetite for risk, allow classification of trading days into risk seeking, risk averse or neutral. Movements in the RAIM are triggered by both good news and bad news relating to the Mass. economy. Changes in the RAIM index have been shown to be highly correlated to changes in the Bloomberg Massachusetts Index, a measure of returns from holding a portfolio of Massachusetts firms. Baum & Chakraborty
cron, perl and Stata
The computational challenge Assembling the data automatically Computing the index with Stata Generating the web pages Some issues
The challenge: implementing a real-time RAIM
RAIM’s developers want a mechanism by which the RAIM will be calculated automatically from each trading day’s quotations on firms in the Mass. Index, and web pages automatically updated. Elements of the solution, as implemented on Mac OS X 10.3: cron to schedule a daily Unix process; perl to acquire the data and put it in readable format for Stata; console version 8 of Stata to generate the RAIM and produce web pages / graphics
Baum & Chakraborty
cron, perl and Stata
The computational challenge Assembling the data automatically Computing the index with Stata Generating the web pages Some issues
Data acquisition and manipulation A Unix cron script schedules a process to run at a specific interval. In our case, the cron script on our Mac OS X system runs every morning at 2:30 AM, and launches a perl program, bloomberg.pl. The perl program uses the LWP::Simple package function get() to copy the contents of the web page listing the firms in the Bloomberg Massachusetts Index, and parse that HTML into a tab-delimited .raw file readable by Stata. The perl program then writes a Stata program, bloomberg.do, which reads that .raw file and saves it as a .dta file, time-stamped with the quote date. Stata is launched by the cron script to run bloomberg.do. Baum & Chakraborty
cron, perl and Stata
The computational challenge Assembling the data automatically Computing the index with Stata Generating the web pages Some issues
Generating a panel of daily quotes The cron script then launches Stata to run bloomberg_combine.do, which uses N.J. Cox’s fs command to locate all time-stamped daily quote files. The program uses Stata’s cf command to determine whether files are redundant: e.g., those generated on Sunday or Monday morning, which like Saturday morning’s file will be based on Friday trading. This also removes holidays from the set under consideration. When all unique files are identified, they are appended into BloombergAll.dta, set up as a panel (tsset) with firm name (encoded to numeric format) and trading day number (not date). The panel is unbalanced since firms may be added or dropped each day. Baum & Chakraborty
cron, perl and Stata
The computational challenge Assembling the data automatically Computing the index with Stata Generating the web pages Some issues
Computation of the RAIM index The RAIM is based on a specific “window width” of recent quotes, presently set to five trading days Stata program calcRAIM.do is invoked by the cron script to generate a five-day moving standard deviation of daily returns, σ ˆt , utilizing Cox and Baum’s mvsumm routine The resulting series is used in a Spearman rank correlation (spearman) to calculate, for each trading day, the relation between the σ ˆt of returns and the percentage changes in firms’ stock prices. The resulting index is scaled to lie in the [-100,+100] interval.
Baum & Chakraborty
cron, perl and Stata
The computational challenge Assembling the data automatically Computing the index with Stata Generating the web pages Some issues
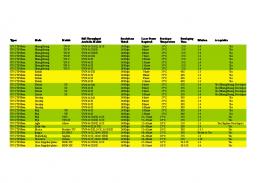
Generating a tabular display of the RAIM Program calcRAIM.do then uses Stata’s file command to write a text file, raim.php, in HTML format with embedded PHP directives. The RAIM index for each trading day, sorted (gsort) in reverse chronological order, is displayed in a HTML table. Since the RAIM index is a product of Boston’s public business school, UMass-Boston, headers and footers from the College of Management web site are added to give the RAIM display the proper brand identity Links are added for additional views of the available history of RAIM values Baum & Chakraborty
cron, perl and Stata
The computational challenge Assembling the data automatically Computing the index with Stata Generating the web pages Some issues
Generating a graphical display of the RAIM
A simple tsline graph of the RAIM for each trading day is generated and saved in PostScript (.ps) format via graph export. A call to the Unix shell invokes the GhostScript utility ps2png, which translates the graph into .png format, suitable for inclusion on a web page
Baum & Chakraborty
cron, perl and Stata
The computational challenge Assembling the data automatically Computing the index with Stata Generating the web pages Some issues
Generating a tab-delimited listing of the RAIM
Another web page is generated by Stata’s file command: raim.txt, listing the trading day and RAIM value in tab-delimited format This page, linked to the main RAIM page, may be saved to disk if analysis of the RAIM values in Stata, Excel or other packages is desired
Baum & Chakraborty
cron, perl and Stata
The computational challenge Assembling the data automatically Computing the index with Stata Generating the web pages Some issues
Some issues... The routine must be run in Stata 8.2, since a console version for Mac OS X is not available for Stata 9, and the “hands-off” mode of operation cannot be accomplished with the GUI version of Stata. Officlal spearman produces a t-test for the hypothesis that ρ = 0, but no standard error of ρ. I would like to produce 95% confidence bands, and have written spearman2 to return the standard error of ρ as well. The console version of Stata interfaces very well with other Unix components: cron, perl, PHP and the Apache web server to provide a fully automated solution to the challenge of generating a business-daily index. Baum & Chakraborty
cron, perl and Stata
The computational challenge Assembling the data automatically Computing the index with Stata Generating the web pages Some issues
Screen shots
Baum & Chakraborty
cron, perl and Stata
College of Management
http://repec.org/raim/raim.php
Risk Appetite Index in Massachusetts [RAIM]
1 of 2
Quote date
RAIM
P-value
# Firms
06jul2005
-12.7782
0.047
242
05jul2005
2.7844
0.666
242
01jul2005
7.9994
0.215
242
30jun2005
-22.7382
0.000
242
29jun2005
-4.6362
0.473
242
28jun2005
31.2105
0.000
242
27jun2005
-18.2089
0.004
242
24jun2005
1.4824
0.819
242
23jun2005
-25.3281
0.000
241
22jun2005
0.6189
0.924
241
21jun2005
-11.2244
0.082
241
20jun2005
11.8934
0.066
240
19jun2005
21.7152
0.001
240
17jun2005
22.9104
0.000
241
16jun2005
13.0527
0.043
241
15jun2005
-1.6338
0.801
241
14jun2005
2.2860
0.723
242
13jun2005
2.1315
0.741
242
10jun2005
2.3420
0.717
242
09jun2005
10.7858
0.095
241
08jun2005
3.2513
0.615
241
07jun2005
-6.6923
0.300
242
06jun2005
0.3261
0.960
242
05jun2005
-12.1187
0.060
242
03jun2005
-11.3955
0.076
243
02jun2005
0.4771
0.941
243
01jun2005
1.5849
0.806
243
31may2005
-4.1381
0.520
244
29may2005
9.6685
0.132
244
28may2005
7.4121
0.249
244
26may2005
21.6962
0.001
244
25may2005
-5.3862
0.402
244
24may2005
-6.1347
0.340
244
20may2005
7.5806
0.238
244
19may2005
-3.7461
0.561
243
18may2005
23.4830
0.000
243
17may2005
0.7538
0.907
243
7/7/05 4:54 PM
College of Management
http://repec.org/raim/raim.php
16may2005
-5.2037
0.419
243
13may2005
-4.2227
0.511
244
12may2005
-7.8106
0.224
244
11may2005
-0.8179
0.899
244
10may2005
-11.5883
0.070
245
09may2005
17.7676
0.005
245
06may2005
-1.0903
0.865
245
05may2005
0.6442
0.920
245
04may2005
14.5780
0.022
245
03may2005
-1.9823
0.758
245
02may2005
3.2063
0.617
245
01may2005
19.5772
0.002
246
29apr2005
12.3132
0.054
246
28apr2005
-25.6828
0.000
245
27apr2005
1.7532
0.785
245
26apr2005
-18.8534
0.003
245
25apr2005
5.7389
0.371
245
22apr2005
-25.8827
0.000
245
21apr2005
35.2729
0.000
245
RAIM graph | downloadable text file Home | Contact | Sitemap | About Us | Undergraduate Program | Graduate Programs | Faculty & Research | Business Centers | Calendar UMass Boston Homepage | Privacy Policy
University of Massachusetts Boston College of Management © 2005
2 of 2
7/7/05 4:54 PM
College of Management
http://repec.org/raim/raim_gph.php
Risk Appetite Index in Massachusetts [RAIM]
Home | Contact | Sitemap | About Us | Undergraduate Program | Graduate Programs | Faculty & Research | Business Centers | Calendar UMass Boston Homepage | Privacy Policy
University of Massachusetts Boston College of Management © 2005
1 of 1
7/7/05 4:56 PM
http://repec.org/raim/MassInd/raim.txt
quotedate 21apr2005 22apr2005 25apr2005 26apr2005 27apr2005 28apr2005 29apr2005 01may2005 02may2005 03may2005 04may2005 05may2005 06may2005 09may2005 10may2005 11may2005 12may2005 13may2005 16may2005 17may2005 18may2005 19may2005 20may2005 24may2005 25may2005 26may2005 28may2005 29may2005 31may2005 01jun2005 02jun2005 03jun2005 05jun2005 06jun2005 07jun2005 08jun2005 09jun2005 10jun2005 13jun2005 14jun2005 15jun2005 16jun2005 17jun2005 19jun2005 20jun2005 21jun2005 22jun2005 23jun2005 24jun2005 27jun2005 28jun2005 29jun2005 30jun2005 01jul2005 05jul2005 06jul2005
1 of 1
RAIM 35.2729 -25.8827 5.7389 -18.8534 1.7532 -25.6828 12.3132 19.5772 3.2063 -1.9823 14.5780 0.6442 -1.0903 17.7676 -11.5883 -0.8179 -7.8106 -4.2227 -5.2037 0.7538 23.4830 -3.7461 7.5806 -6.1347 -5.3862 21.6962 7.4121 9.6685 -4.1381 1.5849 0.4771 -11.3955 -12.1187 0.3261 -6.6923 3.2513 10.7858 2.3420 2.1315 2.2860 -1.6338 13.0527 22.9104 21.7152 11.8934 -11.2244 0.6189 -25.3281 1.4824 -18.2089 31.2105 -4.6362 -22.7382 7.9994 2.7844 -12.7782
7/7/05 4:56 PM