Computers and Electronics in Agriculture 84 (2012) 111–123
Contents lists available at SciVerse ScienceDirect
Computers and Electronics in Agriculture journal homepage: www.elsevier.com/locate/compag
CropScape: A Web service based application for exploring and disseminating US conterminous geospatial cropland data products for decision support Weiguo Han a,⇑, Zhengwei Yang b, Liping Di a, Richard Mueller b a
Center for Spatial Information Science and Systems, George Mason University, 4400 University Drive, MS 6E1, Fairfax, VA 22030, USA US Department of Agriculture, National Agricultural Statistics Service, Research and Development Division, Spatial Analysis Research Section, 3251 Old Lee Highway, Room 305, Fairfax, VA 22030, USA
b
a r t i c l e
i n f o
Article history: Received 29 August 2011 Received in revised form 19 January 2012 Accepted 8 March 2012
Keywords: Cropland Data Layer Land cover Spatial–temporal analysis Geospatial raster database Web geoprocessing service On-demand statistics
a b s t r a c t The Cropland Data Layer (CDL) contains crop and other specific land cover classifications obtained using remote sensing for the conterminous United States. This raster-formatted and geo-referenced product has been widely used in such applications as disaster assessments, land cover and land use research, agricultural sustainability studies, and agricultural production decision-making. The traditional CDL data distribution channels include paper thematic maps, email data requests, CD/DVD media, and ftp bulk downloading. To effectively and efficiently meet the growing needs of our customers, CropScape (the name invented for a new interactive Web CDL exploring system) was developed to query, visualize, disseminate, and analyze CDL data geospatially through standard geospatial Web services in a publicly accessible online environment. CropScape not only offers the online functionalities of interactive map operations, data customization and downloading, crop acreage statistics, charting and graphing, and multitemporal change analysis as well in an interoperable manner, but also provides Web geoprocessing services such as automatic data delivery and on-demand crop statistics for uses in other applications. This system delivers dynamic user experiences with its comprehensive capabilities in an open geospatial context, and facilitates delivery and analysis of geospatial cropland information for decision support and various research endeavors. More than 17,000 users around the world have visited CropScape in its first 5 months of availability. Ó 2012 Elsevier B.V. All rights reserved.
1. Introduction Knowledgeable agricultural decision-making and policy formulation are critical to US and global agricultural sustainable development, food security, and economic prosperity. Farming decisions are becoming more complex because of the internationalization of agricultural product markets, global climate change, and the need for farmers to adopt sustainable farming practices (Lynch et al., 2000). Incomplete information is one of the main constraints for decision-making (Bacic et al., 2006). The availability of and access to geo-information are particularly crucial for the design, implementation, and monitoring of agri-environmental schemes (Castelein and de Bruin, 2007). The systematic process and system for collecting, processing, storing, archiving, preserving, retrieving, visualizing, analyzing, and disseminating agro-geoinformation are critical for the best use of agro-geoinformation, the agricultural -related geo-information that supports agricultural decision-making and policy formulation. Geo-information technology, such as remote sensing technology for mapping the land cover of the Earth ⇑ Corresponding author. Tel.: +1 703 993 6111; fax: +1 703 993 6127. E-mail address:
[email protected] (W. Han). 0168-1699/$ - see front matter Ó 2012 Elsevier B.V. All rights reserved. http://dx.doi.org/10.1016/j.compag.2012.03.005
(agricultural land, forest, wetland, etc.) from satellites (Jensen, 2004), geographic information systems (GIS) for capturing, storing, manipulating, and displaying geographic information in digital form (Clarke, 1997; DeMers, 1997), and communication technologies, notably the Internet, for accessing, processing, and disseminating agro-geoinformation has offered appropriate technology for establishing such a systematic process and developing such a system. US Department of Agriculture (USDA), National Agricultural Statistics Service (NASS) collects and provides timely, accurate, and useful statistical information in service to US agriculture. The Spatial Analysis Research Section (SARS) within the Research and Development Division of NASS has produced a yearly Cropland Data Layer (CDL) product based on mid-resolution satellite data and high quality ground truth since 1997 (Boryan et al., 2011). This agricultural geospatial data is a crop and other specific land cover classification encompassing the entire contiguous United States. It provides geo-referenced, high accuracy, 30 or 56 m resolution, crop specific cropland land cover information. This product has been extensively used by policy and decision makers, scientists, researchers, educators, and farm producers for land cover monitoring, agricultural sustainability, crop acreage and yield estimation,
112
W. Han et al. / Computers and Electronics in Agriculture 84 (2012) 111–123
2. Materials and methods
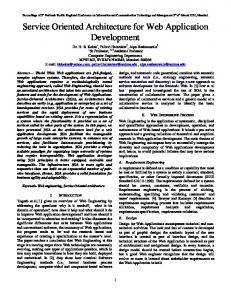
rized geo-referenced annual CDL product. The NLCD derived products, such as the National Elevation Dataset (NED), percent tree canopy, and the percent impervious product data are used as an ancillary dataset for classification (Boryan et al., 2011). The result of this classification is a crop-specific, 30 or 56 m resolution land cover image (thematic map) encompassing the entire contiguous United States, as shown in Fig. 1. The CDL product is a geo-referenced raster dataset. The standard product is projected in the Albers equal area projection and distributed in GeoTIFF format. NASS also provides the metadata files in .html and .xml formats, and the ‘‘super-matrix’’ accuracy assessments of all states CDL data for the crop year 20091 and 20102 on its website. The published CDL data dates back to 1997. The spatial resolution of most CDL data is 30 m, but for the crop years 2006–2009, the resolution is 56 m. Starting from 2009, the CDL product covers all 48 conterminous states. This geospatial product derived from remote sensing and ground truth data delivers approximated acreage estimates by counting pixels within a given area of interest (AOI), an estimate that is not considered as a NASS official estimate, and provides detailed geolocation information on the planted crops. All available CDL data needed to be served online to facilitate users to visualize, retrieve, analyze, and utilize the data. However, the mid-resolution, huge data volume, and large spatial coverage of the CDL raster data (A state CDL data file could be up to 700 MB or more) presented a big challenge to achieve the online visualization, dissemination and analysis over the Web. The traditional distribution channels as previously described greatly limited the effectiveness and efficiency for the CDL data publishing, equal access, dissemination and usage, and could not meet the growing needs from the community. Therefore, this paper focuses on answering questions about how to serve all CDL data online and how to provide the capabilities of geospatial querying, exploring, and analyzing online via a Web application. The raster data to be served online also includes the Global Land Cover Data, which is served as a background map layer for reference purposes. This dataset classifies the global land surface into 22 categories at 300 m resolution (POSTEL, 2008). In addition to the CDL raster data, different boundary layers are served to define the specific AOI for visualization, navigation, and analysis. The latest 2010 TIGER/Line Shapefiles for the 48 contiguous states and their counties as well as the District of Columbia from the US Census Bureau website (US Census Bureau, 2010) were used as boundary feature data in CropScape. Moreover, the Agricultural Statistics District (ASD) was also included as an important boundary for crop acreage analysis. An ASD is defined by a group of counties which have similar cropping practices, geographic features, and climate conditions within a state. The ASD boundaries are pre-generated by merging the boundary files of counties within the same district. Beyond these predefined state, county and ASD permanent boundaries, the user defined, simple boundaries are also supported in the form of AOI to meet the user’s specific analysis needs. In CropScape, the USDA NASS (2007) tabulated county statistical data was also considered for spatial queries. The county level major crop acreages from the Census of Agriculture were included for comparison (NASS, 2007).
2.1. CDL data
2.2. System requirements and specifications
USDA/NASS classifies US crop cover types using satellite imagery from the Advanced Wide Field Sensor (AWiFS) and Landsat TM 5 and ETM+ 7. It uses USDA Farm Service Agency (FSA) Common Land Unit (CLU) data and associated Administrative Data 578 attribute data (which includes all crop specific information such as crop type, status, and intention codes), NASS’s June Agricultural Survey (JAS) data, and US Geological Survey (USGS)’s National Land Cover Datasets (NLCD) as ground truth to produce the catego-
The business and system requirements for the proposed Webbased application were collected and refined by intensively communicating with stakeholders and users. The system requirements
disaster assessment, bioenergy crop inventory, food security policy, environmental assessment, carbon accounting, and other research interests that are of vital importance to American agriculture and its economy (Kutz et al., 2012; Liknes et al., 2006; Maxwell et al., 2010; Muller et al., 2008; Shao et al., 2010; Shore et al., 2006; Shore and Gregory, 2010; Sun et al., 2008; Wang et al., 2011; West et al., 2010). This valuable CDL product was historically disseminated to users via paper thematic maps, CD/DVD media, or FTP download via zipped files from the NASS (NASS, 2011) website or the USDA Geospatial Data Gateway (NRCS, 2011). The CDL users had challenging tasks in locating, acquiring, accessing, visualizing, analyzing, manipulating, or consuming this geospatial data product. The need for special visualization and analytical software or tools also became a burden for users. Moreover, the traditional dissemination channels did not provide any data access, manipulation, processing, and analysis capabilities to the end users or any Web services to other desktops or distributed applications. Obviously, the current dissemination methods were ineffective, and could no longer meet the growing and demanding needs of the agricultural community and general public domain. A fast, open and interoperable data access and dissemination application system with online data navigation, visualization, and analysis capabilities and services was badly needed. This paper describes CropScape (http://nassgeodata.gmu.edu/CropScape/), a Web service-based and rich internet application that handles large volumes of data, intensive computation, concurrent access and spatial–temporal intensity. The paper also addresses major issues involved in agro-geoinformation utilization and explores how to integrate different geospatial data handling tasks and services, such as easy and open access, online visualization, geospatial navigation and querying, reformatting and transformation, delineation of area of interest, on-the-fly data analysis, data processing, and dissemination, into an agro-geoinformation application based on distributed geospatial services and components. CropScape uses intuitive building of the end user’s skills and experiences to design a user interface that is effective for both beginners and advanced users. The scalability, reusability, interoperability, performance, and efficiency are balanced in the application of a Service-Oriented Architecture (SOA), and in the implementation of Web services. These services along with CDL agro-geospatial data can be shared, and integrated by third parties into their geospatial Web applications. Finally, the described CropScape application was used in assessing the impact of the 2011 Mississippi River flood disaster on cropland damage in Mississippi County, Missouri. The remainder of this paper is organized as the following: Section 2 introduces the CDL product background, the system requirements and specifications, architecture framework design along with its implementation, and the detailed system functionalities and their Web service implementations. Section 3 presents CropScape application case studies. Section 4 discusses applications of CropScape and future work. Section 5 summarizes conclusions.
1 http://www.nass.usda.gov/research/Cropland/docs/CDL_2010_accuracy_ assessments.zip. 2 http://www.nass.usda.gov/research/Cropland/docs/CDL_2009_accuracy_ assessments.zip.
W. Han et al. / Computers and Electronics in Agriculture 84 (2012) 111–123
113
Fig. 1. 2009 Cropland Data Layer: a thematic map in raster format.
reflected the needs of most users, especially those who do not have GIS software or GIS skills and experience. It was required that the proposed CropScape application should provide the capabilities of accessing, customizing, downloading, analyzing, and disseminating CDL data, and online user guides and help documents to users. In addition, some open and standards-compliant Web geospatial services should be offered with detailed descriptions and technical support. Those web services can enable the CDL data served with CropScape to be easily integrated with other third party geospatial applications. A successful Web-based decision support application system should be fast and user-friendly, and provide sufficient and highly useful capabilities to end users (Keil et al., 1995; Fernandez and Neal, 2007). The latest Web technologies and Open Geospatial Consortium (OGC) standards offer the best solutions to develop an open geospatial Web application to meet all these requirements (Iosifescu-Enescu et al., 2010) and to support serving the CDL to the general public and the business, science, research, and educational communities. Such an agricultural geospatial Web application will help users access, query, visualize, customize, download, and analyze CDL data interactively at any geographic level using common Internet browsers, and provide other applications standard Web geospatial data retrieval and processing services. In particular, the specified CropScape functionalities include common map functions, layer display control, defining any AOI by a boundary or geometry, multiple data retrieval options, support of various output format and projection, acreage statistics calculation, chart and table exporting, land cover change analysis and display, and map export and printing, etc. These functionalities are implemented in either callable Web services or internal functions. The detailed software implementation specifications are further developed based on these function definitions and system design.
2.3. Architecture framework design A general 3-layer framework is adopted to share and distribute geospatial data and to achieve the objectives of this system, as shown in Fig. 2. SOA allows for quick response to new requirements for other geospatial data and assimilates new geospatial data and processing services from service providers (Granell et al., 2010). It also provides maximum system scalability for future system augmentation. Open Web standards and OGC geospatial data and processing standards are adopted in this extensible framework to make it accessible, interoperable, and reusable. As illustrated in Fig. 2, the application layer includes various geospatial applications that support standard Web and OGC services; these applications like ArcGIS Explorer (ArcGIS Explorer Desktop, 2011) could mash-up available online data services with local data layers or invoke Web processing services in their own environment. The service layer contains OGC standard compliant Web Feature Service (WFS) (Vretanos, 2005), Web Map Service (WMS) (de la Beaujardière, 2006), Web Coverage Service (WCS) (Whiteside and Evans, 2008) and Web geoprocessing services to provide geospatial data and processing services. The Data Layer offers various geospatial and attribute data which are stored in files or databases, and could be accessed directly or indirectly by geospatial data and processing services. The data from Data Layer are processed and or served by Web services contained in the Service Layer. The processed results or data retrieved from the Data Layer are sent back to the clients in the application layer. The next sub-section will discuss these three layers in details. 2.3.1. Application layer In the implementation of CropScape, open source JavaScript libraries, ExtJS (ExtJS 4, 2011) and OpenLayers (OpenLayers, 2011),
114
W. Han et al. / Computers and Electronics in Agriculture 84 (2012) 111–123
Fig. 2. System architecture framework.
are used to develop an Ajax-powered rich Internet application (as shown in Fig. 2) which can be accessed through most common browsers, for example, Internet Explorer, Firefox, Safari, Opera, and Chrome, without installing any additional software or plugin (Han et al., 2011; Lawton, 2008). Users, even those who do not have specialized computer skills or GIS experiences, can use this Web application easily (Han et al., 2009). ExtJS is a free cross-browser JavaScript framework that provides a wide range of user interface components and APIs to build responsive Web applications (Sencha, 2011). ExtJS is among the most popular open source JavaScript packages because of its valued community support, high performance, and ease of maintenance. OpenLayers offers an Ajax-enabled open source Web mapping framework that supports map layers from OGC WMS and WFS, Geography Markup Language (GML), Google Maps, Yahoo Maps, and Bing Maps, and interacts with these layers through a suite of map controls. A user-friendly interface as shown in Fig. 3 is designed using different groups of application functionalities. A user interface design principle is adopted with no submenu deeper than three layers. In the user interface that uses ExtJS, the map layer control is created with radio boxes and check boxes to show or hide the layers. The transparency of these layers can be adjusted by moving the slide bar. The legend window provides the category names with the specified colors and the boundary layer names. An overview window maintains the global view of the current map view location. A common toolbar, which contains a set of common functional buttons across the pages, is created to facilitate map operations and data analysis. It gives consistency in look and feel as well as implementation. And the geo-location of the current cursor position is displayed on the toolbar. The Help and FAQ buttons on the right side of the toolbar together with the DEMO link at the bottom provide users with assistance in use of the CropScape application. The map view is implemented based on OpenLayers to support Web-based map display and map operations like zoom in/out, drag-box zoom, and panning. HTTP GET/POST requests are utilized in the communications be-
tween clients and the server through messages in XML or JavaScript Object Notation (JSON) format. Overall, CropScape client interface offers users a direct, interactive, and responsive way to view, query, download, and analyze CDL data. 2.3.2. Service layer The service layer contains open Web geospatial data services and specially developed Web geo-processing services. MapServer (Kropla, 2005) deployed in Apache’s Common Gateway Interface (CGI) acts as the server of WFS, WCS, and WMS because of its popularity, high performance, and robustness. In CropScape, a browser client sends a WMS GetMap request to render map layers, including: background layer, CDL layers, and political boundary layers, a WMS GetFeatureInfo request to query the detailed information of specified features, and a WFS GetFeature request to retrieve boundary features in GML. The boundary features are to be displayed and highlighted in the map view. Other operations defined in these OGC standards can also be accessed by users in their applications to interoperate with geospatial data deployed in CropScape. The standard GetCoverage operation in the OGC WCS specification supports CDL data retrieval only within a specified bounding box defined in a spatial reference system (SRS) that is defined by OGC’s Spatial Feature Access and its corner coordinates. For ad hoc analysis, the coverage in most cases is a political boundary such as a state, ASD, or county. These boundaries are usually not rectangular in shape and are not supported by the GetCoverage operation. Therefore, a new geoprocessing service named GetCDLFile is implemented in CropScape to fetch irregularly shaped CDL data utilizing Federal Information Processing Standards (FIPS) codes of a state and county or ASD code. Its detailed implementation is discussed in Section 2.4.2.4. Similarly, several other geospatial processing services, GetCDLValue, GetCDLImage, GetCDLStat, ExtractCDLByValues, and GetCDLComp are developed to provide different special functionalities. These services provide common GIS functions which can be accessed in the browser client and called in other geospatial appli-
W. Han et al. / Computers and Electronics in Agriculture 84 (2012) 111–123
115
Fig. 3. CropScape user interface.
cations. The GetCDLValue service finds the pixel value at a given location, and the corresponding category along with the location and color will be displayed in a popup balloon window in the browser client of CropScape. The GetCDLStat service computes the statistical information (crop acreage) of the CDL data defined by the AOI based on pixel counting. The approximated crop acreage (not a NASS official estimate) is calculated from the pixel count and the pixel size. The GetCDLStat service sends the results in JSON for display in table, pie, and bar charts in the browser client of CropScape, or for export as a spreadsheet in CSV format. The ExtractCDLByValues service extracts values of the crops of interest from the CDL data within the AOI, composes a thematic map only with the crops of interest and exports it to an image file in GeoTiff format. The GetCDLImage service generates the preview images of the customized CDL data and the Keyhole Markup Language (KML) file with links to actual images that can be displayed in Google Earth. The GetCDLComp service performs cropland change analysis by comparing the pixels of the cropland area defined by AOI between two given years. The results of comparison are sent to the browser client in JSON, and shown in a table or thematic map.
2.3.3. Data layer The data layer includes raster, vector, and tabular data. The raster data includes all historical CDL layers, and a background map layer. The vector data includes different boundary layers, such as state, ASD, and county boundaries. The tabular data includes the USDA NASS county level acreage statistics from the 2007 Census of Agriculture. Historical state CDL data range from 1997 to 2010. The spatial resolution of the CDL data for crop years 2006–2009 is 56 m. For all other crop years, the resolution of CDL data is 30 m. From 2009, the spatial coverage of the CDL encompasses all 48 conterminous states. The annual state CDL data are mosaiced into a single raster file, converted
to ERDAS Imagine (.img) format, and built into tiled pyramid levels for better display performance. These data files are served by WMS to provide images for the CropScape client and other geospatial applications, and by WCS and WFS to retrieve CDL data within the AOI. The background map layer, Global Land Cover Data, produced by POSTEL Service Centre from the European Space Agency (ESA) is also served by WMS in CropScape. The vector data, such as the 2010 TIGER/Line Shapefiles for 48 contiguous states and their counties as well as the District of Columbia, and the ASD boundaries files are served by WMS to provide the images of these vector layers and to define the AOI for display. Other feature data such as tabular data of county level acreage information from the 2007 Census of Agriculture are served by WFS to query feature information in the browser client.
2.4. System functionalities implementation with Web services The application system functionalities were implemented by integrating and/or reusing existing Web services, including OGC web services and web geoprocessing services especially developed for CropScape in the SOA environment. As indicated in Section 2.3.2, the OGC Web services include WMS, WCS, and WFS while the specially developed web geoprocessing services comprise GetCDLFile, GetCDLValue, GetCDLImage, ExtractCDLByValues, GetCDLStat, and GetCDLComp. The user interface of each function was implemented in the CropScape application client, which is responsible for capturing and sending parameters and specifications, and requesting messages to the server to invoke the service, and receiving and displaying the feedback results from the server. The invoked service processes the geospatial data layer(s) on the server and sends back the processed results to the client that requested the services. All geospatial data layers
116
W. Han et al. / Computers and Electronics in Agriculture 84 (2012) 111–123
Fig. 4. Data flow diagram.
are stored on the server. Some preprocessed data are stored in the cache directory on the server side for fast response. The data flow diagram Fig. 4 illustrates the geospatial data processing flow and the relationships of data layers, processing services and CropScape’s client or other geospatial applications. The next several sub-sections will provide implementation details for functional diagram blocks depicted in Fig. 4.
or circle on the map view. A WFS GetFeature request with the specified FIPS code or ASD code (as shown in Table 1) is then submitted to the server to retrieve the boundary of the specified AOI in GML format, and the retrieved GML string will be drawn and highlighted in the map view on the browser client. The coordinates of the userdefined AOI like rectangle, polygon, or circle are transferred to the server side and stored in a GML file for sub-setting and rasterizing.
2.4.1. Functionalities implemented with OGC Web services 2.4.1.1. CDL map service. OGC Web geospatial data services like WCS, WFS, and WMS provide open access to CDL data and other geospatial data on the CropScape server without storing them locally. CDL data are served by the standard OGC WMS and WCS services using MapServer. Other geospatial applications like ArcGIS Explorer can access the CDL layers along with the associated legend from CropScape and add them as map layers by sending standard WMS requests to the CropScape application server. The detailed information on the selected county or other AOI can be obtained by sending a WMS GetFeatureInfo request to the server. An example of WMS GetMap request is illustrated in Table 1. Similarly, CDL data can be discovered, described, and retrieved with the standard WCS request. Table 1 demonstrates a WCS GetCoverage request example that obtains the interested CDL data within the specified bounding box. The feature data such as state and county boundary layers are served using the WFS and WMS services. The client sends the WFS GetFeature request to the server to retrieve the feature data as shown in Table 1. Overall, these standard OGC Web services greatly facilitate CDL data discovery, access, retrieval, visualization, and dissemination, and promote its uses in various applications.
2.4.2. Functionalities implemented with Web geoprocessing services Web geoprocessing services were specifically developed for CropScape as complements to the OGC Web services. These Web geoprocessing services, GetCDLFile, GetCDLValue, GetCDLImage, ExtractCDLByValues, GetCDLStat, and GetCDLComp, were specially developed to fulfill functionalities such as pixel level information query, CDL image data dissemination, selecting crops for extraction and mapping, crop acreage statistics calculation, and cropland change analysis. These open and standard Web services support HTTP GET and POST requests with Key–value Pair (KVP) and Simple Object Access Protocol (SOAP) binding. They can be discovered and described in Web Service Definition Language (WSDL), a XML based language, at http://nassgeodata.gmu.edu:8080/axis2/services/CDLService?wsdl. The following subsections describe the details of these Web geoprocessing services.
2.4.1.2. AOI definition. Change analysis and statistics calculations for CDL data for a given AOI are extremely useful for many CDL data users. The AOI can be defined by specifying a state, ASD or county from the dropdown list, or by drawing a polygon, rectangle
2.4.2.1. Information query. Interactive information query capabilities are provided to query the crop category and feature information in CropScape. This function help users find exactly what crops were grown and their geographic location in a selected crop year. The feature information, county name, state name, FIPS code, total crop acreage, and total irrigated crop acreage, can be retrieved via WMS GetFeatureInfo request as shown in Table 1. The crop type information such as category name, category value, and color can be extracted with a GetCDLValue request as shown in Table 2: At the client side, query results are displayed in a popup balloon window when clicking a location of interest in the map view. As
W. Han et al. / Computers and Electronics in Agriculture 84 (2012) 111–123
117
Table 1 WMS, WFS, and WCS request examples. Web service
Operation
Request example
WMS
GetMap
http://gis.csiss.gmu.edu/cgi-bin/wms_cdlall?service=wms&version=1.1.1&request=getmap &layers=cdl_2010new&srs=epsg:4326&bbox=-96,40,-90,43&width=800&height=400&format=image/png
WCS
GetCoverage http://gis.csiss.gmu.edu/cgi-bin/ cdl_services?service=wcs&version=1.0.0&request=getcoverage&coverage=cdl_2009&crs=epsg: 102004&bbox=130783,2203171,153923,2217961&resx=30&resy=30&format=gtiff
WFS
GetFeature
http://gis.csiss.gmu.edu/cgi-bin/ wms_conustiger?service=wfs&version=1.0.0&request=GetFeature&typename=conus_counties_d&filter =FIPS17195&outputformat=GML2
Table 2 CDL Web services request examples. Service
Parameters
HTTP GET request example
GetCDLValue
Year and location
http://nassgeodata.gmu.edu:8080/axis2/services/CDLService/GetCDLValue?year=2010&x=1551459&y=1909201
ExtractCDLByValues
File URL and values
http://nassgeodata.gmu.edu:8080/axis2/services/CDLService/ExtractCDLByValues?file=http://nassgeodata.gmu.edu/ nass_data_cache/byfips/CDL_2010_19169.tif&values=2,5
GetCDLStat
Year and FIPS code Year and bounding box
http://nassgeodata.gmu.edu:8080/axis2/services/CDLService/GetCDLStat?year=2010&fips=19015&format=txt
Years and FIPS code Years and bounding box Years and points
http://nassgeodata.gmu.edu:8080/axis2/services/CDLService/GetCDLComp?year1=2008&year2=2009&fips=19015&format=CSV
File URL and PNG format File URL and KML format
http://nassgeodata.gmu.edu:8080/axis2/services/CDLService/GetCDLImage?files=http://nassgeodata.gmu.edu/nass_data_cache/ byfips/CDL_2010_19169.tif&format=png
Year and FIPS code Year and bounding box
http://nassgeodata.gmu.edu:8080/axis2/services/CDLService/GetCDLFile?year=2009&fips=19015
GetCDLComp
GetCDLImage
GetCDLFile
http://nassgeodata.gmu.edu:8080/axis2/services/CDLService/ GetCDLStat?year=2010&bbox=130783,2203171,153923,2217961&format=JSON
http://nassgeodata.gmu.edu:8080/axis2/services/CDLService/ GetCDLComp?year1=2008&year2=2009&bbox=130783,2203171,153923,2217961&format=JSON http://nassgeodata.gmu.edu:8080/axis2/services/CDLService/ GetCDLComp?year1=2008&year2=2009&points=175207,2219600,175207,2235525,213693,2235525,213693,2219600&format=CSV
http:/nassgeodata.gmu.edu:8080/axis2/services/CDLService/GetCDLImage?files=http://nassgeodata.gmu.edu/nass_data_cache/ byfips/CDL_2010_19169.tif&format=kml
http://nassgeodata.gmu.edu:8080/axis2/services/CDLService/GetCDLFile?year=2009&bbox=130783,2203171,153923,2217961
shown in Fig. 5, the table in the balloon window illustrates the county level agricultural census information of a total of 305,090 acres of cropland and 51,158 acres of irrigated cropland in Cuming County, Nebraska in 2007.
2.4.2.2. Land cover acreage statistics. Land cover acreage statistics provides estimated acreage for a defined AOI for a given year based on pixel counts and pixel size. To capture the geographic location of different crop types and generate the estimated crop acreage is an important decision support function. CDL data for a given year for a given AOI is first identified, and the acreage of land cover category within the AOI is then estimated by counting the pixels in each category and changing the pixel areas to acres using a conversion factor. The statistical information is returned in JSON format to the CropScape client for display in table, pie or bar chart formats, and for exporting to CSV format. The resultant table can be sorted by pixel value, category, pixel counts, or acreage. The bar and pie charts make the statistical data more visually informative and interesting.
Through the ExtractCDLByValues service call, as shown in Table 2, the selected crop type(s) from the table can be previewed and exported in GeoTiff format for future uses in other geospatial software. Fig. 6 shows a table of statistical results of Lee County, Iowa. The GetCDLStat service is developed to provide service for Web requests from other applications. Requests with the crop year and FIPS code or bounding box coordinates (as shown in Table 2) are processed on the server side, and statistical information (for example, value, category name, and acreage) is returned in JSON, plain text or CSV format.
2.4.2.3. Change analysis. The objective of GetCDLComp service is to analyze land cover changes by comparing CDL data in two different years. As shown in Table 2, the differences of the land cover (as characterized by CDL data) between two selected years can be obtained. For any given two years with different spatial resolutions, the defined CDL AOI with higher resolution is resampled using the nearest neighborhood interpolation method to the same resolution as the one with lower resolution.
118
W. Han et al. / Computers and Electronics in Agriculture 84 (2012) 111–123
Fig. 5. County information display.
Fig. 6. Statistical information of CDL within AOI.
The comparison results including category change, pixel counts, and estimated acreage are returned in JSON format for display in the table. Similarly, the results can be exported into CSV format, and previewed in the image and exported as a GeoTiff. In addition, the selected change in the comparison results table can be previewed and exported. As seen in Fig. 7, the cropland changes from
soybeans in 2008 to corn in 2009 and their extent and distribution are captured. 2.4.2.4. CDL data download and export. CropScape offers different options for CDL data download to address the special needs of different users. Those who are interested in CDL data for all states can
W. Han et al. / Computers and Electronics in Agriculture 84 (2012) 111–123
119
Fig. 7. Specified change preview (from soybeans to corn).
specify a specific crop year only and download the corresponding compressed file at the CropScape client, or download the compressed CDL data file directly by accessing the file link (e.g. http://nassgeodata.gmu.edu/nass_data_cache/tar/2010_cdls.tar.gz) via browser or ftp software. Those who want CDL data for a given AOI can specify the available crop years for an AOI, the preferred projection, and whether to compress the output file, and then submit their requests. The output CDL file can be previewed interactively, downloaded in GeoTiff format for analysis in other software or exported in a KML file. Google Earth will automatically be invoked if an open option is selected in the exporting process as shown in Fig. 8. Legends for crop categories are also injected into the KML file for interpreting crop type and spatial patterns of crops in Google Earth. The GetCDLImage service can be invoked in other applications to obtain the preview image or the KML file by sending the requests as seen in Table 2. For those users who want to use CDL data in their applications or work flow directly, the GetCDLFile service is implemented in CropScape for requesting CDL data. HTTP GET requests with crop year and FIPS code or bounding box coordinates (as indicated in Table 2) are processed on the server side. When receiving the request with year and FIPS or ASD code, the GetCDLFile service submits a GetFeature request internally with this code filter to the WFS service. The GML file returned is kept in a specified directory on the server side. When handling requests with year and bounding box, the bounding box coordinates are also stored in a GML file.
These GML files are to be used in the process of sub-setting and rasterizing CDL data for the given year. The URL of the output file will be returned for downloading and future use in XML. These CDL data dissemination options offered in CropScape greatly facilitate CDL data application in the agricultural community. 3. Results The implemented CropScape was officially released on January 10, 2011. It provides a user-friendly web browser-based client side interface with effective online geospatial capabilities of CDL data access, navigation, query, visualization, analysis and dissemination. Moreover, its standard Web services extend the reach of CDL data and CropScape functional services. These web services and browser-based online capabilities have been widely utilized by many users in their geospatial applications, and provided fast and useful agricultural information for decision support. In the next two subsections, two CropScape applications are illustrated. 3.1. CDL data mash-up via Web service Many CDL users have utilized CDL WMS services and KML files from CropScape to mash-up CDL data with their own online base maps or local geospatial data and integrate the Web services of CropScape with their own Web applications to create and share the customized maps, and exploit the valuable information.
120
W. Han et al. / Computers and Electronics in Agriculture 84 (2012) 111–123
Fig. 8. Display in Google Earth.
Fig. 9. The inundated area (delineated AOI) and its acreage statistics in Mississippi County, Missouri in 2010 CDL using CropScape.
One such example application is the Bioenergy Knowledge Discovery Framework (KDF, https://bioenergykdf.net/) funded by US
Department of Energy. KDF aims to build a collective knowledge system to visualize and analyze vast amounts of information and
W. Han et al. / Computers and Electronics in Agriculture 84 (2012) 111–123
support the bioenergy industry. Shortly after CropScape launched, KDF started to utilize CropScape’s WMS services to serve CDL data. KDF has registered the CDL WMS service as one of land cover and cropland data sources in its data library. CDL data can be discovered, selected, and displayed as one important supporting dataset in the KDF online system. The layer of Renewable Fuels Association (RFA) Biorefinery Locations (Renewable Fuels Association, 2011) and 2010 Cropland Data Layer are added together in KDF to display the spatial distribution of biorefineries and crops in the Midwestern United States (Midwest). Most of these biorefineries are cornbased. The Midwest is the major corn growing region in the US, and provides a large and constant supply of corn biomass. CropScape provides the detailed spatial distributions of specific bioenergy crops along with their location across the US and can be leveraged for energy security decision support (e.g. biorefinery site selection). The standard Web services developed in CropScape extend the reach of CDL data. These services have been widely utilized by many users in their geospatial applications, and provided the fast and useful agricultural information for decision support. 3.2. CDL data application via CropScape A practical CropScape application example used CDL data within CropScape for the 2011 Mississippi River flood disaster assessments. In early May 2011, the US Army Corps of Engineers proposed to explode a large section of a Mississippi River levee near the town of Wyatt, Missouri, the so called the Bird’s PointNew Madrid floodway in order to reduce the threat of major flooding from the swollen Mississippi and Ohio Rivers in nearby Cairo,
121
Illinois. The blasts would likely unleash a muddy torrent of water into farmland and around evacuated homes in Mississippi County, Missouri. However, the loss caused by farmland and homes inundated was one of the most critical decision support factors whether or not to support such a proposal. Therefore, the acres of prime Missouri farmland that might be flooded and the number of homes that would be destroyed had to be predicted to properly estimate the potential loss. Missouri Congresswoman Joann Emerson also requested the Food and Agricultural Policy Research Institute, University of Missouri, to provide an after-the-fact assessment of the potential crop loss value from the Bird’s Point Levee breach on May 2, 2011 (Brown et al., 2011). This information proved critical for further disaster relief decision making and operational efforts. In the assessment, NASS data and tools, most prominently CropScape and CDL data were utilized. Both analysts at the NASS Missouri Field Office and researchers at the University of Missouri used CropScape to assess the cropland loss caused by flood inundation. As shown in Fig. 9, the 2010 CDL was selected for assessment and the AOI polygon function was used to define the predicted to be (or already) inundated cropland area as the area of interest in Missouri’s Mississippi County. Fig. 10 illustrates the actual May 2011 flood in Mississippi County, Missouri. Fig. 10(a) shows the May 7, 2010 Landsat image which depicts no flooding while Fig. 10(b) May 10, 2011 image illustrates flood inundation in Mississippi County after the levee was breached. As shown in Fig. 10, the inundated area after levee breach is consistent, in most locations, with the predicted area as shown in Fig. 9. With the area of interest defined, the statistics function was then invoked to estimate acreages of all crops grown in the inun-
Fig. 10. May 2011 flood in Mississippi County, Missouri. (a) May 7, 2010 LandSat image shows no flood; (b) May 10, 2011 LandSat image illustrates flood inundation in Mississippi County after levee breach.
122
W. Han et al. / Computers and Electronics in Agriculture 84 (2012) 111–123
dated area of interest in 2010 based on pixel counting. The estimated crop acreage results were summarized as shown in Fig. 9. The value of the previous year’s crops that were in the inundated area could be estimated by applying the 2010 season average prices to the AOI-defined inundated area. In this assessment, it was assumed that all soybean and corn fields were completely rotated, that is to say, every acre of corn was planted to soybeans and every acre of soybeans was planted to corn. The projected current year crop acreage could then be deduced from last year’s results with this assumption. The number of acres that had already been planted and the number of acres that would not be planted could be estimated by using the current year Crop Progress and Condition survey data. Assuming 2011 season average crop prices remain at the same level as 2010, the value of crops in the inundated area defined by the AOI could ultimately be determined. The estimated loss of crop value provided a solid foundation for flood disaster mitigation and decision support analysis. This case study manifests that CropScape is an effective decision support tool that can help decision makers efficiently access, retrieve, and analyze critical crop acreage information and make knowledgeable science-based decisions.
4. Discussion CropScape has provided considerable public service to the US agricultural and scientific communities since its official release on January 10, 2011. By May 10, 2011, over seventeen thousand users have visited the website from federal, state, and local governments, companies, academic institutions, and non-profit organizations in just five months. Over 200 GB of CDL data was downloaded in multiple ways by users each month. CropScape delivers, for the first time, online geospatial CDL data access, navigation, query, visualization, and analysis using interactive maps in the public domain. Moreover, this application offers various Web services for users to discover, access, invoke, integrate, and execute remotely. The standards-based geospatial Web services enable automated delivery of custom CDL products to our customers. Users can reuse, integrate, and execute CropScape Web services with distributed geospatial web services from different sources. The capability of exporting CDL data directly to popular Google Earth enriches spectrum of users’ geospatial toolboxes. CropScape not only greatly saves the expense of printing and shipping media and facilitates low carbon geospatial cropland information delivery for decision support, but also significantly improves the efficiency and effectiveness for agricultural related decision support. CropScape’s capability of generating standard State and county cropland maps and exporting maps to pdf files great reduces NASS staff’s burden of map production and help NASS transition into an electronic-map era. CropScape’s various data visualization and geospatial data query tools provide users with easy, capable, and useful online functionality for data visualization and geospatial query without special geospatial software installation nor any geospatial information system skills and experience required. The overall performance of CropScape is fine-tuned though it is primarily dependent on the internet speed and traffic. CropScape’s performance can be further improved by moving it to a more powerful server cluster or moving it to Cloud computing platform. In the future, more CropScape capability enhancements are needed to meet different customers’ requirements. The capabilities of adding customer’s data layer(s) at the client side, measuring length and area, adding map notes with multiple shapes and information inputting, supporting WMS layers from other providers, and controlling data layer display order will be developed in CropScape to enrich its functions and provide better decision support to users.
5. Conclusions This paper presents an overview of the architecture and design of CropScape, a service-oriented Web application providing geospatial data and analytic services to users. The CropScape application proves that state-of-the-art geospatial information technologies are effective and efficient in enhancing open access to, visualization of, online analysis of, and dissemination of agricultural geospatial information. The OGC standards compliant design makes CropScape open and interoperable with third party applications, thereby increases utility of the CDL data and interactivity with outside applications. The CropScape application case studies demonstrate that the CropScape Web application system facilitates greater utilization of agricultural geospatial information for agricultural business and emergency response decision support. The performance of CropScape is acceptable even though the huge volume of raster format CDL data and boundary data layers are served over internet. Acknowledgements The authors would like to thank Mr. Thomas C. Sallee for providing the Missouri flood example, and Mr. David Johnson for preparing the Missouri flood images. The authors also would like to thank graduate research assistants, Ms. Chuming Peng and Mr. Ali L. Yagci, for their help in making the demo video and processing vector data for the CropScape website, Drs. Wenli Yang, Meixia Deng, and Peisheng Zhao for their sound advice, and Dr. Barry Schlesinger for proofreading this manuscript. George Mason University’s participation in this project was supported by a Grant from USDA, NASS (Grant #: 58-3AEU-0-0067, PI: Prof. Liping Di). The authors appreciate the efforts of the two anonymous reviewers and their useful comments and suggestions. References ArcGIS Explorer Desktop, 2011. Environmental Systems Research Institute. Available from: , (accessed 12 April, 2011). Bacic, I.L.Z., Bregt, A.K., Rossiter, D.G., 2006. A participatory approach for integrating risk assessment into rural decision-making: a case study in Santa Catarina, Brazil. Agricultural Systems 87 (2), 229–244. Boryan, C., Yang, Z., Mueller, R., Craig, M., 2011. Monitoring US agriculture: the US Department of Agriculture, National Agricultural Statistics Service. Cropland Data Layer Program. Geocarto International 26 (5), 341–358. Brown, S., Gerlt, S., Wilcox, L., 2011. The Value of the 2011 Crop Production Loss from the Birds Point-New Madrid Floodway Levee Breach. FAPRI-MU Report #06-11, Food and Agricultural Policy Research Institute, University of Missouri, USA, 6pp. Castelein, W., de Bruin, S., 2007. Transaction costs for assessment of geoinformation applications in agri-environmental policy. In: Processing of the 10th AGILE International Conference on Geographic Information Science, Aalborg, Denmark, pp. 1–8. Clarke, K.C., 1997. Getting Started with Geographic Information Systems. Prentice Hall, Upper Saddle River, NJ, 353 pp. de la Beaujardière, J. (Ed.), 2006. OpenGIS Web Map Server Implementation Specification (OGC 06-042, Version 1.3.0). Open Geospatial Consortium Inc., USA, 85pp. Available from: , (accessed 23 March 2011). DeMers, M.N., 1997. Fundamentals of Geographic Information Systems. Wiley, New York, NY, 486 pp. Fernandez, C.J., Neal, T.T., 2007. Development of a web-based decision support system for crop managers: structural considerations and implementation case. Agronomy Journal 99 (3), 730–737. Granell, C., Díaz, D., Gould, M., 2010. Service-oriented applications for environmental models: reusable geospatial services. Environmental Modelling and Software 25 (2), 182–198. Han, W., Di, L., Zhao, P., Li, X., 2009. Using Ajax for desktop-like geospatial web application development. In: Processing of the 17th International Conference on Geoinformatics, Fairfax, USA, pp. 1–5 (on CDROM). Han, W., Di, L., Zhao, P., Li, X., 2011. GeoBrain online analysis system: an SOA-based geospatial Web portal. In: Zhao, P., Di, L. (Eds.), Geospatial Web Services: Advances in Information Interoperability. Information Science Reference, Hershey, pp. 455–474.
W. Han et al. / Computers and Electronics in Agriculture 84 (2012) 111–123 Iosifescu-Enescu, I., Hugentobler, M., Hurni, L., 2010. Web cartography with open standards – a solution to cartographic challenges of environmental management. Environmental Modelling & Software 25 (9), 988– 999. Jensen, J.R., 2004. Introductory Digital Image Processing: A Remote Sensing Perspective, third ed. Prentice Hall, Upper Saddle River, NJ. Keil, M., Beranek, P.M., Konsynski, B.R., 1995. Usefulness and ease of use: field study evidence regarding task considerations. Decision Support System 13 (1), 5–91. Kropla, B., 2005. Beginning MapServer: Open Source GIS Development. Apress, Berkley, CA, 448 pp. Kutz, F., Morgan III, J., Monn, J., Petrey, C., 2012. Geospatial approaches to characterizing agriculture in the Chincoteague Bay Subbasin. Environmental Monitoring and Assessment 184 (2), 679–692. Lawton, G., 2008. New ways to build rich internet applications. Computer 41 (8), 10–12. Liknes, G.C., Nelson, M. D., Gormanson, D. D., Hansen, M., 2006. The utility of the cropland data layer for forest inventory and analysis. In: Processing of the 8th Annual Forest Inventory and Analysis Symposium, Washington DC, USA, pp. 259–264. Lynch, T., Gregor, S., Midmore, D., 2000. Intelligent support systems in agriculture: how can we do better? Australian Journal of Experimental Agriculture 40 (4), 609–620. Maxwell, S.K., Jaymie, R.M., Pierre, G., 2010. Use of land surface remotely sensed satellite and airborne data for environmental exposure assessment in cancer research. Journal of Exposure Science and Environmental Epidemiology 20, 176–185. Muller, S., Copenhaver, K., Wander, M., 2008. The global warming and land use impact of corn ethanol produced at the Illinois River Energy Center, University of Illinois at Chicago. Available from: , (accessed 23 March 2011). NASS, 2011. USDA NASS, Research and Development Division, Spatial Analysis Research Section. Available from: , (accessed 25 August, 2011). NRCS, 2011. US Department of Agriculture, National Resources Conservation Service, Geospatial Data Gateway. Available from: , (accessed July 16, 2011). OpenLayers, 2011. Free maps for the Web, OpenLayers. Available from: , (accessed 12 May, 2011).
123
POSTEL, 2008. First global land cover map at 300m resolution available, 2008. POSTEL. Available from: , (accessed 02 April, 2011). Renewable Fuels Association. Biorefinery Locations. Available from: , (accessed 02 May, 2011). Sencha, 2011. ExtJS 4 JavaScript framework for rich apps in every browser. Available from: , (accessed 12 May, 2011). Shao, Y., Lunetta, R.S., Ediriwickrema, J., Iiames, J.S., 2010. Mapping cropland and major crop types across the Great Lakes Basin using MODIS-NDVI data. Photogrammetric Engineering and Remote Sensing 75 (1), 73–84. Shore, F.L., Gregory, T.L., 2010. The Cropland Data Layer for the study of Mississippi forests. In: Proceedings of the 2010 Association of American Geographers Annual Meeting, Washington DC, USA. Shore, F.L., Gregory, T.L., Mueller, R., 2006. GIS applications for the Mississippi Cropland Data Layer, 1999–2006. In: Proceedings of the 2006 American Society for Photogrammetry and Remote Sensing Annual Conference, Reno, NV, USA, pp. 1–13. (on CDROM). Sun, W., Liang, S., Xu, G., Fang, H., Dickinson, R., 2008. Mapping plant functional types from MODIS data using multisource evidential reasoning. Remote Sensing of Environment 112, 1010–1024. US Census Bureau, 2010. TIGER/LineÒ Shapefiles. Available from: , (accessed 02 April, 2011). USDA NASS, 2007. Census of Agriculture. Available from: , (accessed July 16, 2011). Vretanos, P.A. (Ed.), 2005. OpenGIS Web Feature Service Implementation Specification (OGC 04-094, Version 1.1.0). Open Geospatial Consortium Inc., USA, 131pp. Available from: , (accessed 23 March 2011). Wang, C., Fritschi, F.B., Stacey, G., Yang, Z., 2011. Phenology-based assessment of perennial energy crops in North American tallgrass prairie. Annals of the Association of American Geographers 10 (4), 742–751. Whiteside, A., Evans, J.D., (Eds.), 2008. OpenGIS Web Coverage Service (WCS) Implementation Standard (OGC 07-067r5, Version 1.1.2). Open Geospatial Consortium Inc., USA, 133pp. Available from: , (accessed 23 March 2011). West, T.O., Brandt, G.S., Baskaran, L.M., Hellwinckel, C.M., Mueller, R., Bernacchi, C.J., Bandaru, V., Yang, B., Wilson, B.S., Maryland, G., Nelson, R., De La Terre Ugarte, D.G., Post, W.M., 2010. Cropland carbon fluxes in the United States: increasing geospatial resolution of inventory-based carbon accounting. Ecological Applications 20 (4), 1074–1086.