Cross-Architecture Performance Predictions for Scientific Applications Using Parameterized Models Gabriel Marin
[email protected]
John Mellor-Crummey
[email protected]
Department of Computer Science Rice University Houston, TX 77005
ABSTRACT This paper describes a toolkit for semi-automatically measuring and modeling static and dynamic characteristics of applications in an architecture-neutral fashion. For predictable applications, models of dynamic characteristics have a convex and differentiable profile. Our toolkit operates on application binaries and succeeds in modeling key application characteristics that determine program performance. We use these characterizations to explore the interactions between an application and a target architecture. We apply our toolkit to SPARC binaries to develop architectureneutral models of computation and memory access patterns of the ASCI Sweep3D and the NAS SP, BT and LU benchmarks. From our models, we predict the L1, L2 and TLB cache miss counts as well as the overall execution time of these applications on an Origin 2000 system. We evaluate our predictions by comparing them against measurements collected using hardware performance counters.
Categories and Subject Descriptors D.2.8 [Software Engineering]: Metrics—complexity measures, performance measures
General Terms Algorithms, Measurement, Performance
Keywords Performance Analysis, Modeling, Prediction
1.
INTRODUCTION
Modeling the characteristics and performance of applications in an automatic way has been a long-standing goal of computer science research. Accurate models of program execution characteristics have many uses. Understanding
Permission to make digital or hard copies of all or part of this work for personal or classroom use is granted without fee provided that copies are not made or distributed for profit or commercial advantage and that copies bear this notice and the full citation on the first page. To copy otherwise, to republish, to post on servers or to redistribute to lists, requires prior specific permission and/or a fee. SIGMETRICS/Performance’04, June 12–16, 2004, New York, NY, USA. Copyright 2004 ACM 1-58113-664-1/04/0006 ...$5.00.
how an application’s performance will scale given different problem sizes and predicting how it will perform on proposed future architectures are two particularly important problems. Building accurate performance models for sequential or parallel applications is difficult. Simple metrics, such as the number of floating-point operations executed, provide little indication of a code’s performance. Scientific applications rarely approach peak performance on microprocessor-based systems; memory hierarchy bandwidth and latency are significant limiting factors. Also, an application’s instruction mix can dramatically affect performance. Today’s superscalar processors can execute multiple instructions in parallel if they are provided with the right mix of instructions. For parallel programs, communication frequency, communication bandwidth and serialization complicate the situation further. While architecture simulators can provide detailed information about a program’s behavior on a particular input, to understand how a program’s behavior will scale as data and system vary, scientists typically manually construct analytical models of an application’s performance [9, 17]. Although this approach can produce highly accurate models, constructing such models is enormously labor intensive and requires a thorough understanding of the algorithms used, as well as their implementation. Our research is based upon the belief that it should be possible to characterize the performance of sequential and parallel applications in a semi-automatic way with a reasonable accuracy. In this paper we describe our work on modeling the characteristics of sequential codes and predicting their execution behavior on different architectures. Building parameterized performance models of an application is difficult because of the large number of variables that affect performance, including architecture-dependent factors, algorithm choices, and input data parameters. Moreover, these factors interact in complex ways, yielding a performance function that is non-convex and non-smooth in this multivariate parameter space. This paper presents a strategy for separating the contribution of application-specific factors from the contribution of architectural characteristics to overall application performance. It describes a methodology for constructing models of an application’s characteristics parameterized by problem size or other input parameter. The benefits of this approach are twofold. First, modeling application-specific factors in isolation yields architecture-neutral models that
can predict execution characteristics on different platforms. Second, models that describe the algorithmic and application choices are typically monotonic polynomial functions; in general, models based on measurements on a particular architecture are not. The goal of this research is to produce tools that are useful to application writers for predicting the performance and scalability of algorithms, and to architecture designers for understanding the impact of design alternatives. We synthesize models to predict the behavioral characteristics and execution time of applications by using a combination of static and dynamic analysis of application binaries, as we explain in the following sections. By operating on application binaries instead of program source code, we are able to build language-independent tools that can naturally analyze applications with modules written in different languages or linked with third party libraries. To accurately predict performance, it is easier to analyze a mix of machine instructions with a predictable latency than to estimate the execution cost for high-level language constructs. The rest of this paper is organized as follows. Section 2 describes in more detail the design and the implementation of our toolkit for analysis, modeling, and prediction of program performance. Section 3 presents and discusses the results of using our toolkit to predict performance for several applications. Section 4 describes the most closely related work. Section 5 presents our conclusions and plans for future work.
2.
TOOLKIT DESCRIPTION
Our performance modeling toolkit, depicted in Figure 1, is a collection of programs and scripts designed to support construction of architecture neutral, parameterized models for predicting application behavior and performance. The three
Figure 1: Toolkit architecture overview. principal functions of toolkit components are (1) static analysis of application binaries, (2) instrumentation of binaries along with run-time measurement and analysis to characterize application behavior, and (3) synthesis of detailed, architecture-neutral, parameterized models of application behavior and performance by combining static information with dynamic measurements and a description of a target machine’s resources. In the following sections, we describe each of these capabilities in turn. The toolkit’s binary analysis capabilities are built upon the Executable Editing Library (EEL) [11], which supports
analysis and instrumentation of SPARC binaries. The focus on SPARC binaries is not a significant limitation since our toolkit uses them to construct architecture-neutral models for predicting application behavior and performance on arbitrary RISC-like architectures by convolving these models with a description of the resources of a target machine.
2.1 Static Analysis The static analysis subsystem shown in Figure 1 is not a standalone application but rather a component of every program in our toolkit. The toolkit employs static analysis to reconstruct the control flow graph (CFG) for each routine, identify the natural loops in each CFG using interval analysis [18], and determine loop nesting. It also uses static analysis to recover application characteristics such as the instruction mix in basic blocks or loop bodies, and identify schedule dependencies between instructions. There are two types of schedule dependencies between instructions: register dependencies (one instruction uses a register computed by another) and memory dependencies (two memory operations access the same location and at least one of them is a write). Register dependencies are easily identified. We perform register renaming at basic block boundaries to ensure that each register definition has a unique name. Following renaming, all register dependencies between instructions are readily apparent as a def and subsequent uses of the same register. Determining memory dependences accurately from machine code is a difficult problem and is the subject of the remainder of this section. On modern microprocessors, the location referenced by a memory instruction is first computed into a register by a series of integer arithmetic instructions. Disentangling these computations can be difficult because optimizing compilers often store in registers not only the starting address of a data structure, but addresses of particular fields as well. Also, multiple base registers used in a basic block may contain related addresses. To determine if two memory instructions access the same location, we derive a formula indicating the location that each instruction will access. For each memory instruction inside loops, we compute a formula describing how the referenced location changes between iterations. To compute an access formula, we traverse CFG edges backward from the target memory reference. Each formula is restricted to sums of general terms including values from constant addresses, values from the caller’s stack frame (an argument passed as reference), constant values, and registers whose formulas cannot be written as a sum of these terms (e.g. representing a multiply or divide of two nonconstant formulas, a value from a non constant address). A non-constant formula may also be multiplied by a constant. By subtracting the formulas corresponding to two memory references, we have three possible cases: 1. their difference is a non-zero constant: the references access different locations and are independent. 2. their difference is 0: the two references access the same location; there is a dependency between the instructions if at least one is a store. 3. the difference is in a non-constant formula: we cannot tell if the accesses are independent. A command line argument to the scheduler enables us to make optimistic or pessimistic assumptions about dependences.
2.2 Dynamic Analysis Often, many of the important characteristics of an application’s execution behavior, such as how it traverses data or how the amount of computation depends upon input parameters, can only be understood accurately by measuring them at run time. Our toolkit uses binary rewriting to augment an application to monitor and log information about various aspects of its execution behavior. To understand the nature and volume of computation performed by an application for a particular program input, we collect histograms indicating the frequency with which particular control flow graph edges are traversed at run time. To understand an application’s memory access patterns, we collect histograms of the reuse distance [4, 14, 7]—the number of unique memory locations accessed between a pair of accesses to a particular data item—observed by each load or store instruction. These measures quantify key characteristics of an application’s execution behavior upon which performance depends. By design, these measures are independent of any architectural details. We describe the approach for collecting each of these measures in turn.
2.2.1 Collecting Execution Frequency Histograms The goal of our dynamic monitoring of computation is to produce a histogram of executed basic blocks. However, we do not need to insert a counter into each basic block to measure its precise execution frequency. Knuth and Stevenson [10] prove that a necessary and sufficient condition for recovering edge and node execution frequency in a CFG execution is to add counters to a set of CFG edges so that each cycle in the undirected CFG has a counter on at least one edge. Ball noted [3] that a spanning tree of CFG edges has the maximum number of edges that do not contain a cycle. Building a spanning tree for the CFG and adding a counter to each edge not included monitors exactly one edge in each cycle—the minimum necessary. Since an undirected graph with cycles does not have a unique spanning tree, the problem of placing counters on CFG edges does not have a unique solution. The solution we desire is one with counters on a set of edges that execute as infrequently as possible to minimize the cost of runtime monitoring. To achieve this, we apply Kruskal’s algorithm [6] to construct a maximum-weight spanning tree (MST) of the CFG—an acyclic subset of edges with maximum total edge weight that connects all vertices—with edges weighted by their expected execution frequency [3]. Our scheme for estimating execution frequency is described later in this section. There are two remaining issues to address when adding counters: we want to count how many times a routine is entered and some of the edges in the CFG cannot be easily instrumented, so we must avoid placing counters on them. To address these issues, we exploit the property that counters are placed only on edges not in the spanning tree. When we construct the spanning tree, rather than starting with an empty set of tree edges, we initialize the set of tree edges to include the uninstrumentable edges and a virtual edge, ev , added between the CFG entry and exit nodes. Adding ev to the CFG ensures that there is at least one cycle. Adding ev to the initial set of spanning tree edges ensures that a counter will be placed on a real CFG edge to count routine frequency. In practice, the set of uninstrumentable edges will not include a cycle; otherwise, there would be no feasible counter placement to recover the counts needed.
B1
1
1
1
1
9 1
9
B2
9 1
9 B3
1
1
c2 B4
c1 B5
(a)
(b)
(c)
(d)
Figure 2: (a) Sample routine CFG; (b) Add a virtual edge from the EXIT node to the ENTRY node and estimate edges execution frequency; (c) Build the MST of the modified CFG; (d) Insert counters on edges that are not part of the MST. We use the following heuristic to estimate edge execution frequency, which we supply to the MST algorithm as edge weights: • the entry node in the CFG has a weight of one; • the weight of a vertex is divided equally among all its outgoing edges if none of these edges is a loop exit edge1 ; • each loop has a multiplicative factor equal to ten; • the weight of a node is the sum of the weights of its incoming edges. In addition to these four rules, a separate algorithm handles the loop exit edges and the nodes in which the exit edges originate. In most cases exit edges have their tail node in the program scope immediately outside the one that contains its head node. However, we have encountered cases in which an exit edge crosses several levels of a loop nest. To accommodate these cases, we apply the following algorithm to compute the estimated weight of an exit edge (ei ): 1. determine the outermost loop (L) for which this edge is an exit edge; 2. find the number (Nexit ) of edges that exit loop L; 3. the weight of ei is the weight of the loop L’s head divided by Nexit ; 4. all the other outgoing edges of the ei ’s head node receive an equal fraction of the remainder weight of that node, after the newly computed weight of ei is subtracted. The final step consists of placing counters on the edges that are not part of the maximum spanning tree. Figure 2 presents a sample CFG with one loop and the steps that must be performed to determine the optimal insertion place for the counters. We count only the edges existent in the original CFG. From Figure 2(d) we can recover the execution frequency for all the blocks and edges in the CFG. B1 = B3 = B5 = c1; B4 = c2; B2 = c1 + c2 1 A loop exit edge has its head node as part of a loop and its tail node outside the loop.
2.2.2 Monitoring Memory Access Behavior During execution, we characterize the memory access behavior of an application by monitoring the memory reuse distance seen by each reference. Characterizing memory access behavior in this way for programs has two important advantages. First, data reuse distance is independent of cache configuration or architecture details. Second, reuse distance is a scalable measure of data reuse which is the main determinant in cache performance. For a fully-associative cache, one can predict if a memory access is a hit or a miss by comparing its reuse distance with the cache size (see Figure 3). Beyls and D’Hollander [5] show that reuse distance predicts the number of cache misses accurately even for caches with a low associativity level or direct mapped caches. However, reuse distance alone cannot predict conflict misses. L1 size L1 Hits
L2 size L2 Hits
Number of References
Reuse Distance
Figure 3: Example of reuse distance histogram. All references with reuse distance less than the cache size are hits. We collect reuse distance information separately for each reference in the program2 . Before each memory reference we invoke a library routine that updates a histogram of reuse distance values (see Figure 3) for the reference. In addition to the address of the reference, the event handler needs to know the address of the memory location referenced and the number of bytes touched by this instruction. Our implementation of the event handler collects a complete histogram of the reuse distances seen by each memory reference. To compress the volume of output data, we coalesce each reference’s histogram bins with similar distances before the data is written out. Our compression scheme has no noticeable effect upon the precision of our reuse distance models, but the reduction in space is often significant. To monitor reuse distance, an event handler routine increments a logical clock by one each time a memory instruction is executed. A hash table is used to associate the logical time of last access with every memory block referenced by the program. The timestamp enables us to determine the reuse distance between a pair of accesses to the same datum. Alone, this data structure is only sufficient to count how many memory operations were executed since the last access to the same datum. To determine the number of distinct memory locations accessed between accesses to a particular datum, we use a balanced binary tree with a node for each memory block referenced by the program. The sorting key for each node in the tree is the logical time of the last access to the memory location the node represents. By using a unit size memory block, we can collect pure temporal reuse distance information. However, using this 2 Late in section 2.3.2, we explain that we actually collect histograms for reference groups to improve modeling accuracy. Until that point, for simplicity we describe the process here as if each reference is handled separately.
approach, we fail to observe spatial reuse in cache lines. By setting the memory block to a non-unit cache line size, we can also measure spatial reuse because we collect the reuse distance of data blocks rather than data elements. To correctly account for spatial locality, we need to use a memory block size equal to the size of the cache line on the target architecture. Currently, to predict the performance of an application on arbitrary systems, we need to collect reuse distance data for all cache line sizes that might be encountered in practice. The most common cache line sizes in use today are 32, 64 and 128 bytes. Because of the reuse distance data’s dependence on cache line size, our characterizations of application behavior are almost architecture independent, instead of totally independent. The size of the memory block our runtime library uses is defined by an environment variable; therefore collecting data for different cache line sizes does not require re-instrumenting the code or re-compiling the event handler routine. Our implementation of the event handler executes the following pseudo-code for a memory access to the location addri , which refers to the memory block bi , by the program instruction instk : equal to the value of the step 1 Set a logical timestamp tnew i global timestamp counter and increment the counter. step 2 Search the hash table for the memory block bi (complexity O(1)). If bi is not found, then this is the first access to block bi ; increment the number of cold misses ) seen by instk , insert a new entry (key=bi , value=tnew i into the hash table (all operations O(1)), and go to step 5. If bi is found in the hash table, then block bi was accessed before; go to the next step. correspond to the previous acstep 3 Let timestamp tlast i cess to bi , update the hash table entry for block bi with . the current timestamp tnew i step 4 Delete the node with key tlast from the binary search i tree. While searching for the node with key tlast , we i count the number of nodes, B, with the key greater . Each node with key greater than tlast repthan tlast i i resents one distinct memory block that has been referenced since the previous access to bi . Each node of the tree maintains a field size representing the number of nodes in the sub-tree rooted at it. For a binary search tree with larger keys to the right, B is a sum of terms (nodej .size−nodej .lef tChild.size), for every nodej with key greater than tlast that is encountered i on the path from the root of the tree to the node to be deleted. The delete and count operations have an aggregate O(log N ) time complexity, where N is the number of distinct memory blocks touched by the application until that moment. Next, record that instk performed an access with reuse distance B. step 5 Insert a node with key tnew into the binary tree. i This step has complexity O(logN ). The time complexity for computing the reuse distance seen by one memory access is O(log N ). Overall, the overhead of collecting memory reuse distance information for the entire execution is O(M log N ), where M is the number of memory accesses the program executes, and the space required by the data structures for monitoring reuse distance
is O(N ). Time and space complexities are both significant even with these optimized data structures. The instrumentation infrastructure that we developed for collecting data about program behavior is quite flexible and can be easily adapted to collect other information or to perform different types of online analysis.
2.3 From Data to Parameterized Models Though the mechanics of data collection are somewhat complex, assimilating the collected data into accurate models of application behavior is a fundamentally more difficult undertaking. In this work, we aim to build parameterized models that enable us to predict application behavior and performance for data sizes that we have not measured. A program’s performance is a function of application characteristics and resources available on the target architecture. An architecture-neutral model considers only applicationspecific factors. The key application factors that influence the performance of a sequential execution are the number of instructions executed, the mix of instructions, the instruction schedule dependencies in the most frequent executed loops, and the memory access pattern exhibited by the application. To model a program’s behavior, we first collect data from multiple runs with different and determinable input parameters. To compute a curve parameterized by an input parameter, we use data from multiple runs in which that parameter is modified and all the others are maintained constant.
2.3.1 Building models of execution frequency To build models for the execution frequency of each edge counter parameterized by the problem size (or other suitable input parameter), we use quadratic programming [13] on the edge counter’s execution frequency data, collected from multiple runs with different problem sizes. We use a modeling strategy implemented in Matlab to determine the function that best approximates the input data we collected. The approximation function is written as a linear combination of a set of basis functions. The program uses either a default monomial base or a set of user-provided bases in symbolic form so that logarithmic or other non-linear contributions to the model can be considered. The modeling program computes the coefficients of the basis functions in the linear combination that closest approximates the collected data. We include restrictions to reduce or remove oscillations of the resulting fit and to ensure that the computed function is either convex or concave, depending upon the program characteristic that is modeled. Our approach works best with scientific codes that have predictable execution patterns, namely, ones that do not use adaptive algorithms. For such applications, we have computed accurate models of multiple parameters, although the process is somewhat more complex [12, pages 46–53]. For adaptive algorithms, we can produce an approximate model with reasonable accuracy in one parameter. The execution frequency measurements recorded by our toolkit are first processed by a filter program that can be configured to either output counter frequencies or the number of executed instructions. Command line arguments control the output in each case. For example, counters can be sorted either by location (grouped by routines) or by frequency with the most executed ones first. Optionally, the output can be pruned relative to a significance threshold.
Instructions are classified by type and can be aggregated at any level in the scope-tree of the program. We defined a set of generic RISC instruction classes and a module for translating native SPARC instructions into generic RISC instructions. The filter computes the number of executed instructions for each generic class and each basic block in the program. Using static analysis of the binary, the filter builds a scope-tree that reflects the program structure. There are three possible scopes that can be used to describe the program structure: • Program scope - the root of the tree; its children are routines; • Routine scope - the second level in the tree; its children are loops; • Loop scope - can include any other number of loops. If the binary contains source line mapping information, the routine and loop scopes are annotated with source file information, including the name of the source file and the range of line numbers corresponding to that scope in the source file. When loops have overlapping ranges of line numbers and the same parent in the scope-tree, the filter performs a normalization step that folds together information for the loops. Overlapping ranges are the result of compiler optimizations such as loop fission, software pipelining, loop-invariant code motion, or tiling. A model of dynamic instruction count can be accumulated at program level, routine level or individual loop level.
2.3.2 Building models of memory reuse distance The simplest possible model for a memory reference’s reuse distance would predict its average value for each problem size. However, such a model is almost always useless. Consider a reference performing stride one loads. Its first access to a cache line yields a long reuse distance; accesses to subsequent words yield short reuse distances. An average distance model can predict either all hits or all misses; neither prediction is accurate. To understand a reference’s access behavior for different problem sizes, we must predict its histogram of reuse distances for each problem size. A reuse-distance histogram for a reference contains a separate bin for each distinct distance encountered. Executions using different problem sizes result in histograms that each have a different number of bins and frequency counts; the varying number of bins complicates modeling. One possible approach for modeling is to divide histograms for all references and problem sizes into an identical number of bins, regardless of the distribution of the data. How many bins to consider has an important impact on the size and accuracy of the models. A small number of bins produces a compact model but lacks precision. A large number of bins improves accuracy, but adds unnecessary complexity and cost for many references that see only one or a few different reuse distances. To avoid this problem, we examine a reference’s collected data and pick an appropriate number of bins and their boundaries to adequately represent its histogram data across the range of problem sizes. Histogram bins are sorted by increasing distance; thus, the first bin corresponds to the smallest distance seen by a reference. We begin our analysis by examining the leading bins of a reference’s histogram for each problem size. If the
4 3.5 3 2.5 2 1.5 1 0.5 0 1
50 0.8
40 0.6
30 0.4
20 0.2
Normalized frequency
0
5
x 10 4
3
2
1
0 1
50 0.8
40 0.6
30 0.4
20 0.2
10 0
Memory reuse distance
5
x 10
Memory reuse distance
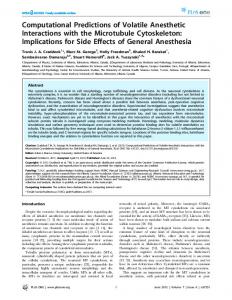
leading bins show a set of constant reuse distances across all problem sizes, they contain the fraction of accesses that have experienced spatial reuse in the innermost loop containing that reference. The values of the constants depend on the shape of the code in that loop, namely, how many other data structures are referenced before the next element of this data structure is accessed again. These small distances are constant across all problem sizes because the shape of the code is invariant across problem sizes. If a reference’s histograms have such bins with a small constant distance, we model them separately. Since their reuse distance is constant, we model only the frequencies in these bins. The fraction of accesses that have spatial reuse is usually not constant across all problem sizes. It is a concave curve that tends towards 1−ref erence stride/cache line size as problem size increases, and we are able to capture this behavior with our technique. The remaining bins and their parameters are determined using a recursive algorithm. We start by computing an average distance for all the references that were not modeled in the first step and we build a model for it. Next, we recursively split the set of accesses in two and compute a model for each subset. This process continues until the two resulting models are similar. We apply this algorithm to determine a partitioning of the data into an appropriate number of bins by considering the data for all problem sizes at once. At each step, we use a heuristic to determine how to partition the accesses. Its decisions influence the convergence speed, the accuracy and the stability of the final model. In our experiments, the partitioning heuristic that yielded the most stable and accurate results was one that selects partition boundaries so that the ratio between the number of references in the two partitions resulting from a split is the same across all problem sizes. The ratio is selected so that the two resulting subsets cover equal parts of the remaining range of reuse distances. The two subsets may contain a very different fraction of accesses, but they will span an approximately equal range of reuse distance. This speeds convergence by keeping together large fractions of accesses with similar reuse distance, yet only binning small fractions of accesses where the reuse distance varies abruptly. After partitioning, we perform a (rarely needed) coalescing step that examines adjacent bins and aggregates them together if they have similar polynomials describing their reuse distance. Each bin is modeled by two polynomials, one that models how the number of accesses in that bin changes with problem size and one that models how the average reuse distance of accesses in that bin changes with problem size. Our approach produces a minimal number of bins with almost no loss in accuracy. If a large fraction of accesses has the same reuse distance accross all problem sizes, all accesses go into one bin. However, if part of a reference’s histogram is composed of many small fractions of accesses with different reuse distance, our approach produces a large number of bins for that part of the histogram, and successfully captures the instruction’s complex behavior. Figure 4(a) shows the reuse distance histogram data collected by our tool for one of the most frequently executed memory accesses in the ASCI Sweep3D code [1]. Figure 4(b) presents our parameterized model for that instruction. In this figure, we can see the result of modeling the small constant reuse distance separately, and how the fractions produced by the recursive modeling step have different widths
Problem size
(a) Collected data
Normalized frequency
10 0
0
Problem size
(b) Constructed model
Figure 4: The surface on the right is the parameterized model for one of the most frequently executed memory accesses in Sweep3D. On the left is the reuse distance histogram collected for that instruction. The x axis represents the problem size, on the y axis is normalized number of accesses and the z axis represents the reuse distance.
depending on how fast the reuse distance changes. On each graph, the x axis represents the problem size (from 8 to 46 in this case); the y axis represents the normalized number of accesses for each problem size; and the z axis represents the reuse distance. The problem of determining the ratio of hits and misses for a given cache size C is equivalent to determining the intersection of the model with the plane defined by z = C. Similarly, the problem of computing the expected behavior for one instruction at a given problem size P is equivalent to determining the intersection of the surface and the plane defined by x = P. We can also determine the minimum cache size such that the hit-ratio is H. The solution to this problem is the intersection of the model and the plane defined by y = H. Any two of these three problems can be combined and the solution is the intersection of the surface with the corresponding two orthogonal planes. We can use this approach to predict the ratio of misses for a given problem size and cache size. For the reference modeled in Figure 4, approximately 75% of the executed accesses see a small, constant memory reuse distance due to spatial reuse; these will be hits for any problem size. The other 25% end up in several bins, each one having a distinctive monotonically increasing function for the reuse distance. The cache line considered in the model is 32 bytes long and four elements (of type double) can be packed into it. The first access to a line yields a large reuse distance while the next three stride-1 accesses to the cache line have a small reuse distance. Figure 5 illustrates how the memory reuse distance model presented in Figure 4(b) translates into a prediction of cache misses. The model is evaluated for problem size 100 and we consider an architecture with 1024 L1 blocks and 256k L2 blocks. Because the maximum reuse distance predicted for this reference is six orders of magnitude larger than the size of the L1 cache, the curve on the right is shown on a logarithmic y-axis. The model predicts a ratio of about 74% hits in the L1 cache and 96% hits in the L2 cache. Modeling spatial reuse distance as opposed to temporal reuse distance has an important drawback. Because spatial reuse distance uses a non-unit memory block size, it is sensitive to data alignment and array dimensions. While the
6
x 10
7
10
4 6
10
Reuse distance (semilog)
Reuse distance
3.5
3
2.5
2
1.5
1
L2 hits
L2 size
5
10
4
10
L1 hits
3
10
L1 size
2
10
1
10
0.5
0
0
0
0.1
0.2
0.3
0.4
0.5
0.6
0.7
0.8
0.9
Normalized frequency
(a) Model evaluation for problem size 100
1
10
0
0.1
0.2
0.3
0.4
0.5
0.6
0.7
0.8
0.9
1
Normalized frequency
(b) Number of L1 and L2 hits predicted
of hardware resources required. Each generic RISC instruction has an associated set of execution units onto which it can be scheduled, a latency and a repeat rate. The current version of the scheduler considers each memory access as a primary cache hit. An ongoing effort is focused on translating our data on memory reuse distance into an estimation of latency for a given target memory hierarchy. Currently, we perform static and dynamic analysis of application binaries on a SPARC processor; we use the scheduling tool to predict performance on a MIPS R12000 or Itanium2 processor; and we validate our predictions against actual executions on these processors by collecting performance measurements with hardware counters.
3. RESULTS Figure 5: An instantiation of the model in Figure 4(b) for problem size 100. The curve on the left presents the histogram of reuse distances in linear coordinates. The curve on the right is shown on a logarithmic y-axis and includes the cuts for the L1 and L2 cache sizes. total number of cache misses at the loop level does not depend on the alignment of data, the spatial reuse distance for individual references is affected differently for distinct problem sizes and is a source of errors in the modeling step [12, pages 53–60]. To address this, we aggregate reuse distance histograms for references that are part of the same loop and access the memory with the same pattern. At instrumentation time, we determine sets of memory references that are part of the same loop and have the same stride across all levels of the loop nest containing them; we insert code that collects a single reuse distance histogram for every such set. Whenever we refer to the reuse distance histogram for a reference, we mean the reuse distance histogram for a set of memory references that were aggregated by our analysis.
2.4 Mapping Models to a Target Architecture Our post-processing tool constructs an annotated CFG that contains information about loop nesting structure and the execution frequency of each basic block. We build this annotated CFG by combining information gathered using static analysis of the application binary with dynamic measurements of its execution behavior or an instantiation of the parameterized model. From this representation, we identify paths in the CFG and compute their associated frequencies. Inside nested loops, we work from the inside out; no basic block is considered at more than one loop level. These paths serve as input for an instruction schedule analysis tool that computes an estimate for the execution cost of each path. To compute the execution cost associated with a path for a (possibly different) target architecture, we translate the instructions present in the basic blocks of the (SPARC) application binary into instances of generic RISC instruction classes. We defined a set of generic RISC instruction classes and a module for translating SPARC binary instructions into generic instructions. We built a configurable scheduler that is initialized with an architecture description. The scheduler enables us to predict instruction execution times for a specific target architecture. The architecture description defines the number and type of execution units, and a characterization of each generic instruction class in terms
In this section, we apply our methodology to predict the cache miss counts and the overall execution time for several programs. We use six benchmarks in this study, including: ASCI Sweep3D [1], BT and SP from NPB 2.3-serial [2] , and BT, LU and SP from NPB 3.0. We compare our predictions against measurements performed using hardware performance counters on an Origin 2000 system. The Origin 2000 system used for validation measurements is a NUMA machine with 16 R12000 CPUs at 300MHz and 10GB of RAM. Each CPU has a 2-way setassociative 32KB L1 data cache, and a TLB with 64 entries, where each TLB entry maps two consecutive 16KB pages. Each pair of CPUs shares a large 8MB 2-way set-associative unified L2 cache. The L1 cache uses a line size of 32 bytes, and the L2 cache has a line size of 128 bytes. To compute the predictions, we compiled the benchmark applications on a Sun UltraSPARC-II system using the Sun WorkShop 6 update 2 FORTRAN 77 5.3 compiler, and the optimization flags: -xarch=v8plus -xO4 -depend -dalign -xtypemap=real:64. Measurements on the Origin 2000 system were performed on binaries compiled with the SGI Fortran compiler Version 7.3.1.3m and the optimization flags: -O3 -r10000 -64 -LNO:opt=0. We used the highest optimization level but we disabled the high level loop nest optimizations because the sets of loop nest transformations implemented in the Sun and SGI compilers are different. Loop nest optimizations are tailored to each target architecture and they interfere with our ability to make cross-architecture and cross-compiler predictions, as we discuss below. Loop nest transformations have little impact on the number of floating point operations performed by an application. Their aim is to reduce a program’s traffic to memory, to hide the latency observed by the most frequently executed memory references, or to increase the instruction level parallelism inside inner loops. To achieve these goals, the loop nest optimizations use dependence analysis to change the execution order of a program in a way that reduces the demand on the memory sub-system, and/or increases the number of operations that can be executed in parallel every cycle. By changing the execution order of a program, these transformations alter the application’s memory access pattern and its instruction schedule dependencies, effectively changing the application’s algorithm and its specific factors that are modeled by our toolkit. When trying to perform cross-platform performance predictions and validate them using different compilers on each platform, significant differences in compiler capabilities make accurate predictions hard. However, cross-architecture predictions can incorpo-
rate machine-specific optimizations. We could compile an application on SPARC with optimizations appropriate for the target architecture on which we want to predict performance. Models and predictions based on this code will reflect the effects of these optimizations on the target architecture. The performance data numbers presented in this section were measured or predicted for executions of the binaries with a number of time steps different than each application’s default value. We used a lower number of iterations to reduce the time needed for all the measurements. The actual number of time steps used for analyzing Sweep3D, BT, LU and SP are 6, 20, 50 and 50 respectively.
3.1 Predictions of cache and TLB miss counts To compute predictions of cache and TLB miss counts for an application, we use memory reuse distance (MRD) histograms collected for it by our toolkit. The TLB behaves exactly like an LRU cache with a number of blocks equal to the number of entries in the TLB and the size of each block equal to the memory size mapped by each entry. For the R12000 processor we view the TLB as a cache with 64 blocks of 32KB each, because each entry maps two consecutive pages. Therefore, we collected MRD histograms using memory block sizes of 32, 128 and 32768 bytes, corresponding to the L1 cache line size, L2 cache line size and the double page block mapped by a TLB entry, respectively. For the NAS benchmarks, we collected MRD for a range of problem sizes between 20 and 50, and for the Sweep3D application we collected MRD histograms for arbitrary sizes between 20 and 57. The problem sizes inside these ranges were randomly selected. We collected data on relatively small input problems to limit the cost of executing the instrumented binaries, which is the most time consuming step of the entire process. Next, we built models of the reuse distance for each application with each model parameterized by mesh size. Finally, to compute predictions of cache miss counts, we evaluated these models at each problem size of interest. We estimated the number of misses by determining how many references in the predicted reuse distance histogram for the proper block size have a reuse distance greater than the number of blocks in that cache level. The NAS benchmarks use statically allocated data structures, with the maximum size of the working mesh specified at compile time3 . We used static and dynamic analysis of the class A binaries to construct the models. The measurements for each mesh size on the Origin 2000 system were performed on the binary of minimum class that accomodates that particular size (e.g. class A for mesh sizes from 10 to 64, class B for mesh sizes from 65 to 102, class C for mesh sizes from 105 to 162, and our non-standard class L (see footnote) for mesh sizes from 165 to 200). Figure 6 presents measured and predicted miss counts for both L1 and L2 caches, as well as for the TLB. Each subfigure presents the normalized number of misses for one application. For all applications the x axis represents the mesh size and the y axis represents the number of misses per cell, per iteration. (All applications considered in this paper work on a cubic mesh, therefore the number of cells 3 The benchmarks can be compiled in several standard classes named A, B and C, which have a maximum mesh size of 64, 102 and 162, respectively. We created an extra class L with a maximum mesh size of 200.
is equal to mesh size3 .) This view of the data enables us to understand how the application characteristics scale with problem size, and at the same time enables a more clear view of the plotted data which otherwise would span many orders of magnitude on the y axis. Because of differences in the range of cache misses at different levels, for some of the applications we scaled the L2 and/or the TLB miss counts by a constant so that we could comfortably plot them with the L1 misses for that application. The scaling factor, if any, is specified in the legend of each subfigure. The figures show that in general the predictions approximate well the measured values. With a few exceptions, the predictions are within 10% of the miss counts measured with hardware performance counters on actual runs of the applications. When we report prediction errors, the errors we report are relative to the number of measured misses, not the number of memory references. Overall the L2 and TLB miss rate is relatively small for all these applications when running on the Origin. For example, BT 3.0 has a peak miss rate in L2 of just under 0.5%; BT 2.3 and SP 2.3 have the largest L2 miss rates at around 3%. A 10% error relative to these measured misses is corresponds to less than 0.3% error relative to the number of executed references. Some factors that may affect the accuracy of memory predictions are: conflict misses which cannot be predicted by memory reuse distance alone, but which can be kept under control by several optimization techniques; the unified L2 cache of the Origin 2000 for which code footprint reduces the effective cache size available for data; and the fact that we compute predictions not only cross architecture, but also cross compiler, which makes the predictions vulnerable to differences in compiler optimizations. In the case of L2 miss predictions, the largest errors correspond to a critical range of problem sizes, different for each application, where the size of the active memory footprint transitions from fitting in the cache to exceeding the cache capacity. In this critical range, the difference between the fully associative cache assumed by the memory reuse distance models and the real 2-way set-associative cache is most pronounced. For Sweep3D with problem size 90, we used a simulator to explore differences between L2 measurements and predictions. For this problem size, conflict misses were nearly a factor of 2 more than capacity misses. This causes us to underpredict L2 misses by a factor of 3 for this problem size. Our simulation results validate both our 2-way set associative measurements and our fully-associative predictions for this problem size. In a fully associative cache, as cache capacity is exceeded the number of cache misses grows abruptly. In a low level set-associative cache, conflict misses cause smoother growth. This effect is particularly prominent in the L2 curves for Sweep3D and LU 3.0 shown in figure 6. In the TLB miss predictions for both the NAS benchmarks and Sweep3D, there are some discrepancies between the measured and predicted values. Although the largest difference between measured and predicted TLB misses was 36% (Sweep3D, problem size 60), the overall TLB miss rates were very low and their potential impact on performance is very small. For Sweep3D at problem size 60, simulations of a fully-associative TLB with all of its entries devoted to data was 19% under the measured value. Code pages occupying TLB entries could be responsible for some of these differences. For the NAS benchmarks, the most significant
Figure 6: L1, L2 and TLB cache miss predictions for 5 NAS benchmarks and Sweep3D. Each graph presents the measured and the predicted miss counts for L1, L2 and TLB. prediction errors were for the larger problem sizes, namely, those measured with class C and class L binaries. A factor complicating reuse-distance based predictions for these codes is that we construct MRD models from data collected with a class A binary with a fixed data size. Collecting data for fixed data sizes, even though problem sizes vary, obscures the relationship between stride and problem size, which can cause modeling errors.
3.2 Predictions of execution time To estimate execution time for an application on a target architecture, we must consider both the cost of the memory hierarchy latency experienced by the application on the target machine and the cost of the computation itself. An application’s computation cost is a function of not just how often each basic block is executed, but also how well its instruction level parallelism matches the number and the type of execution units available on the target architecture and how much instruction dependencies reduce the compactness of the instruction schedule. To predict basic block execution frequency of applications for arbitrary problem sizes, we construct models of basic block execution frequency using data from edge counter ex-
ecution histograms collected for a set of small problem sizes4 . Next, we derived models of the execution frequency for each edge counter and evaluated the models at each problem size of interest. We used our scheduler, initialized with a description of the R12000 architecture, to estimate execution time for each application when all memory references hit in the cache closest to the CPU (L1 for the R12000). Figure 7 presents the predicted instruction execution time when all memory accesses are cache hits; this prediction is labeled in the graph as Scheduler latency. As with the graphs of cache miss counts, we present the execution time relative to the amount of useful work, or the number of mesh cells, and normalized per iteration. The x axis represents the mesh size, and the y axis represents the number of cycles per cell per time step. How to translate the cache miss counts implied by our models of memory reuse distance into an expected latency for each memory reference, on an arbitrary architecture, is still an open problem. On an out-of-order superscalar ma4
Although our predictions of basic block frequency are based on data for the same set of problem sizes we monitored for memory reuse distance, other sizes could have been used.
Figure 7: Predictions of the execution time for 5 NAS benchmarks and Sweep3D. Each graph presents: (1) the measured time, (2) the instruction execution time predicted by the scheduler when all memory accesses are cache hits, (3) the predicted L1 miss penalty, (4) the predicted L2 miss penalty, (5) the predicted TLB penalty, and (6) the predicted execution time which includes both the instruction execution cost and the predicted memory hierarchy penalty. chine, the processor can execute instructions in an order different than that specified by the compiler. On such machines, the hardware logic can hide some of the cache miss penalty; its ability to do so is limited by the size of the instruction window and by the number of instructions without unresolved dependencies available in the window at any given time. On an in-order or VLIW machine5 , the processor always executes the instructions in the order determined by the compiler. In the case of a cache miss, the hardware continues to issue instructions until it reaches an instruction with unresolved dependencies, such as an instruction that needs the data returned by a reference that missed in cache. At this point, the execution pipeline stalls until the dependencies are resolved. It is the compiler’s job to order instructions in a way that minimizes execution time. Compilers can rearrange the in5
Most modern machines have non-blocking caches, therefore we consider only such cases. Predictions for machines with blocking caches are much easier.
structions in a loop to group together loads to data that cannot be in the same cache line so that if more than one load misses in the cache, the latency of fetching the data from memory for every cache miss after the first, is partially hidden by the latency associated with the first miss. Such an optimization is limited by the number of parallel, large-stride loads available in a loop and by the maximum number of outstanding memory references allowed in the system. On R12000, four memory accesses can be outstanding at any given time. In practice, the instruction schedules in loops are often the most limiting factor that determine how much memory system parallelism is realized. We define the memory hierarchy penalty for an application as the sum of the penalties incurred by each cache and TLB miss. The R12000-based Origin used to validate our predictions has the following memory access latencies for a floating point reference: minimum access time to L1 cache is 3 cycles, minimum access time to L2 is 11 cycles, the access time to main memory ranges from 92 cycles (restart
latency) to 116 cycles (back-to-back latency) [8, 15], and the TLB miss penalty is 78 cycles. To predict exposed latency on an out-of-order architecture is challenging. We plan to augment our static analyzer to estimate the number of accesses that can be executed in parallel in each loop (by examining instruction dependencies), combine this with dynamic information about which accesses cause misses, and estimate observed latency by subtracting off how much of the memory hierarchy latency can be overlapped with instructions. Lacking this infrastructure, we compute some estimates for exposed latency. Figure 7 shows curves for L1 miss penalty, L2 miss penalty and TLB miss penalty. L1 miss penalty reflects the product between the number of L1 misses and 50% of the 8 cycle miss penalty from L1 to L2. L2 miss penalty reflects the product between the number of L2 misses and 100% of the 81 cycle restart miss penalty from L2 to memory. TLB miss penalty reflects the product between the number of TLB misses and the 78 cycle cost of a TLB miss. In Figure 7 the Predicted time combines the scheduler latency, and the L1, L2 and TLB miss penalties as described above. The figures show that with these assumptions, the execution time predictions match well the measured values for four of the applications. The exceptions are BT 2.3 and Sweep3D for which we underpredict by about 20%. The spikes in measured execution time that can be observed for some problem sizes, are due to system interferences at memory with other users’ running jobs. For Sweep3D, part of the execution time prediction error is due to the underprediction of L2 misses as a result of conflicts in the L2 cache. Figure 8 presents the L2 miss penalty and the predicted execution time (the A curves in Figure 8) when we consider the measured number of L2 misses instead of the predicted counts in our execution time formula. With the measured number of L2 misses, the predicted and
Figure 8: L2 miss penalty and predicted execution time using (A) the measured L2 miss counts, plus (B) assuming a 135 cycle memory latency. measured execution time curves have a similar shape, but we still underpredict. The fact that the gap between the predicted and the measured execution time increases with problem size, combined with the observation that the scheduler latency, L1 and TLB penalties are constant or slightly decreasing when problem size grows (see Figure 7), suggests that the difference is due to a larger memory penalty incurred by L2 misses, the only component of the predicted execution time that increases with problem size. Curves B in Figure 8 represent the L2 miss penalty and the predicted execution time when we use a 135 cycle memory latency in our formula for predicted execution time, with
all other parameters unchanged. The restart memory latency of 92 cycles presented at the beginning of this section is micro-benchmarked for read operations, when all cache lines are clean. In a real application, some of the cache lines will be dirty. If a cache miss causes a dirty line to be replaced, the dirty line must be written back to memory before the new line can be fetched; this might result in a latency nearly twice as large as when replacing a clean line. We acknowledge that the formula for predicted execution time is empirical, and that we have to understand better how to automatically translate our accurate predictions of cache miss counts into an expected memory hierarchy delay. However, the accurate predictions accross a large set of problem sizes on an Origin 2000 system, combined with similarly accurate results on an Itanium2 machine, make us believe that we are on the right path.
4. RELATED WORK We are not the first to propose separating the contribution of application-specific factors from the contribution of the architecture’s characteristics when analyzing program performance. Based on their study of memory-bound codes such as the NAS Parallel Benchmarks (NPB) 2.3 kernels [2], Snavely et al. [16] model node performance of an application primarily as a function of how it exercises the memory subsystem. They predict performance by convolving Application Profiles with Machine Signatures. Our work differs from that of Snavely et al. in two very significant ways. First, we model the cost of computation as well as memory latency and bandwidth; this is necessary for accurately modeling performance of compute-bound codes such as BT 3.0. Second, and most important, we build parameterized models of application behavior; this enables us to predict performance for problem sizes that are too large to be practical for monitoring at scale on today’s systems. Recently, memory reuse distance (MRD) have been the focus of many researchers trying to characterize an application’s memory access behavior. However, using parameterized models of reuse distance to predict an application’s cache miss counts for different problem sizes has not received the same level of attention. Zhong et al. [19] describe using two memory reuse distance histograms that are an aggregation of all accesses executed by the program as the basis for modeling. Our work differs significantly from that of Zhong et al. in that (1) we model memory performance at the level of individual references rather than aggregating across the whole program, which enables better accuracy and finergrain predictions (e.g. at the routine or loop level), (2) our modeling tool dynamically determines an appropriate partitioning of reuse distance histograms into fractions of accesses that are modeled together instead of using a fixed strategy, (3) our modeling tool discovers the appropriate modeling polynomials, although a user will have to supply unusual basis functions for us to consider, and (4) we model factors other than memory access behavior—performance is a function of more than just memory accesses.
5. CONCLUSIONS This paper describes a toolkit for characterizing the behavior of single node applications and synthesizing parameterized models that predict program performance. Our toolkit aims to model the characteristics of an application
in isolation of any architectural details. In practice, we have been largely successful modeling the most important factors affecting application behavior and creating semi-automatic cross architecture predictions for new input parameters. Two details keep us from being totally architecture independent: we currently calculate reuse distance using non-unit size memory blocks to account for spatial locality and we don’t yet automatically calculate how multiple outstanding misses will affect the observed latency from cache misses. We are exploring strategies for addressing these shortcomings. Memory reuse distance is one of the key application characteristics we analyze to predict performance. We describe a strategy for accurately modeling the memory reuse distance seen by individual memory references, and we are successful using these models to compute predictions of cache miss counts for various applications across a large range of problem sizes. This approach yields better accuracy than other methods in the literature. The accuracy of our predictions validate the utility of our fine-grain modeling approach. Unlike prior work, we consider both the instruction execution cost and the memory hierarchy penalty, which enables us to predict the execution time of applications regardless of whether they are CPU bound, memory bound, or have both characteristics in different program regions. Our plans for this work call for exploring both how to increase the accuracy of our cross architecture predictions and how to extend our strategy for predicting performance of parallel applications. For parallel applications, the key challenge is understanding the impact of communication and serialization on performance. We have infrastructure in our toolkit for monitoring synchronization, data movement, and segmenting computation between communication events. We have not yet begun to explore the construction of scalable models for parallel performance.
6.
ACKNOWLEDGMENTS
This work was supported in part by the National Science Foundation under Grant No. ACI 0103759 and the Department of Energy under Contract Nos. 03891-001-994G, 74837-001-03 49, and/or 86192-001-04 49 from the Los Alamos National Laboratory. We thank the Performance and Architecture Laboratory at Los Alamos National Laboratory for hosting Gabriel as an intern during the summer of 2003. We are particularly grateful to Scott Pakin and Darren Kerbyson for contributing their insights and guiding Gabriel as he parameterized the toolkit’s scheduler to predict instruction execution time on Itanium2 systems. We thank Dick Hanson for his suggestions on modeling approaches with Matlab.
7.
REFERENCES
[1] The ASCI Sweep3D Benchmark Code. DOE Accelerated Strategic Computing Initiative. http://www.llnl.gov/asci_benchmarks/asci/ limited/sweep3d/asci_sweep3d.html. [2] D. Bailey, T. Harris, W. Saphir, R. van der Wijngaart, A. Woo, and M. Yarrow. The NAS parallel benchmarks 2.0. Technical Report NAS-95-020, NASA Ames Research Center, Dec. 1995. [3] T. Ball and J. R. Larus. Optimally profiling and tracing programs. ACM Transactions on Programming Languages and Systems, 16(4):1319–1360, July 1994.
[4] B. Bennett and V. Kruskal. LRU stack processing. IBM Journal of Research and Development, 19(4):353–357, July 1975. [5] K. Beyls and E. D’Hollander. Reuse distance as a metric for cache behavior. In IASTED conference on Parallel and Distributed Computing and Systems 2001 (PDCS01), pages 617–662, 2001. [6] T. Cormen, C. Leiserson, and R. Rivest. Introduction to Algorithms. The MIT Press, Cambridge, MA, 1990. [7] C. Ding and Y. Zhong. Reuse distance analysis. Technical Report TR741, Dept. of Computer Science, University of Rochester, 2001. [8] C. Hristea, D. Lenoski, and J. Keen. Measuring memory hierarchy performance of cache-coherent multiprocessors using micro benchmarks. In Proceedings of the 1997 ACM/IEEE conference on Supercomputing (CDROM), pages 1–12. ACM Press, 1997. [9] D. J. Kerbyson, H. J. Alme, A. Hoisie, F. Petrini, H. J. Wasserman, and M. Gittings. Predictive Performance and Scalability Modeling of a Large-Scale Application. In Supercomputing 2001, Denver, CO, Nov. 2001. [10] D. E. Knuth and F. R. Stevenson. Optimal measurement points for program frequency counts. BIT, 13(3):313–322, 1973. [11] J. Larus and E. Schnarr. EEL: Machine-Independent Executable Editing. In Proceedings of the ACM SIGPLAN Conference on Programming Language Design and Implementation, pages 291–300, June 1995. [12] G. Marin. Semi-Automatic Synthesis of Parameterized Performance Models for Scientific Programs. Master’s thesis, Dept. of Computer Science, Rice University, Houston, TX, Apr. 2003. [13] MathWorks. Optimization Toolbox: Function quadprog. http://www.mathworks.com/access/ helpdesk/help/toolbox/optim/quadprog.shtml. [14] R. Mattson, J. Gecsei, D. Slutz, and I. Traiger. Evaluation techniques for storage hierarchies. IBM Systems Journal, 9(2):78–117, 1970. [15] U. Prestor. Evaluating the memory performance of a ccNUMA system. Master’s thesis, Dept. of Computer Science, University of Utah, Salt Lake City, UT, Aug. 2001. [16] A. Snavely, L. Carrington, and N. Wolter. Modeling application performance by convolving machine signatures with application profiles. In Proc. IEEE 4th Annual Workshop on Workload Characterization, 2001. [17] D. Sundaram-Stukel and M. K. Vernon. Predictive Analysis of a Wavefront Application Using LogGP. In Seventh ACM SIGPLAN Symposium on Principles and Practice of Parallel Programming (PPoPP ’99), Atlanta, May 1999. [18] R. E. Tarjan. Testing flow graph reducibility. Journal of Computer and System Sciences, 9:355–365, 1974. [19] Y. Zhong, S. G. Dropsho, and C. Ding. Miss Rate Prediction across All Program Inputs. In Proceedings of International Conference on Parallel Architectures and Compilation Techniques, New Orleans, Louisiana, Sept. 2003.