people in the UK are currently unemployed [4]. Addressing .... dedicated branch on a hierarchy. This is .... with one of the computers acting as a server. We have ...
The 18th International Conference on Auditory Display (ICAD-2012)
June 18–22, 2012, Atlanta, USA
CROSS-MODAL COLLABORATIVE INTERACTION BETWEEN VISUALLY-IMPAIRED AND SIGHTED USERS IN THE WORKPLACE Oussama Metatla, Nick Bryan-Kinns
Tony Stockman, Fiore Martin
Queen Mary University of London School of Electronic Engineering & Computer Science Mile End Road, London, E1 4NS, UK. {oussama, nickbk}@eecs.qmul.ac.uk
Queen Mary University of London School of Electronic Engineering & Computer Science Mile End Road, London, E1 4NS, UK. {tonys, fiore}@eecs.qmul.ac.uk
ABSTRACT We present a detailed description of the design and integration of auditory and haptic displays in a collaborative diagram editing tool to allow simultaneous visual and non-visual interaction. The tool was deployed in various workplaces where visually-impaired and sighted coworkers access and edit diagrams as part of their daily jobs. We use our initial observations and analyses of the recorded interactions to outline preliminary design recommendations for supporting cross-modal collaboration in the workplace.
1. INTRODUCTION Every day our brains receive and combine information from different senses to understand our environment. For instance when we both see and hear someone speaking we associate the words spoken with the speaker. The process of coordinating information received through multiple senses is fundamental to human perception and is known as cross-modal interaction [1]. In the design of interactive systems, the phrase cross-modal interaction has also been used to refer to situations where individuals interact with each other while accessing a shared interactive space through different senses (e.g. [2, 3]). Technological developments mean that it is increasingly feasible to support cross-modal interaction in a range of devices and environments. But there are no practical examples where auditory displays are used to support users when collaborating with coworkers who employ other modes of interaction. We are interested in exploring the potential of using auditory display in cross-modal interaction to improve the accessibility of collaborative activities involving the use of diagrams. Diagrams are a key form of representation often becoming common standards for expressing specialised aspects of a particular discipline (e.g. meteorologists use weather maps, architects use floor plans). However, there is currently no practical way for visually-impaired co-workers to view, let alone collaborate with their colleagues on diagrams. This is a major barrier to workplace collaboration that contributes to the exclusion and disengagement of visuallyimpaired individuals. Indeed, the Royal National Institute of Blind People (RNIB) estimates that 66% of blind and partially sighted people in the UK are currently unemployed [4]. Addressing the challenge of designing support for cross-modal collaboration in the workplace has thus the potential to significantly improve the working lives and inclusion of perceptually impaired workers.
2. BACKGROUND 2.1. Non-visual Interaction with Diagrams Interest in supporting non-visual access to visually represented information grew in parallel with early developments in auditory display research [5]. A major drive of such endeavours has been and still is the potential to support individuals with temporary or permanent perceptual impairments. For example, a sonification technique pioneered in [6] displayed a line graph in audio by mapping its y-values to the pitch of an acoustic tone and its x-values to time. This sonification techniqued allows visually-impaired individuals to examine data presented in line graphs and tables. Current approaches to supporting non-visual interaction with visual displays employ one or a combination of two distinct models of representation; Spatial or Hierarchical. The two models differ in the degree to which they maintain the original representation when translating its visual content [7], and hence produce dramatically different non-visual interactive displays. 2.1.1. Spatial Models A spatial model allows non-visual access to a visual display by capturing the spatial properties of its content, such as layout, form and arrangements. These are preserved and projected over a physical or a virtual space so that they could be accessed through alternative modalities. Because audio has limited spatial resolution [8], spatial models typically combine the haptic and audio modalities to support interaction. The GUIB project [9] is one of the early prototypes that employed a spatial model of representation to support non-visual interaction with a visual display. The prototype combines braille displays, a touch sensitive tablet and loudspeakers to allow blind users to interact with MS Windows and X Windows graphical environments. More recent solutions adopting the spatial model of representation typically use tablet PC interfaces or tactile pads as a 2D projection space where captured elements of a visual display are laid out in a similar way to their original arrangements. Other solutions use force feedback devices as a controller. In such instances, the components of a visual display are spatially arranged on a virtual rather than a physical plane, and can thus be explored and probed using a haptic device such as a PHANTOM Omni device 1 . The advantage of using a virtual display lies in the ability to add further haptic representational dimensions to the captured information, such as texture and stiffness, which can enhance 1 Sensable
Technologies, http://www.sensable.com
The 18th International Conference on Auditory Display (ICAD-2012)
the representation of data. The virtual haptic display can also be augmented and modulated with auditory cues to further enhance the interactive experience [10, 11]. 2.1.2. Hierarchical Models A hierarchical model, on the other hand, preserves the semantic properties of visual displays and presents them by ordering their contents in terms of groupings and parent-child relationships. Many auditory interfaces are based on such a model as they inherently lend themselves to hierarchical organisation. For instance, phone-based interfaces support interaction by presenting the user with embedded choices [12]. Audio is therefore the typical candidate modality for non-visual interaction with visual displays when using hierarchies. One of the early examples that used a hierarchical model to translate visual displays into a non-visually accessible representation is the Mercator project [13]. Like the GUIB project, the goal of Mercator was to provide non-visual access to X Windows applications by organising the components of a graphical display based on their functional and causal properties rather than their spatial pixel-by-pixel on-screen representations. Other examples have employed a hierarchical model of representation to support non-visual interaction with technical drawing [14], relational diagrams [15] and molecular diagrams [16]. 2.2. Cross-modal Collaboration Despite significant progress in the use of audio and haptics in multimodal interaction design, research into cross-modal collaboration remains sparse. In particular, very little research has addressed the challenge of supporting collaboration between visually-impaired and sighted users. Nonetheless, initial investigations have identified a number of issues that impact the efficiency of collaboration in a multimodal interactive environment. An examination of collaboration between sighted and blind individuals on the Tower of Hanoi game [17], for instance, highlighted the importance of providing visually-impaired collaborators with a continuous display of the status of the shared game. Providing collaborators with independent views of the shared space, rather than shared cursor control, was also found to improve orientation, engagement and coordination in shared tasks [2]. A multimodal system combining two PHANTOM Omni haptic devices with speech and non-speech auditory output was used to examine collaboration between pairs of visually-impaired users [18] and showed that the use of haptic mechanisms for monitoring activities and shared audio output improves communication and promotes collaboration. Still, there are currently no studies of collaborations between visually-impaired and sighted coworkers. We therefore know little about the nature of cross-modal collaboration in the workplace and ways to support it through auditory design.
June 18–22, 2012, Atlanta, USA
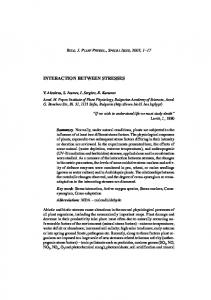
the British Computer Association of the Blind and RNIB. Activities ranged from round table discussions exploring how participants encounter diagrams in their workplaces, to hands-on demonstrations of early audio and haptic prototype diagramming systems. The discussions highlighted the diversity of diagrams encountered by the participants in their daily jobs; from design diagrams for databases and networks, to business model diagrams, and organisation and flow charts. Additionally, participants discussed the various means they currently use for accessing diagrams and their limitations. Approaches included using the help of a human reader, swell paper, transcriptions and stationary-based diagrams, all of which share two main limitations; the inability to create and edit diagrams autonomously, and inefficiency of use when collaborating with sighted colleagues. We chose to focus on nodes-and-links diagrams because they are frequently encountered in the workplace and we already have evaluated a single user version for audio-only interaction with such diagrams [19]. A set of requirements was thus drawn together from the workshop and other discussions to form the input to the iterative development process that followed in which a cross-modal collabroative tool was developed. Our tool 2 supports autonomous non-visual editing of diagrams as well as real-time collaboration. It allows simultaneous access to a shared diagram by augmenting a graphical display with non-visual auditory and haptic displays combining hierarchical and spatial models of representation. The tool supports user-defined diagram templates which allows it to accommodate various types of nodes-and-links diagrams such as organisation and flow charts, UML and database diagrams and transportation maps. 3.1. Graphical View Figure 1 shows a screenshot of the graphical view of the tool. This view presents the user with an interface similar to typical diagram editors where a toolbar is provided containing various functions to create and edit diagram content. The user construct diagrams by using the mouse to select the desired editing function and has the ability to access and edit various object parameters such as labels, position, etc.
3. AUDITORY DESIGN IN A COLLABORATIVE CROSS-MODAL TOOL To address the issues identified above we gathered requirements and feedback from potential users to inform an ongoing development process. We ran a workshop to engage with representatives from end user groups in order to encourage discussion and sharing of experiences with using diagrams in the workplace. Eight participants attended the workshop including participants from British Telecom and the Royal Bank of Scotland and representatives from
Figure 1: Graphical view (right) augmented by an auditory hierarchical view (left) embedded in the editor.
2 An open source release of the tool and a video showcasing its features can be downloaded from: http://ccmi.eecs.qmul.ac.uk/ downloads
The 18th International Conference on Auditory Display (ICAD-2012)
3.2. Auditory Design The design of the auditory view is based on the multiple perspective hierarchical approach described in [19]. According to this approach, a diagram can be translated from a graphical to an auditory form by extracting and structuring its content in a tree-like form such that items of a similar type are grouped together under a dedicated branch on a hierarchy. This is aimed to ease inspection, search and orientation [ibid.]. Figure 1 shows how this is achieved for a UML Class diagram. In this case, the diagram’s classes – represented as rectangular shapes – are listed under the “Class” branch of the hierarchy. The information associated with each class, such as its attributes, operations and connections to other classes, is nested inside its tree node and can be accessed individually by expanding and inspecting the appropriate branches. Similarly, the diagram’s associations – represented as solid arrows – are listed under the “Association” branch, and information associated with each connection can be accessed individually by inspecting its branches (see Figure 2). This allows the user to access the information encoded in a diagram from the perspectives of its “Classes”, “Associations” or its “Generalisations”. To inspect the content of a diagram, the user simply explores the hierarchy using the cursor keys, similar to typical file explorers, and receives auditory feedback displaying the content that they encounter.
June 18–22, 2012, Atlanta, USA
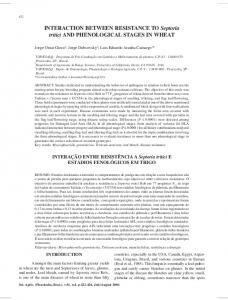
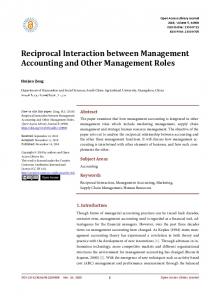
produce a sweep that ends with a bell like sound. A Collapse earcon is composed from the reversed sequence of the Expand earcon (e.g. “Associations” + (Expand earcon) for expanding the Associations branch, and (Collapse earcon) + “Associations” for collapsing it). Additionally, when a branch is expanded, a speech output is displayed to describe the number of items it contains (e.g. “Associations” + (Expand earcon)+“three” to convey that the diagram contains three associations). The tool allows a user to switch from one perspective on the hierarchy to another; essentially rapidly transporting to the top level of a given branch type from anywhere on the hierarchy using a single keystroke. The successful switch from one perspective to another is conveyed using a one-element earcon combined with the spoken description of the destination node. Finally, a one-element earcon is used to highlight the occurrence of illegal moves. This is referred to as the Error sound and designed as a low pitched version of the single tone browse sound. An example of an illegal move is attempting to expand an already expanded branch, or attempting to browse beyond available levels on the hierarchy. In addition to inspecting a given diagram, the hierarchy can also be used to edit its content. To do this, the user first locates the item of interest on the hierarchy before executing a particular editing action that alters its state. For example, to remove a class from the diagram, the user would inspect the appropriate path to locate it on the hierarchy then, once found, issue the command using the keyboard to delete it. The tool then interprets the current position of the user on the hierarchy together with the issued command as one complete editing expression and executes it appropriately. The auditory hierarchical view is thoroughly described and evaluated in [15, 19]. 3.3. Audio-Haptic Design In addition to the auditory hierarchical view, we implemented a spatial model of representation to capture the layout and spatial arrangements of diagrams content. To do this, we use a PHANTOM Omni haptic device (Figure 3) to display the content of a diagram on a virtual vertical plane matching its graphical view on a computer screen (Figure 4). We designed a number of audio-haptic effects to both represent the content of a diagram and support nonvisual interaction in this view.
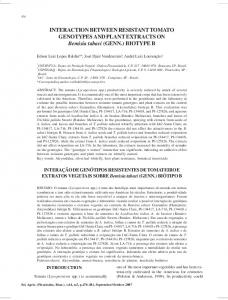
Figure 2: Hierarchical auditory view (left) where a Class diagram is accessed from the perspective of its associations. We use a combination of speech and non-speech sounds to display encountered content. The choice of these sounds was informed through the use of an iterative prototyping approach in which candidate sounds were played to both sighted and visuallyimpaired users. The successful movement from one node to another is conveyed by displaying the text label of the node in speech together with a one-element earcon in the form of a single tone with a distinct timbre assigned to each type of item. This is displayed as the sequence (earcon) + “”. The same technique is used to highlight reaching the end or the top of a list, but in such a case a double beep tone is used instead of a single tone, and is displayed as the sequence (earcon) + “”, in which case the user is looped to the other end of the list. The successful expansion or collapse of a branch is also displayed using one-element earcons. An Expand earcon mixes frequency and amplitude modulation on a basic pulse oscillator to
3.3.1. Audio-Haptic Representation The main haptic effect that we use to represent diagrams nodes and links is attraction force. Diagram nodes are rendered as magnetic points on the virtual plane such that a user manipulating the stylus of the PHANTOM device in proximity of a node is attracted to it through a simulated magnetic force. This is augmented with an auditory earcon (of a similar timbre to the one-element earcon used in the auditory view) which is triggered upon contact with the node. A similar magnetic effect is used for the links with the addition of a friction effect that simulates a different texture for solid, dotted and dashed lines. The user can thus trace the stylus across a line without deviating away to other parts of the plane while feeling the roughness of the line being traced, which increases from smooth for solid lines to medium and very rough for dotted and dashed lines respectively. Contact with links is also accompanied by one-element earcons with distinct timbres for each line style, and the labels of encountered nodes and links are also displayed in synthesised speech upon contact.
The 18th International Conference on Auditory Display (ICAD-2012)
Figure 3: Interacting with the spatial haptic view using the stylus of a PHANTOM Omni haptic device.
June 18–22, 2012, Atlanta, USA
like sound) and that it has been successfully dropped in the new location (the sound of a dart hitting a dartboard). Second, a haptic spring effect is applied, linking the current position of the stylus to the original position of where the item was picked up from. This allows the user to easily relocate the item to its original position without loosing orientation on the plane. Once an item is picked up, the user is automatically switched to the loose mode of interaction to allow for free movement while still able to inspect encountered items as their corresponding auditory feedback is displayed upon contact. Finally, we implemented a synchronisation mechanism to allow the user to switch between the haptic and auditory hierarchical views of the diagrams. The user can locate an item on the hierarchy then issue a command on the keyboard which would cause the PHANTOM arm to move and locate that item on the haptic plane. If the user is holding the stylus, they are then dragged to that location. Similarly, the user can locate an item on the virtual haptic plane then issue a command on the keyboard to locate it on the hierarchy. 3.4. Collaborative Interaction
Figure 4: Spatial haptic view (right) matching the physical layout of the diagram on the graphical view.
3.3.2. Audio-Haptic Interaction In addition to representing diagram content using various audiohaptic effects, we implemented two modes of interaction in the spatial haptic view which we refer to as sticky and loose. In a sticky mode of interaction, the magnetic attraction forces of the diagrams nodes and links are increased to make it harder for the user to snap away from contact with a given item. This simulates an impression of being “stuck” to the diagram content and thus one can trace its content by following the connections from point to point. In a loose mode of interaction on the other hand, the magnetic attraction forces are decreased such that a user can freely move around the virtual space without necessarily having to be in contact with any diagram content – in which case the haptic force is set to neutral and no auditory feedback is displayed. The magnetic attraction forces and friction effect in the haptic view were introduced as a direct result of prototyping with visually-impaired users who found this helpful in maintaining their current position or following connections in the diagram. Similarly, the auditory feedback provided to support the haptic view was chosen to be synergistic to that in the audio-only view and was used to provide confirmatory information which was not appropriate for haptic display. Additionally, the user has the ability to move nodes and bend links in space. This can be achieved by locating an item – or a point on a link – on the virtual plane, clicking on the stylus button to pick it up, dragging the stylus to another point on the plane, then dropping it in a new desired location with a second button click. We designed two extra features to support this drag-and-drop action. First, three distinct auditory icons are used to highlight that an item has been successfully picked up (a short sucking sound), that it is being successfully dragged in space (a continuous chain-
Simultaneous shared access to a diagram is currently achieved by connecting collaborators’ computers through a local network with one of the computers acting as a server. We have incorporated locking mechanisms which prevent collaborators from concurrently editing the same item on a diagram. Besides these locking mechanisms, the tool does not include any built-in mechanisms to regulate collaboration, such as process controls that enforce a specific order or structure of interaction. This was done to allow users to develop their own collaborative process when constructing diagrams – indeed, there is evidence that imposed structure can increase performance but at the expense of hindering the pace of collaboration and decreasing consensus and satisfaction amongst group members [20]. Thus, the cross-modal tool provides collaborators with independent views and unstructured simultaneous interaction with shared diagrams. 4. WORKPLACE STUDIES We are conducting an ongoing study of cross-modal collaboration between visually impaired and sighted coworkers. The aim is to explore the nature of cross-modal collaboration in the workplace and assess how well the tool we designed supports it in real world scenarios. So far, we have deployed the tool to support the work of three professional pairs; these were employees in the head office of a London-based Children and Families Department in local government, an international charity, and a private business. 4.1. Approach & Setup We first asked pairs to provide us with samples of the type of diagrams that they encounter in their daily jobs. We then created appropriate templates to accommodate these diagrams on the crossmodal tool. Because we wanted to observe the use of the tool in real world scenarios, involving diagrams of real world complexity, we did not control the type of tasks that the pairs performed nor the way in which they went about performing them. Rather, we deployed the tool in their workplaces and observed their collaborations as they naturally unfolded over a working session. Study sessions lasted for up to two hours, where we introduced the pairs
The 18th International Conference on Auditory Display (ICAD-2012)
to the features and functionalities of the tool in the first half, then observed them as they used it to access and edit diagrams in the second half. Visually-impaired participants used the audio-haptic views of the diagrams, where audio was displayed through speakers so that their colleagues could hear what they were doing, while the sighted participants used the graphical view of the tool. In all three cases, the pairs sat in a way that prevented the sighted participants from seeing the screen of their colleagues (see Figure 5), and, naturally, the visually impaired participants did not have access to the graphical view of their partners. We video recorded all sessions and conducted informal interviews with the pairs at the end of the working sessions 3 .
June 18–22, 2012, Atlanta, USA
5. DESIGN RECOMMENDATIONS FOR CROSS-MODAL COLLABORATION Due to the nature of the study – a small number of participants and uncontrolled workplace environments – we opted for conducting a qualitative analysis of the recorded interactions rather than attempt to capture quantitative aspects of the collaborations. We also focus on aspects of the cross-modal collaborative interaction rather than on the multimodal representation of diagrams. In the following, we present a series of excerpts from the video transcripts 4 to highlight the impact of using audio-haptic displays within the context of cross-modal collaboration and use these example to outline a set of preliminary design recommendations. 5.1. Extract 1: Exploring and Discussing Diagram Content
Figure 5: An example of the setup used in the workplace.
4.2. Collaborative Scenarios We observed two types of collaborative scenarios. The first pair, a manager and their assistant, accessed and edited organisation charts to reflect recent changes in managerial structures. The second and third pairs, a manager and an employee assistant and two business partners inspected and edited transportation maps in order to organise a trip. All pairs were able to complete the tasks that they chose to undertake using the cross-modal tool. Our initial observations showed that collaborations typically evolved over three distinct phases with differing dynamics of interaction. A first phase is characterised as being driven by the visually-impaired user and includes exploring the diagram, editing its content and altering its spatial arrangements. The sighted coworker in this instance typically engages in discussions about the diagram and providing general guidance about where things are located and how to get to them. In a second phase of the collaborations, the visually-impaired user continues to drive the interaction with active input from the sighted user who engages in refining the content and spatial arrangements produced by their coworker. In a third phase, both users engage in manipulating the diagram, working independently on different parts of its content while continuing to discuss the task and updating each other about their progress. These dynamics did not necessarily occur in a particular order. For instance, it is likely that the first phase results from the visually-impaired user’s desire to establish orientation within the interactive space at the onset of the collaboration, which might be unnecessary for the sighted user, but such reorientation might occur again after a diagram’s content has been extensively altered. 3 Example videos will be uploaded with the paper and/or shown during the conference presentation.
In the excerpt shown in Table 1, the pair are editing an itinerary on a transportation map. The excerpt starts off with the visuallyimpaired user (VI) locating and deleting a node from the diagram while the sighted user (S) edits the label of another node. As soon as the node is deleted, S interrupts VI to inform them about the visible changes that resulted from their action:“you didn’t just delete the node[..]”. Here the VI user was not aware that deleting a node caused the automatic deletion of the links that were coming in and out of it. The VI user responds with an exclamatory “yeah?” while manipulating the haptic device in an attempt to explore the parts of the diagram where the declared changes are said to have occurred. Meanwhile S continues to reason about the outcome of their partner’s action:“we can recreate the .. part of it needed to be deleted anyway” while the VI user switches to the audio view to check the diagram, correctly deducing the status of its nodes: “so it only deleted one node..”. What we wish to highlight with this excerpts is the way in which the auditory and haptic views were used in the exchange that occurred between the two colleagues. The VI user was able to seamlessly integrate the discussion about the diagram with their partner with the inspection and exploration of the its content. Here, the cross-modal tool formed and effective part of the collaborative exchange; that is, just as S was able to glance at the diagram while discussing and reasoning about its content, so was the VI able to access and explore the diagram while actively partaking in the discussion. Recommendation 1 – Provide explicit representation of the effects produced by a given action to its original author. While the sighted user was able to detect the results of an action as they occurred on the screen, this information was completely oblivious to the original author. It is therefore recommended to explicitly convey the consequences of an action to its original author in the non-visual view. This could also be conveyed in the form of a warning before finalising the execution of an action.
5.2. Extract 2: Providing Directional Guidance There were instances in the collaborations where the sighted user provided directional guidance to their partner while they were executing a given editing action. An example of this is shown in the excerpt in Table 2. Here, the pair are editing an organisation chart 4 Since the constructed diagrams were the property of the organisations that we worked with, we deliberately edited out some content and/or concealed it on the transcripts due to the sensitive nature of the information they contain.
The 18th International Conference on Auditory Display (ICAD-2012)
June 18–22, 2012, Atlanta, USA
Table 1: Extract 1: Smooth embedding of interaction with device and discussion about content. visually-impaired user
VI actions/audio output
Sighted user
S actions
OK, so now I need to
hold on a second
you didn’t just delete the node but also every line that was coming in and out of it we can recreate the ... part of it needed to be deleted anyway but one didn’t
what? yeah?
but that segment had to be removed didn’t it? let me just .. can i just look for a sec so it only deleted one node..
yeah, but every single line ..
Table 2: Extract 2: Directional guidance. visually-impaired user
VI actions/audio output
Sighted user
S actions
I’ve got X doesn’t let me go left it’s literally stopping me from going left diagonally up or down? from Y or from X?
then go diagonal left up left
up from X that’s the right link, follow Z
yeah I’m on ..
Table 3: Extract 3: Smooth transition between actions. visually-impaired user
VI actions/audio output
Sighted user
S actions
alright so I’m gonna move that now
yup
Table 4: Extract 4: Executing a spatial task. visually-impaired user OK, shall we try the others yes, X got ya I’m gonna put it down here somewhere What do you recon? I’m gonna put it here What do you think?
VI actions/audio output
Sighted user yup
I can’t see where you’re pointing, drop it first that is again on the same level as the Y
Table 5: Extract 5: Shared locus. VI actions/audio output
Sighted user’s actions
S actions
The 18th International Conference on Auditory Display (ICAD-2012)
June 18–22, 2012, Atlanta, USA
Table 6: Extract 6: Exchanging updates. visually-impaired user
yeah OK I’ve created the two ...
VI actions/audio output
and the visually-impaired user attempts to locate a node on the diagram using the haptic device. The excerpt begins with the VI user moving the device to locate the node in question, encountering an unexpected node X and announcing: “I got X”. The sighted user then uses this information to provide their colleague with relevant directions: “then go diagonal left”. The VI user attempts to follow their colleague’s guidance but, failing to go in the specified direction, seeks more clarification: “diagonally up or down?”, “from Y or from X?”. Moving around the haptic plan, the VI user encounters another item on the diagram; a link labelled Z. The sighted user picks up on the audio triggered by their partner to tailor the guidance they provide them with: “that’s the right link, follow Z”. This tailored guidance helps the VI user to locate the node in question. The fact that the audio output was shared amongst the pair helped the sighted user to engage with their partner’s activity. The overlap in presentation modalities in this case created more opportunities for interaction. Information displayed in audio allowed the sighted user to keep track of their partner’s progress and, by referring to the graphical view, they were able to map such information and tailor their own discourse to match such progress. 5.3. Extract 3: Transitions Between Collaborative Tasks The next excerpt, shown in Table 3, shows an example where collaborators executed two dependent actions sequentially. The VI user’s task was to create a link between two nodes on the diagram. To achieve this, the VI user first locates the two nodes in question, selects them, then issues a command to create a connection between them. The sighted user’s task was to arrange the spatial position of the newly created connection. What is noticeable in this excerpt is that the sighted user was able to determine the exact point in the execution where they were required to take action without being explicitly prompted by their partner: “alright so I’m gonna move that now”. Here again, having access to their partner’s audio output allowed the sighted user to keep track of their partner’s progress resulting in a seemingly effortless transition between the two dependent actions. Thus, allowing an overlap of presentation modalities helps users to structure sequentially dependent actions. Recommendation 2 – Allow an overlap of presentation modalities to increase opportunities for users to engage with each other’s actions during the collaboration.
5.4. Extract 4: Executing a Spatial Task A major advantage of using a spatial model of representation to support non-visual interaction with diagrams is the ability to execute spatial tasks. The visually-impaired users where able to not only add or remove content from the diagram but also engage
Sighted user
so I’m going though Y and Z just adding their details
S actions
with their sighted colleagues to alter content’s locations on the diagrams. The excerpt in Table 4 shows an example of this. Here, the VI user uses the omni device to locate a node on the diagram, picks up, drags it across the virtual plane and drops it in a new location. Notice how the VI user engages their sighted partner at each step in the execution of this spatial task by supplying cues about what they are doing: “yes, X, got ya”, “I’m gonna put it down here somewhere, what do you reckon?”. There is therefore a clear attempt by the VI user to use the spatial layout of the diagram as a common reference when negotiation execution steps with their partner. This was indeed a novelty that was well commended by all participants in our study. The sighted user in the excerpt, however, highlights and important point that contributed to his inability to fully engage with their partner to use this common frame of reference: “I can’t see where you’re pointing, drop it first”. Once the VI user drops the node in the new location it appears on the screen of the sighted user, who could then supply the relevant confirmations to their partner: “that is again on the same level as the Y”. Because the tool did not provide the users with any explicit representation of their partner’s actions – besides final outcomes – it was hard for them to fully engage with each other during execution. In the case of the excerpt on Table 4, the users compensate for this by supplying a continuous stream of updates of what they are about to do. Recommendation 3 – Provide a continuous representation of partner’s actions on the independent view of each user in order to increase their awareness of each other’s contributions to the shared space and hence improve the effectiveness of their collaborative exchange.
5.5. Extract 5: Shared Locus The excerpt shown in Table 5 does not involve any conversational exchange. However, the pair’s interaction with their independent views of the shared diagrams reveals another way in which the two representations were used as a shared locus. In this excerpt, the VI user has created a new node and is in the process of editing its label. Meanwhile, the sighted user moves his mouse and hovers over the node that is currently being edited by their partner then drags it to a new location. The interaction in this excerpt enforces recommendation 2. That is, allowing an overlap of presentation between the visual and audio-haptic display modalities allowed the sighted user to identify the part of the diagram being edited by their partner, to follow the editing process, and to seamlessly introduce their own changes to it (in terms of adjusting the location of the node). The VI user in turn, once finished with editing the label of the node, seamlessly synchronises their auditory and haptic views to explore the new location of the node as introduced by their partner. All of this is done smoothly without any need for verbal coordination.
The 18th International Conference on Auditory Display (ICAD-2012)
5.6. Extract 6: Exchanging Updates The final excerpt in Table 6 shows a different style of collaborative interaction. Instead of waiting for partners to finish executing an action before proceeding with an another, the pair in this excerpt are working in parallel on two independent actions. The VI user in this case is adding new nodes to the diagram and exploring its content using the auditory hierarchical view, while the sighted user is editing nodes parameters. The pair are working in parallel and updating each other about the editing actions that they are currently executing: “I’m going through Y and Z just adding their details”, “I’ve created the two..”. Each user is therefore engaged with their own task, and unless an update is supplied, the participants remain unaware of each others progress. Supplying awareness information while both users are jointly engaged with one task is different from supplying it when each one of them is engaged with an independent task. The former, as exemplified in Table 4 was in the form of updates about what the user intends to do, whereas in this excerpt it is in a form of what is currently occurring or what has taking place. Recommendation 4 – While providing a continuous representation of partner’s actions, as outline in Recommendation 3 above, care must be taking to choose the most relevant type of awareness information to provide. This changes in accordance with whether the collaborators are executing independent actions in parallel, or engaged in the same dependent tasks in sequence.
6. CONCLUSION We presented the design of a collaborative cross-modal tool for editing diagrams which we used to explore the nature of crossmodal collaboration between visually impaired and sighted users in the workplace. An ongoing study that we are conducting in the wild with real world collaborative scenarios allowed us to identify a number of issues related to the impact of cross-modal technology on collaborative work, including coherence of representation, collaborative strategies and support for awareness across modalities. We used our observations to outline an initial set of preliminary design recommendations aimed at guiding and improving the design of support for cross-modal collaboration. 7. REFERENCES [1] J. Driver and C. Spence, “Attention and the crossmodal construction of space,” Trends in Cognitive Sciences, vol. 2, no. 7, pp. 254 – 262, 1998. [2] F. Winberg, “Supporting cross-modal collaboration: Adding a social dimension to accessibility,” Haptic and Audio Interaction Design, pp. 102–110, 2006. [3] O. Metatla, N. Bryan-Kinns, T. Stockman, and F. Martin, “Designing for collaborative cross-modal interaction,” in Proceedings of Digital Engagement ’11: The 2nd Meeting of the RCUK Digital Economy Community, 2011. [4] RNIB, “Looking forward to 2014 rnibs strategy to end the isolation of sight loss,” 2009. [5] G. Kramer, Auditory Display: Sonification, Audification and Auditory Interfaces. Reading, MA, USA: Addison-Wesley Publishing Cmpany, 1994.
June 18–22, 2012, Atlanta, USA
[6] D. L. Mansur, M. M. Blattner, and K. I. Joy, “Sound graphs: A numerical data analysis method for the blind,” Journal of Medical Systems, vol. 9, no. 3, pp. 163–174, 1985. [7] E. D. Mynatt and G. Weber, “Nonvisual presentation of graphical user interfaces: contrasting two approaches,” in CHI ’94: Proceedings of the SIGCHI conference on Human factors in computing systems, Boston, Massachusetts, United States, 1994, pp. 166–172. [8] V. Best, A. Van Schaik, and S. Carlile, “Two-point discrimination in auditory displays,” in Proceedings of the 9th International Conference on Auditory Display (ICAD2003), E. Brazil and B. Shinn-Cunningham, Eds. Boston University Publications Production Department, 2003, pp. 17–20. [9] G. Weber, “Adapting direct manipulation for blind users,” in CHI ’93: INTERACT ’93 and CHI ’93 conference companion on Human factors in computing systems, Amsterdam, The Netherlands, 1993, pp. 21–22. [10] F. Avanzini and P. Crosato, “Haptic-auditory rendering and perception of contact stiffness,” in Haptic and Audio Interaction Design, vol. 4129/2006, 2006, pp. 24–35. [11] W. Yu, K. Kangas, and S. A. Brewster, “Web-based haptic applications for blind people to create virtual graphs,” in Haptic Interfaces for Virtual Environment and Teleoperator Systems, 2003. HAPTICS 2003. Proceedings. 11th Symposium on, March 2003, pp. 318–325. [12] G. Leplatre and S. Brewster, “Designing non-speech sounds to support navigation in mobile phone menus,” in Proceedings of the 6th International Conference on Auditory Display (ICAD2000), P. R. Cook, Ed., Atlanta, GA, USA, 2000. [13] E. D. Mynatt and K. W. Edwards, “The mercator environment: A nonvisual interface to x windows and unix workstations, Tech. Rep. GVU Tech Report GIT-GVU-92-05, 1992. [14] H. Petrie, C. Schlieder, P. Blenkhorn, G. Evans, A. King, A.-M. OˆaNeill, G. Ioannidis, B. Gallagher, D. Crombie, R. Mager, and M. Alafaci, “Tedub: A system for presenting and exploring technical drawings for blind people,” Computers Helping People with Special Needs, pp. 47–67, 2002. [15] O. Metatla, N. Bryan-Kinns, and T. Stockman, “Constructing relational diagrams in audio: the multiple perspective hierarchical approach,” in Assets ’08: Proceedings of the 10th international ACM SIGACCESS conference on Computers and accessibility, Halifax, Nova Scotia, Canada, 2008, pp. 97– 104. [16] A. Brown, S. Pettifer, and R. Stevens, “Evaluation of a nonvisual molecule browser,” in Assets ’04: Proceedings of the 6th international ACM SIGACCESS conference on Computers and accessibility, Atlanta, GA, USA, 2004, pp. 40–47. [17] F. Winberg and J. Bowers, “Assembling the senses: towards the design of cooperative interfaces for visually impaired users,” in CSCW ’04: Proceedings of the 2004 ACM conference on Computer supported cooperative work, 2004, pp. 332–341. [18] D. McGookin and S. A. Brewster, “An initial investigation into non-visual computer supported collaboration,” in CHI ’07: CHI ’07 extended abstracts on Human factors in computing systems, 2007, pp. 2573–2578.
The 18th International Conference on Auditory Display (ICAD-2012)
[19] O. Metatla, N. Bryan-Kinns, and T. Stockman, “Interactive hierarchy-based auditory displays for accessing and manipulating relational diagrams,” Journal on Multimodal User Interfaces, 2011. [20] J. S. Olson, G. M. Olson, M. Storrøsten, and M. Carter, “Groupwork close up: a comparison of the group design process with and without a simple group editor,” ACM Trans. Inf. Syst., vol. 11, no. 4, pp. 321–348, 1993.
June 18–22, 2012, Atlanta, USA