Jul 15, 2013 - arXiv:1307.3865v1 [cond-mat.stat-mech] 15 Jul 2013. Condensed Matter Physics, 2013, Vol. 16, No 2, 23605: 1â8. DOI: 10.5488/CMP.
Condensed Matter Physics, 2013, Vol. 16, No 2, 23605: 1–8 DOI: 10.5488/CMP.16.23605 http://www.icmp.lviv.ua/journal
arXiv:1307.3865v1 [cond-mat.stat-mech] 15 Jul 2013
Crossover scaling in the two-dimensional three-state Potts model T. Nagai1 , Y. Okamoto1,2,3,4 , W. Janke5,6 1 Department of Physics, Graduate School of Science, Nagoya University, Nagoya, Aichi 464–8602, Japan 2 Structural Biology Research Center, Graduate School of Science, Nagoya University, Nagoya,
Aichi 464–8602, Japan 3 Center for Computational Science, Graduate School of Engineering, Nagoya University, Nagoya, Aichi
464–8603, Japan 4 Information Technology Center, Nagoya University, Nagoya,
Aichi 464–8601, Japan 5 Institut für Theoretische Physik, Universität Leipzig, Postfach 100 920, 04009 Leipzig, Germany 6 Centre for Theoretical Sciences (NTZ), Universität Leipzig, Postfach 100 920, 04009 Leipzig, Germany
Received February 26, 2013, in final form April 19, 2013 We apply simulated tempering and magnetizing (STM) Monte Carlo simulations to the two-dimensional threestate Potts model in an external magnetic field in order to investigate the crossover scaling behaviour in the temperature-field plane at the Potts critical point and towards the Ising universality class for negative magnetic fields. Our data set has been generated by STM simulations of several square lattices with sizes up to 160×160 spins, supplemented by conventional canonical simulations of larger lattices at selected simulation points. We present careful scaling and finite-size scaling analyses of the crossover behaviour with respect to temperature, magnetic field and lattice size. Key words: three-state Potts model, phase transitions, critical phenomena, crossover scaling, Monte Carlo (MC) simulations, simulated tempering and magnetizing (STM) PACS: 64.60.De,75.30.Kz,75.10.Hk,05.10.Ln
1. Introduction The two-dimensional three-state Potts model in an external magnetic field [1, 2] has several interesting applications in condensed matter physics [2], and its three-dimensional counterpart serves as an effective model for quantum chromodynamics [3–6]. When one of the three states per spin is disfavoured in an external (negative) magnetic field, the other two states exhibit Z 2 symmetry and one expects a crossover from Potts to Ising critical behaviour. In the vicinity of the Potts critical point, another crossover effect takes place when approaching the critical point along different paths in the temperaturefield plane. To cover such a two-dimensional parameter space, generalized-ensemble Monte Carlo simulations are useful tools [7–10]. Well-known examples are the multicanonical (MUCA) algorithm [11, 12], the closely related Wang-Landau method [13, 14], the replica-exchange method (REM) [15, 16] (see also [17, 18]), also often referred to as parallel tempering, and simulated tempering (ST) [19, 20]. Inspired by recent multidimensional generalizations of generalized-ensemble algorithms [21–23], the “Simulated Tempering and Magnetizing” (STM) method has been proposed by two of us and tested for the classical Ising model in an external magnetic field [24, 25]. Recently, we have extended this new simulation method to the two-dimensional three-state Potts model and by this means generated accurate numerical data in the temperature-field plane [26]. Here we focus on a discussion of the two above mentioned crossover-scaling
© T. Nagai, Y. Okamoto, W. Janke , 2013
23605-1
T. Nagai, Y. Okamoto, W. Janke
scenarios that includes an analysis of the specific heat which especially for the Potts-to-Ising crossover provides the clearest signals. The rest of this article is organized as follows. In section 2 we briefly discuss the model and review the STM method. In section 3 we present the results of our crossover-scaling analyses at the phase transitions with respect to temperature, magnetic field and lattice size. Finally, section 4 contains our conclusions and an outlook to the future work.
2. Model and simulation method The two-dimensional three-state Potts model in an external magnetic field is defined through the Hamiltonian
H = E − hM , E =− M=
X
(2.1)
δσi ,σ j ,
(2.2)
〈i,j 〉
N X
δ0,σi ,
(2.3)
i=1
where N = L 2 denotes the total number of spins σi ∈ {0, 1, 2} arranged on the sites of a square L ×L lattice with periodic boundary conditions, δ is the Kronecker delta function and h is the external magnetic field. The sum in (2.2) runs over all nearest-neighbour pairs. Note that the magnetization M defined in (2.3) takes on the value M = N for the ordered state in 0-direction, M = 0 for the ordered states in 1- or 2-direction, and M = N /3 in the disordered phase. By mapping the integer valued spins σi to spin vectors ~ si = (cos(2πσi /3), sin(2πσi /3)) one readily P sees that E = (2/3)(− 〈i,j 〉 ~ si~ s j − N ) and M = (2/3)(M (x) + N /2), where M (x) is the component of the
~ = i~ magnetization vector M si in field direction (assumed to be along the x -axis). In this equivalent notation, it is fairly obvious that the Z 3 symmetry for h = 0 is broken to Z 2 for negative external magnetic fields (see figure 1). P
Figure 1. Schematic sketch illustrating the behaviour of the spins of the three-state Potts model in an external magnetic field h . For h > 0, the spin state 0 is favoured, whereas the states 1 and 2 are disfavoured. For h = 0, all three states are equivalent. For h < 0, the spin state 0 is disfavoured and the states 1 and 2 are related to each other by Z2 symmetry.
Another frequently employed definition of the magnetization is the so-called “maximum definition”
3 Mmax = N m max ≡ 2
(
max
"
N X
j =0,1,2 i=1
δ j ,σi
#
N − 3
)
,
(2.4)
which yields the physically more intuitive value of 1 when the system is in one of the three ordered phases and 0 in the disordered phase, respectively. Let us now turn to a brief description of the employed Monte Carlo simulation method. In the conventional ST scheme [19, 20], the temperature is considered as an additional dynamical variable besides the spin degrees of freedom. The STM method is a generalization to a two-dimensional parameter space 23605-2
Crossover scaling in the two-dimensional three-state Potts model
where the magnetic field is treated as the second additional dynamical variable similar to the temperature [24–26]. Here, one considers
e−(E −hM)/T +a(T,h)
(2.5)
as a joint probability for (x, T, h) (∈ X ⊗ {T1 , T2 , · · · , T NT } ⊗ {h1 , h2 , · · · , h Nh }), where a(T, h) is a parameter, x denotes a (microscopic) state, and X is the sampling space. We have set Boltzmann’s constant to unity. Note that the temperature and external field are discretized into NT and Nh values, respectively. A suitable candidate for a(Ti , h j ) can be obtained from the (empirical) probability of occupying each set of parameter values,
P (Ti , h j ) = e− f (Tk ,hl )+a(Tk ,hl ) ,
(2.6)
where e− f (Tk ,hl ) = dx e−(E −h j M)/Ti . This shows that the dimensionless free energy f (Ti , h j ) is the proper choice for a(Ti , h j ) in order to generate a uniform distribution of the number of samples according to T and h . This implies a random-walk-like evolution of T and h in STM simulations as it is demonstrated in figure 2 for a 80 × 80 lattice. The block structures reflect the first-order phase transition line at h = 0 in the Potts model and the second-order phase transition at the effective Ising transition temperature Tc ≈ 1.1346 for negative magnetic field.
R
2
1.5 1 0.5 0
h
T
1.5
1
-0.5 -1
0.5
-1.5 0
0.25
0.5
0.75
1
0
x106 MC sweeps
0.25
0.5
0.75
1
x106 MC sweeps
Figure 2. (Color online) Time history of temperature T and magnetic field h in STM simulations for the linear lattice size L = 80.
3. Results Our STM simulations were performed for lattice sizes L = 5, 10, 20, 40, 80, and 160 with the total number of sweeps varying between about 160 × 106 and 500 × 106 , with a sweep consisting of N single-spin updates with the heat-bath algorithm followed by an update of either the temperature T or the field h . We used the Mersenne Twister [27] as quasi-random-number generator. Statistical error bars were estimated using the jackknife blocking method [28–31]. Due to its random-walk-like nature, the STM method, combined with reweighting techniques such as WHAM [32–34] or MBAR [35], yields the density of states n(E , M) (up to an overall constant) in a wide range of the two-dimensional parameter space. Using these data it is straightforward to compute a two-dimensional map of any thermodynamic quantity that can be expressed in terms of E and M . As an 2 example, figure 3 shows the specific heat C = (〈E 2 〉−〈E 〉2)/T 2 and susceptibility χ = (〈Mmax 〉−〈Mmax 〉2 )/T per spin as functions of T and h p for L = 80. We see a line of phase transitions starting at the Potts critical point at h = 0, TcPotts = 1/ ln(1 + 3) = 0.9950 which, for strong negative magnetic fields, approaches the Ising
p
Ising model limit with the critical point at h → −∞, Tc = 1/ ln(1 + 2) = 1.1346. For all h < 0, the Z 3 symmetry of the 3-state Potts model in zero field is broken to Z 2 symmetry (recall figure 1) and by universality the critical behaviour is expected to be Ising-like. 23605-3
T. Nagai, Y. Okamoto, W. Janke
Figure 3. (Color online) (a) Specific heat per site C /L 2 and (b) magnetic susceptibility per site χ/L 2 as functions of T and h for L = 80. The solid vertical line corresponds to T = 1.1346, which is the critical temperature of the Ising model (in 2-state Potts model normalization).
For positive magnetic fields, the phase transition disappears altogether. However, for finite lattices and small h > 0, the singular behaviour persists to some extent due to finite-size effects. More precisely, the peaks of, e.g., the specific heat shown in figure 4, grow with an increasing lattice size L until L is larger than the (finite) correlation length of the system. This can be interpreted as a crossover in the dependence of field h and lattice size L .
Figure 4. (Color online) Specific heat per site C /L 2 as a function of T . With increasing system size L , the peaks become more pronounced [L = 5 (dashed red), 10 (dotted green), 20 (solid black), 40 (dash dotted purple), and 80 (solid blue)]. (a) h = 0.0, (b) h = 0.005, (c) h = 0.01, (d) h = 0.02.
To study, in the vicinity of the Potts critical point, the crossover-scaling behaviour in the T − h plane, we calculated the magnetization m = M/L 2 by reweighting. Its scaling form is given by [36]
m(T, h, L) = L −β/ν Ψ(t L y t , hL y h ) ,
(3.1)
where y t = 1/ν and y h = (β + γ)/ν are the usual scaling dimensions which can be expressed in terms of standard critical exponents. For easier reference, we have collected the exactly known critical exponents of the two-dimensional Ising and Potts models in table 1. The actually observed exponent depends on the precise path in which the critical point is approached in the T − h plane. According to the crossover 23605-4
Crossover scaling in the two-dimensional three-state Potts model
Table 1. Critical exponents for the two-dimensional Ising and three-state Potts models [ y t = 1/ν, y h = (β + γ)/ν] [2].
Model
yt
yh
α
β
γ
δ
ν
Ising Potts
1 6/5
15/8 28/15
0 (log) 1/3
1/8 1/9
7/4 13/9
15 14
1 5/6
scaling formalism [36] in the limit of an infinite lattice, if t −y h /y t h (in the Potts model t −14/9 h ) is small enough, then the magnetization obeys m ∼ t β (= t 1/9 ), and otherwise it scales as m ∼ h 1/δ (= h 1/14 ), where t = (Tc − T )/Tc . Figure 5 (a) shows that as long as finite-size effects are negligible (L 6/5 t ≫ 0.1) and t ≫ (h/6)9/14 (i.e., t −14/9 h is small), then the critical behaviour is m ∼ t 1/9 . Figure 5 (b) shows that if finite-size effects are negligible (L 28/15 h ≫ 0.1) and t ≪ (h/6)9/14 (i.e., t −14/9 h is large), then the critical behaviour is m ∼ h 1/14 . Thus, figure 5 clearly demonstrates that the line h = 6t 14/9 gives the boundary of the two scaling regimes.
Figure 5. (Color online) The difference between magnetization and its expected scaling behaviours around the critical point for L = 80. Shown are (a) |mL 2/15 − 1.2(L 6/5 t)1/9 | where the amplitude 1.2 was obtained by fitting the magnetization data to t 1/9 and (b) |mL 2/15 −(L 28/15 h)1/14 |. In both plots, the solid line corresponds to h = 6t 14/9 .
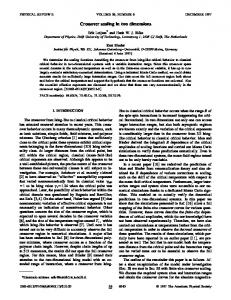
Since the three-state Potts model in a negative magnetic field is expected to behave like the Ising model, we also investigated the crossover behaviour between these two models using finite-size scaling techniques. For the susceptibility maximum χ/L 2 |max ∝ L γ/ν , the finite-size scaling exponents of the Potts and Ising model are given by γ/ν = 26/15 = 1.7333. . . and 7/4 = 1.75, respectively. Figure 6 shows that the exponents are so similar that we can hardly distinguish the difference, despite the accuracy of the measurements. The difference is much more pronounced for the maxima of the specific heat which are expected to scale with the system size L with an exponent α/ν = 2/5 for the Potts and α/ν = 0, i.e., logarithmically, for the Ising model. We also measured different quantities, which are the maximum values of
2 〉 d ln〈U2 〉 d ln〈U4 〉 d ln〈m max 〉 d ln〈m max , , dβ , dβ , dβ dβ
and
d〈m max 〉 dβ .
Here, U 2 = 1 −
2 〈mmax 〉 3〈m max 〉2
are the Binder cumulants [37]. The derivatives were obtained by using [38] k 〉 d ln 〈m max
and U 4 = 1 −
4 〈mmax 〉
2 3〈m max 〉
k 〈m max E〉
, k 〉 〈m max ( ) k 2k 〉 2k 〈m max 〈m max E 〉 〈m max E〉 d ln 〈U 2k 〉 〈E 〉 − 2 = + , k 〉 2k 〉 k 〉2 dβ 〈m max 〈m max 3〈m max d 〈m max 〉 = 〈m max 〉 〈E 〉 − 〈m max E 〉 . dβ dβ
= 〈E 〉 −
Figure 6 shows our results. Note that
2
(3.2)
(3.3) (3.4)
2 d ln〈m max 〉 d ln〈U4 〉 d ln〈m max 〉 2〉 |max , |max , d ln〈U dβ dβ dβ |max , dβ |max ,
and
23605-5
T. Nagai, Y. Okamoto, W. Janke d〈m max 〉 dβ |max
are expected to behave asymptotically as L 1/ν , L 1/ν , L 1/ν , L 1/ν , and L (1−β)/ν , respectively, as the lattice size L increases [31]. These critical exponents are given for the Potts model by 1/ν = 6/5 and (1 − β)/ν = 16/15, and for the Ising model by 1/ν = 1 and (1 − β)/ν = 7/8 (see table 1). We observe that all quantities for h = 0 (red curve with filled circles) follow the Potts case and that those for negative external field (green curve with filled up triangles and blue curve with filled down triangles) follow the Ising case in the limit of large L . In fact, the two curves for h = −0.5 and h = −1.0 converge into almost the same line as L increases. On the other hand, the (green) curve for h = −0.5 exhibits greater deviation from the scaling behaviour for small L . This can also be understood as another crossover effect governed by h and L .
Figure 6. (Color online) Finite-size scaling behaviour of χmax , C max , three characteristic h values.
d〈m max 〉 d ln〈U4 〉 |max , and |max for dβ dβ
4. Conclusions In this work, we reported the scaling and finite-size scaling analyses of the two-dimensional threestate Potts model in a magnetic field based on the data generated using the Simulated Tempering and Magnetizing (STM) method [24, 25]. In such simulations, the random walk in temperature and magnetic field covers a wide range of these parameters so that STM simulations enable one to study crossover phenomena with a single simulation run [26]. By this means we calculated the magnetization, susceptibility, energy, specific heat and related quantities as functions of temperature, magnetic field, and lattice size around the critical point using reweighting techniques. These data allowed us to extract the crossover behaviours of phase transitions. First, at the Potts critical point for h = 0, we observed a clear crossover of the scaling behaviour of the magnetization with respect to temperature and magnetic field. Second, from an analysis of the specific heat and 23605-6
Crossover scaling in the two-dimensional three-state Potts model
other quantities, a crossover in the scaling laws with respect to (negative) magnetic field and lattice size was identified, thereby verifying the expected crossover from 3-state Potts to Ising critical behaviour. The data of the present work yield the two-dimensional density of states n(E , M) (up to an overall constant) which determines the weight factor for two-dimensional multicanonical simulations. We hence can also perform two-dimensional multicanonical simulations, which will be an interesting future task. As a final remark we should like to stress that the present method is useful not only for spin systems as considered here but also for other complex systems with many degrees of freedom. Since our method does not require any change of the frequent, rather intricate energy calculations, it should be highly compatible with the available program packages.
Acknowledgements We thank the Information Technology Center, Nagoya University, the Research Center for Computational Science, Institute for Molecular Science, and the Supercomputer Center, Institute for Solid State Physics, University of Tokyo, for computing time on their supercomputers. This work was supported, in part, by JSPS Institutional Program for Young Researcher Overseas Visit (to T.N.) and by Grants-in-Aid for Scientific Research on Innovative Areas (“Fluctuations and Biological Functions") and for the Computational Materials Science Initiative from the Ministry of Education, Culture, Sports, Science and Technology, Japan (MEXT). W.J. gratefully acknowledges support by DFG Sonderforschungsbereich SFB/TRR 102 (Project B04) and the Deutsch-Französische Hochschule (DFH-UFA) under Grant No. CDFA–02–07. T.N. also thanks the Nagoya University Program for “Leading Graduate Schools: Integrative Graduate Education and Research Program in Green Natural Sciences” for support of his extended stay in Leipzig.
References 1. Potts R.B., Math. Proc. Cambridge Philos. Soc., 1952, 48, 106–109; doi:10.1017/S0305004100027419. 2. Wu F.Y., Rev. Mod. Phys., 1982, 54, 235–268; doi:10.1103/RevModPhys.54.235. 3. Philipsen O., In: 29th Johns Hopkins Workshop on Current Problems in Particle Theory: Strong Matter in the Heavens (Budapest 2005), PoS (JHW2005), 012. 4. Kim S., De Forcrand P., Kratochvila S., Takaishi T., Preprint arXiv:hep-lat/0510069, 2005. 5. Karsch F., Stickan S., Phys. Lett. B, 2000, 488, 319–325; doi:10.1016/S0370-2693(00)00902-3. 6. Mercado Y.D., Evertz H.G., Gattringer C., Comput. Phys. Commun., 2012, 183, 1920–1927; doi:10.1016/j.cpc.2012.04.014. 7. Janke W., Physica A, 1998, 254, 164–178; doi:10.1016/S0378-4371(98)00014-4. 8. Hansmann U.H.E., Okamoto Y., In: Annual Reviews of Computational Physics VI, World Scientific, Singapore, 1999, p. 129–157. 9. Mitsutake A., Sugita Y., Okamoto Y., Biopolymers, 2001, 60, 96–123; doi:10.1002/1097-0282(2001)60:23.0.CO;2-F. 10. Rugged Free Energy Landscapes: Common Computational Approaches to Spin Glasses, Structural Glasses and Biological Macromolecules, Lect. Notes Phys., Vol. 736, Janke W., (Ed.), Springer, Berlin, 2008. 11. Berg B.A., Neuhaus T., Phys. Lett. B, 1991, 267, 249–253; doi:10.1016/0370-2693(91)91256-U. 12. Berg B.A., Neuhaus T., Phys. Rev. Lett., 1992, 68, 9–12; doi:10.1103/PhysRevLett.68.9. 13. Wang F., Landau D.P., Phys. Rev. Lett., 2001, 86, 2050–2053; doi:10.1103/PhysRevLett.86.2050. 14. Wang F., Landau D.P., Phys. Rev. E, 2001, 64, 056101; doi:10.1103/PhysRevE.64.056101. 15. Hukushima K., Nemoto K., J. Phys. Soc. Jpn., 1996, 65, 1604–1608; doi:10.1143/JPSJ.65.1604. 16. Geyer C.J., In: Computing Science and Statistics, Proceedings of the 23rd Symposium on the Interface, Keramidas E.M. (Ed.), Interface Foundation of North America, 1991, p. 156–163. 17. Swendsen R.H., Wang J.-S., Phys. Rev. Lett., 1986, 57, 2607–2609; doi:10.1103/PhysRevLett.57.2607. 18. Wang J.-S., Swendsen R.H., Prog. Theor. Phys. Supp., 2005, 157, 317–323; doi:10.1143/PTPS.157.317. 19. Lyubartsev A.P., Martsinovski A.A., Shevkunov S.V., Vorontsov-Velyaminov P.N., J. Chem. Phys., 1992, 96, 1776– 1783; doi:10.1063/1.462133. 20. Marinari E., Parisi G., Europhys. Lett., 1992, 19, 451–458; doi:10.1209/0295-5075/19/6/002. 21. Mitsutake A., Okamoto Y., Phys. Rev. E, 2009, 79, 047701; doi:10.1103/PhysRevE.79.047701. 22. Mitsutake A., Okamoto Y., J. Chem. Phys., 2009, 130, 214105; doi:10.1063/1.3127783. 23. Mitsutake A., J. Chem. Phys., 2009, 131, 094105; doi:10.1063/1.3204443.
23605-7
T. Nagai, Y. Okamoto, W. Janke
24. Nagai T., Okamoto Y., Phys. Rev. E, 2012, 86, 056705; doi:10.1103/PhysRevE.86.056705. 25. Nagai T., Okamoto Y., Physics Procedia, 2012, 34, 100–104; doi:10.1016/j.phpro.2012.05.016. 26. Nagai T., Okamoto Y., Janke W., J. Stat. Mech: Theory Exp., 2013, P02039; doi:10.1088/1742-5468/2013/02/P02039. 27. Matsumoto M., Nishimura T., ACM Transactions on Modeling and Computer Simulation (TOMACS), 1998, 8, 3–30; doi:10.1145/272991.272995. 28. Miller R.G., Biometrika, 1974, 61, 1–15; doi:10.1093/biomet/61.1.1. 29. Efron B., The Jackknife, the Bootstrap, and Other Resampling plans. Society for Industrial and Applied Mathematics [SIAM], Philadelphia, 1982. 30. Berg B.A., Markov Chain Monte Carlo Simulations and Their Statistical Analysis, World Scientific, Singapore, 2004. 31. Janke W., Lect. Notes Phys., 2008, 739, 79–140; doi:10.1007/978-3-540-74686-7_4. 32. Ferrenberg A., Swendsen R., Phys. Rev. Lett., 1989, 63, 1195–1198; doi:10.1103/PhysRevLett.63.1195. 33. Kumar S., Bouzida D., Swendsen R.H., Kollman P.A., Rosenberg J.M., J. Comput. Chem., 1992, 13, 1011–1021; doi:10.1002/jcc.540130812. 34. Kumar S., Rosenberg J.M., Bouzida D., Swendsen R.H., Kollman P.A., J. Comput. Chem., 1995, 16, 1339–1350; doi:10.1002/jcc.540161104. 35. Shirts M.R., Chodera J.D., J. Chem. Phys., 2008, 129, 124105; doi:10.1063/1.2978177. 36. Fisher M.E., Rev. Mod. Phys., 1974, 46, 597–616; doi:10.1103/RevModPhys.46.597. 37. Binder K., Z. Phys. B: Condens. Matter, 1981, 43, 119–140; doi:10.1007/BF01293604. 38. Janke W., In: Order, Disorder and Criticality: Advanced Problems of Phase Transition Theory, Vol. 3, Holovatch Yu. (Ed.), World Scientific, Singapore, 2012, p. 99–166.
Скейлiнґ кросоверу у двовимiрнiй тристановiй моделi Поттса Т. Нагаi1 , Ю. Окамото1,2,3,4 , В. Янке5,6 1 Вiддiл фiзики, унiверситет м. Нагоя, Нагоя, Айчi 464–8602, Японiя 2 Центр дослiджень структурної бiологiї, унiверситет м. Нагоя, Нагоя, Айчi 464–8602, Японiя 3 Центр комп’ютерних наук, унiверситет м. Нагоя, Нагоя, Айчi 464–8602, Японiя 4 Центр iнформацiйних технологiй, унiверситет м. Нагоя, Нагоя, Айчi 464–8602, Японiя 5 Iнститут теоретичної фiзики, унiверситет Ляйпцiгу, 04009 м. Ляйпцiг, Нiмеччина 6 Центр теоретичних природничих наук (NTZ), унiверситет Ляйпцiгу, 04009 Ляйпцiг, Нiмеччина
Ми застосовуємо Монте Карло симуляцiї з симульованим темперуванням i намагнiченням (STM) до двовимiрної тристанової моделi Поттса у зовнiшньому магнiтному полi для того, щоб дослiдити кросоверну скейлiнгову поведiнку у площинi температура-поле при критичнiй точцi Поттса, а також клас унiверсальностi моделi Iзинга для негативних магнiтних полiв. Набiр наших даних був згенерований STM симуляцiями декiлькох квадратних ґраток розмiром до 160 × 160 спiнiв, доповненими звичайними канонiчними симуляцiями бiльших ґраток при вибраних симуляцiйних точках. Ми представляємо ретельний аналiз скейлiнгу i скiнченомiрного скейлiнгу кросоверної поведiнки по вiдношенню до температури, магнiтного поля i розмiру ґратки. Ключовi слова: тристанова модель Поттса, фазовi переходи, критичнi явища, скейлiнг кросоверу, симуляцiї Монте Карло, симульоване темперування i намагнiчення (STM)
23605-8
dln/dβ|max
1000
100
h=0 h=-0.5 h=-1.0 6/5 -0.053+0.45L 1.3+0.33L 0.79+0.33L
10
1 10
100 L
1000
2 dln/dβ|max
1000
100 h=0 h=-0.5 h=-1.0 6/5 -0.085+0.79L 2.3+0.63L 1.7+0.58L
10
1 10
100 L
1000
dU2/dβ|max
100
10
h=0 h=-0.5 h=-1.0 (6/5) -0.035+0.058L 0.16+0.019L 0.11+0.018L
1
0.1 10
100 L
1000