Author manuscript, published in "3D Image Processing and Applications, San José : United States (2010)"
Crosstalk measurement and mitigation for autostereoscopic displays Marcus Barkowskya, Patrizio Campisib, Patrick Le Calleta, Vito Rizzoab b Dipartimento di Elettronica Applicata, Università degli Studi “Roma Tre”, Roma, Italy e-mail:
[email protected], Tel.: +39 06 55177064, Fax. +39 06 55177026 a
Polytech’Nantes, University of Nantes, IRCCyN Lab. Rue Christian Pauc, BP 50609, 44306 Nantes, France. e-mail:
[email protected], Tel: +33.2.40.68.32.00, Fax: +33.2.40.68.32.32
hal-00466863, version 1 - 25 Mar 2010
ABSTRACT In this paper we address the problem of crosstalk reduction for autostereoscopic displays. Crosstalk refers to the perception of one or more unwanted views in addition to the desired one. Specifically, the proposed approach consists of three different stages: a crosstalk measurement stage, where the crosstalk is modeled, a filter design stage, based on the results obtained out of the measurements, to mitigate the crosstalk effect, and a validation test carried out by means of subjective measurements performed in a controlled environment as recommended in ITU BT 500-11. Our analysis, synthesis, and subjective experiments are performed on the Alioscopy® display, which is a lenticular multiview display. Keywords: 3D Digital Signal Processing, Autostereoscopic Display, Lenticular array Display, Crosstalk
1. INTRODUCTION A 3D imaging system tries to mimic the behavior of the human visual system by using stereo cameras which capture a scene from slightly different positions. A 3D rendering system presents two slightly different images to the left and the right eye in such a way that the human visual system gets a perception of depth due to stereopsis. More in detail, the 3D rendering systems can be classified as either stereoscopic, which require viewing glasses such as anaglyphic lenses, polarized glasses for passive systems, or liquid crystal shutter glasses for active systems, or autostereoscopic displays, where the 3D effect is reproduced by using a set of images each of which can be seen from a particular viewing angle. The image selection can be performed by means of a different number of techniques, like parallax barriers and lenticular lenses. In this paper we focus on the crosstalk effect in autostereoscopic displays. Crosstalk refers to the perception of one or more unwanted views in addition to the desired one [1]. The crosstalk effect has been investigated for autostereoscopic displays in [2] where it has been pointed out that the crosstalk can be beneficial in some circumstances. A methodology to measure the crosstalk effect with a camera in dependence of the viewing angle has been demonstrated in [3]. In [4] the authors demonstrated the measurement and the reduction of crosstalk on a time-sequential 3D display with shutter glasses using a CRT display. They used a psychophysical comparison experiment to measure the crosstalk and they subtracted the unintended crosstalked signal from the displayed signal in order to reduce the crosstalk. The calculations have been done in terms of pixel values. It was reported in [5] that crosstalk of up to 15% does not have an effect on visual strain and perceived depth. However, the visual quality perceived by the observers might be affected as a pretest showed. In autostereosopic displays, the amount of crosstalk is related to the displayed disparity. For a disparity of zero, i.e. objects that appear in the display plane, the crosstalk may actually lead to an enhanced spatial resolution or at least to a higher brightness as was mentioned in [2]. The larger the disparity gets, the more the content of adjacent views differs spatially and thus the more
ghosting is perceived. With high frequency content, the ghosting may even lead to a loss of the 3D effect because the observer fails to fuse the views. This may be seen as one reason why some displays apply lowpass filtering to objects which was investigated by the authors previously [6]. Autostereosopic lenticular displays split the native resolution of the displays into a number of views. Each subpixel, e.g. the red, green and blue component of each pixel, belongs to a different view. One advantage of the Alioscopy® display is that the subpixel allocation scheme has been published [7]. This allows specifying exactly the content that is displayed on each view enabling the research presented in this paper. The paper follows the three basic steps that were necessary: In Section 2 the measurement of the crosstalk is performed. The parameterized algorithm for the crosstalk mitigation is explained in Section 3. An extensive subjective experiment has been conducted to assess the performance of the proposed filter algorithm. The observers voted for their preference in terms of Quality of Experience (QoE). The setup and the results are explained in Section 4. Conclusions are drawn in Section 5.
2. MEASUREMENT OF CROSSTALK
hal-00466863, version 1 - 25 Mar 2010
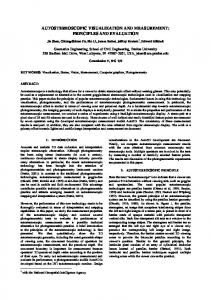
The measurement was performed by means of a subjective comparison experiment. The display was calibrated with an XRite i1display calibration device. The sharpness parameter of the display was set to zero in order to avoid clipping at high luminance values. If not otherwise noted, the explanations assume monocular viewing. Throughout the measurements one eye was always covered by a plastic eye shield. The Alioscopy® screen has eight distinct views which will be termed view 1 to view 8 in the following. The display has a native viewing distance of 4m that results from the opening angle of the viewing cones. At other distances, the viewer sees several views at the same time at different spatial locations, e.g. on the left of the screen view 4 and view 5 on its right side. The observer looked through a tube of 30cm length and a radius of 2.5cm which was installed at a comfortable viewing height. At the start of the measurement, the tube was aligned by the observer in order to perceive only one specific view number and it was fixed afterwards. In the following explanation, it will be assumed that view 4 is seen by the observer. A sketch of the setup is shown on the left side of Figure 1a. The sketch also indicates the position of the viewing cones or views. In order to address the view positions, the content of each of the eight views has to be combined into a single HDTV image. This mixing step is explained in detail in [7]. For the first part of the experiment, a diagonal bar test pattern with a uniform border was used as displayed in Figure 1b. The test pattern has 3 distinct brightness values and it was displayed on at least 2 of the 8 views but with different brightness settings for each view as follows. For the alignment of the gaze directing tube, the test pattern was displayed on view k=4 with a white border y4b=255 and on all other views the border was left black. Display
Views Tables d=4m 1876543218
Tube
yka
ykc
Observer
(a)
(b)
Figure 1: Experiment room setup (a) and displayed test pattern (b)
ykb
In the first experiment, two views were used: View 4 and one of its adjacent views, for example view 5. For the adjacent view, y5a=0 was set and y5c ∈ { 0,32,...,224 } was selected in a random permutation. For the central view,
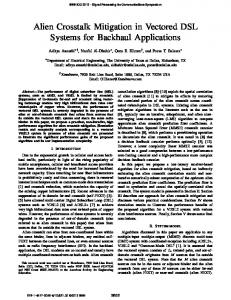
y 4c ∈ { 0,32,...,192 } was again randomly set. The observer was asked to interactively adjust y4a by using up/down keys in order to obtain a homogeneous gray screen. The difference between the selected value and y4c indicated the equivalent brightness of the central screen for the crosstalk perceived from the adjacent view. In Figure 2a, an example is shown. The measured data is plotted in pixel values showing the relationship between y5c and y4c as inputs on the x- and y-axis and the chosen value for y4a on the z-axis. It can be seen that on the left side of the mesh plot, the input and the output are linear with a gradient close to one. This corresponds to the situation, when there is no luminance from the adjacent view and the observer only chooses the matching value for the gray bars on the same screen. The right edge of the mesh grid shows the situation, when the only light source is coming from the crosstalk of the adjacent view. It can be seen that the amount of luminance corresponds to a value of up to 92 thus 36% of the available 8 bit range.
hal-00466863, version 1 - 25 Mar 2010
In order to see the amount of crosstalk, it is necessary to convert the digital values into physical luminance values, e.g. measured in candela per square meter as shown in Figure 2b. The x- and y-axis are unchanged; the z-axis now displays the crosstalk, e.g. the difference between the expected luminance from the current view y4c and the choice of the observer y4a. The surface is approximately flat except for measurement noise and clipping effects at the farthest corner. Please note that part of the measurement noise is due to the logarithmic quantization of luminance that results from the linear quantization of eight bit for the display’s input signal. The crosstalk that is seen in Figure 2b can be modeled in a first approximation by a single degree of freedom which is the gradient of the plane. It is mandatory that the plane is fixed at zero as there should be no crosstalk when there is no light coming from the adjacent view. A least mean squares fit for several observers was used to determine the gradient for the crosstalk. It indicates the attenuation of light energy that can be seen from an adjacent view, in this case from view 4 when view 5 is illuminated. The gradient is stored in a two-dimensional matrix A which is indexed by the views, in this case a45=0.1
(a)
(b)
Figure 2: Measured Crosstalk from one adjacent view: (a) resulting observer choice in dependence of displayed pixel values and (b) amount of crosstalk measured in luminance for displayed luminances Several experiments were performed by using the described setup. They indicated that the gradient does not depend on the view numbers, e.g. the crosstalk is symmetric and view independent. Moreover, it was verified that the crosstalk is additive in the luminance domain, e.g. light emitted by the two adjacent views is perceived equal to light emitted by only one adjacent view at twice the luminance level. The measurement was also performed on views that were disconnected, e.g. by looking at view 4 while illuminating view 6, 7 or 8. For each measurement the gradient was calculated.
The amount of perceived luminance Lvp for each view v can thus be generated by using the displayed luminance in each view Lvd by multiplication with the corresponding gradient. By using the two vectors Lp = [ L1p, L2p, … L8p] T and Ld = [L1d, L2d, … L8p] T, the matrix of gradients A and the 8x8 identity matrix as E the crosstalk can be modeled as:
L p = ( E + A) ⋅ L d
(1)
The measurement on the display led to the following circulant Toeplitz matrix for the approximated crosstalk coefficients:
A=
0
0 .1
0.01
0.1
0.005
0 .1
0.01
0 .1
0
0.1
0.01
0 .1
0.005
0 .1
M
M
M
M
M
M
M
0 .1
0.01
0.1
0.005
0 .1
0.01
0 .1
0.1 0.01 M 0
(2)
hal-00466863, version 1 - 25 Mar 2010
3. REDUCTION OF CROSSTALK In order to reduce the crosstalk, it is advantageous to work in the luminance domain because the operations stay linear. The computation of luminance from the digital input values usually requires several steps and a detailed knowledge about the display used, e.g. its white point, gamma value, reflectance and maximum brightness [8,9]. However, for simplification of the implementation it was decided to use only the gamma curve and to process the red, green and blue component independently. This simplification is mainly possible because the relevant steps of the algorithm are linear. Taking the red component for an input pixel ri as an example, and knowing that the display was calibrated with γ = 2.2 , the luminance for red was calculated as: γ
r Lri = i 255
(3)
The generic reduction of crosstalk can be directly derived from Eq. 1. Because Lp represents the luminance that it appears after the crosstalk, it resembles what the viewer perceives. Conversely, Lp should contain the information of Li that was intended for display to the viewer. The signal that is displayed on the screen is represented by Ld and can be adjusted in order to improve the quality. Accordingly, the luminance that should be sent to the display can be calculated by rewriting Eq. 1 to
Lrd = ( E + A) −1 ⋅ L ri
(4)
The implementation of this obvious solution fails because the display can only represent a certain range of values. In particular, due to the structure of the crosstalk matrix A, negative values for Lrd occur frequently, indicating that the amount of crosstalk from other views is larger than the value that should be displayed. Three solutions are proposed which can be used in any combination. The first solution is to avoid negative values for Ld by shifting and compressing the input value range Li. Thus, a footroom of displayable luminance is created that allows for virtually negative luminance values. This operation is done on the 8 bit input data values rather than on the luminance signal because the compression and shift leads to less visual distortions. The parameter β denotes the shift in terms of black level on the 8 bit input data in
Lrd
r ⋅ (255− β ) + 255⋅ β = ( E + A) ⋅ i 2552 −1
γ
(5)
The advantage of this approach is that even in high contrast areas, the crosstalk can be reduced. The disadvantage is that the contrast of the image is reduced which results in a poor image quality. As was mentioned earlier the crosstalk from a single view already reaches 36% of the available input range. In order to eliminate the crosstalk even in the worst case β = 173 has to be chosen.
The second solution is a best-effort crosstalk reduction. By introducing a multiplicative factor α ∈ [0,1] for the crosstalk coefficient matrix, the amount of crosstalk reduction can be controlled and negative values can be avoided. Eq. 4 thus becomes:
Lrd = ( E + αA) −1 ⋅ L ri
(6)
The factor α depends on the input vector Lri and thus changes for each pixel. The advantage of this solution is that it can always be applied. The disadvantage is that it fails to reduce the crosstalk especially in image regions where a high contrast is perceived. Unfortunately, those regions suffer particularly from crosstalk as the human visual system relies on edges for the estimation of depth by stereopsis. The third solution is to allow for a certain interval of virtually negative luminance values. As the values cannot be displayed on the screen, they are mapped to zero. The implementation results in an enhancement of the second solution. The factor α in Eq. 6 is chosen iteratively in order not to exceed the allowed interval. The lower luminance threshold is termed Lmin. The advantage of this solution is that it can be applied in high-contrast areas. The disadvantage is that for large values of Lmin artifacts can be seen.
hal-00466863, version 1 - 25 Mar 2010
A block diagram of the complete algorithm that combines all three solutions is shown in Figure 3. The algorithm simplifies for example to the first solution if Lmin is set to zero and β = 0 . As the algorithm is applied to each color component of each pixel, for performance reasons a fixed set of 17 matrices was computed as
C x = (E +
x A) −1 with x ∈ [0,1,...16] 16
(7)
γ
r ⋅ ( 255− β ) + 255⋅ β Lri = i 2552
x = 16
Lrd = C x ⋅ Lri
x = x +1
no
min( Lrd ) >= − Lmin
yes 1 rd = Lrd ( γ ) ⋅ 255
Figure 3: Block diagram for the reduction of crosstalk
4. SUBJECTIVE EXPERIMENT The algorithm has two parameters: the dark level increase β and the minimum allowed but clipped luminance Lmin. The preference of the observers for the choice of these parameters was evaluated in a subjective experiment. The test was
performed on still images which were displayed by a PC on the calibrated Alioscopy screen. As the difference between parameters was sometimes very subtle, a paired comparison method was used. Using a side-by-side comparison was dismissed because the display is very sensitive to the observers viewing angle, e.g. there may always be less crosstalk on the left side of the display. Instead, the paired comparison method was implemented by viewing one image at a time with the observer being able to switch freely between the two images before giving his pinion.
hal-00466863, version 1 - 25 Mar 2010
It was anticipated from [2] that the amount of disparity would influence the decision of the subjects in the way that less crosstalk reduction might be preferred for small disparities. When using 3D images, each image would contain different levels of depth and it would be difficult to provide a systematic analysis. Thus, 2D images were displaced in depth by setting the disparity of the complete image to a specific value. When displayed on the screen, the image appeared to be moved in front or in the back of the screen. Five different disparities were used, starting from 12 pixels crossed disparity to 18 pixels uncrossed disparity with a step size of 6; zero disparity was not included. Correspondingly, the image appeared to be 31cm or 16cm in front of the screen or 18cm, 37cm or 59cm behind it.
Chinatown
Crowdrun
Game
Gate
Rennes Figure 4: Test images
Yamaha
The six images used in the experiment are shown in Figure 4. They were selected based on their features, e.g. spatial frequency, contrast, and brightness. Additionally, several types of content were represented, e.g. text, faces and computer generated content. The size of the source images is 960x1080 pixels, a gray border was added and the images were centered in the middle of the screen. The crosstalk reduction algorithm features two free parameters which were evaluated with two values each, resulting in four conditions. The image without any crosstalk reduction was included in order to provide a reference. Following the notation used by the Video Quality Experts Group (VQEG) in their testplans, e.g. [10], those five conditions will be termed Hypothetical Reference Circuits (HRC) and they are summarized in Table 1.
Table 1: Evaluation of algorithm parameters HRC Lmin β 0 Reference 1 0 0 2 0 20 3 20 0 4 20 20 In total, the subjective experiment contained 6 contents, 5 contents and 5HRCs, thus 150 different images. They were evaluated in 300 paired comparisons per observer. The experiment was performed with 31 naïve observers.
hal-00466863, version 1 - 25 Mar 2010
Table 2 shows the percentage of preference for each algorithm to each other algorithm. The last column shows the mean value of the preference for each algorithm. The most often preferred algorithm is HRC3 which outperforms the reference, HRC1 and HRC2 in more than 90% of the presentations and HRC4 still in 76%. Accordingly HRC4 is the second best, followed by HRC1.
HRC0 HRC1 HRC2 HRC3 HRC4
Table 2: Preference of Algorithms in percent HRC0 HRC1 HRC2 HRC3 HRC4 Mean Preference 17 46 5 19 22 83 82 5 46 54 54 18 8 4 21 95 95 92 76 90 81 54 96 34 66
The votes have also been analyzed using the Thurstone case 4 model according to [11,12]. The Thurstone analysis assumes a Gaussian distribution for the observer’s opinion on each HRC. Based on the paired comparisons, the distance between each of the HRCs is calculated and transformed into a scale value. Consequently, the paired comparison results can be seen as the outcome of a statistical experiment on the Gaussian distributions. The Thurstone scale values and their 95% confidence intervals for the HRC evaluation are shown in Figure 5. The analysis shows the same ranking and the 95% intervals indicate that the quality difference was significant except for HRC0 and HRC2. In Figure 6 the details for each disparity level are given. Although the difference between the algorithm in HRC4 and the reference HRC0 gets smaller for disparity -6 and 6, the crosstalk reduction is still preferred by the observers.
Figure 5: Thurstone analysis for comparison of crosstalk algorithms in the subjective experiment
hal-00466863, version 1 - 25 Mar 2010
Figure 6: Thurstone analysis differentiating between disparities In terms of algorithm parameters it seems not beneficial to perform the crosstalk reduction at the expense of an increased dark level. In HRC2 when β = 20 was chosen, the algorithm performs worse than without the dark level increment in HRC1. The same applies to HRC4 and HRC3. The usage of the negative luminance threshold seems to be appreciated as HRC4 is judged best. A drawback of the application of the crosstalk reduction in the proposed way is that the transition between the display cones is no longer smooth. The reduction of crosstalk is strongest in the center of each view and thus, when the observer moves, he perceives different levels of crosstalk. Thus, the display behaves as if it contained discrete views instead of being continuous. Only a single value for each algorithm parameter was evaluated. The number of combinations for the paired comparisons and the limited duration of the test session did not allow further investigations. However, it should be considered necessary to further tune the two parameters in order to improve the algorithm. The application to images which contain depth information should also be evaluated. However, the fact that the algorithm performed well for all disparities indicates that a gain can always be achieved.
5. CONCLUSION For displaying 3D content, autostereoscopic displays are advantageous because they do not require the viewer to wear glasses which is often prohibited, e.g. in a telephone conference environment. However, the low resolution of the displays per view and the amount of crosstalk limits their current usage. In this contribution a way to mitigate the effect of crosstalk was presented. First, we proposed a method to measure the amount of crosstalk on a lenticular array display. As the method works by visual comparison, it does not require expensive measurement equipment. Second, we addressed the problem of interview dependency on a multiview display by using a linear model in the luminance domain. The algorithm was motivated and described in detail. A way to implement this algorithm effectively was introduced. Finally, it was demonstrated that the processed images are preferred by the viewers in a subjective experiment when asked for their preference in terms of quality of experience. In a next step, further investigations on the tuning of the algorithm parameters are necessary. Moreover, the way of processing results in discrete views which leads to a reduced motion parallax effect on the display.
hal-00466863, version 1 - 25 Mar 2010
REFERENCES 1.
L.M.J Meesters, W.A. IJsselsteijn, P.J.H. Seuntiens, “A survey of perceptual evaluations and requirements of threedimensional TV”, IEEE Transactions on Circuits and Systems for Video Technology, Volume 14, Issue 3, March 2004 pp 381 – 391
2.
A. Jain and J. Konrad, “Crosstalk in automultiscopic 3-D displays: Blessing in disguise?”, SPIE Symposium on electronic Imaging, Stereoscopic Displays and Applications, Jan. 28-Feb. 1, 2007, San Jose, CA, USA.
3.
A. Boev, A. Gotchev, K. Egiazarian, “Crosstalk measurement methodology for auto-stereoscopic screens,” Proceedings of the International Conference: True-Vision, Capture, Transmission, and Display of 3D Video (3DTVCON 2007), Kos Island, Greece, pp. 4 p, (2007)
4.
Konrad J, Lacotte B, Dubois E (2000) Cancellation of image crosstalk in time-sequential displays of stereoscopic video. IEEE Transactions on Image Processing 9(5):897–908
5.
P.J.H. Seuntiens, L.M.J. Meesters, W.A. IJsselsteijn “Perceptual attributes of crosstalk in 3D images” Displays 26(4-5):177–183 (2005)
6.
Barkowsky M., Cousseau R., Le Callet P., “Influence of Depth Rendering on the Quality of Experience for an Autostereoscopic Display”. International Workshop on Quality of Multimedia Experience (2009)
7.
Alioscopy Homepage, Technology Overview, http://www.alioscopyusa.com/content/technology-overview
8.
Poynton, C.A., “Rehabilitation of gamma”. Human Vision and Electronic Imaging III 3299, 232–249 (1998).
9.
ATIS T1.TR.PP.76-2001, A4: Objective Perceptual Video Quality Measurement Using a JND-Based Full Reference Technique. (2001)
10. Cermak, G., Thorpe L, Pinson, M., “Test Plan for Evaluation of Video Quality Models for Use with High Definition TV Content”, ftp://vqeg.its.bldrdoc.gov/Documents/Projects/hdtv/VQEG_HDTV_testplan_v3.doc 11. Thurstone, L.L. “A law of comparative judgement”. Psychological Review, 34, 273–286, 1927. 12. Vasquez-Espinosa, R.E. and R.W. Conners. 1982. The law of comparative judgement: Theory and Implementation. Louisiana State University - Remote Sensing and Image Processing Laboratory, Technical Report