Bull. Mater. Sci., Vol. 30, No. 5, October 2007, pp. 503–510. © Indian Academy of Sciences.
Crystal structure and elastic constants of Dharwar cotton fibre using WAXS data O M SAMIR and R SOMASHEKAR* Department of Studies in Physics, University of Mysore, Manasagangotri, Mysore 570 006, India MS received 28 February 2007 Abstract. Wide-angle X-ray scattering (WAXS) recordings were carried out on raw Dharwar cotton fibres available in Karnataka. Using this data and employing linked atom least squares (LALS) method, we report here the molecular and crystal structure of these cotton fibres. Employing structural data, we have computed elastic moduli tensor components of these fibres. From these investigations, it turns out that the intrinsic strains present in the fibre arise due to hydrogen bonds and not covalent bonds, which is a significant result. Keywords. WAXS; cotton fibres; LALS; elastic constants.
1.
Introduction
Cotton fibre belongs to a family of ‘Gossypium’ (Brubaker et al 1999). It has been used for more than 3000 years because of its versatility and costless to produce finished products. Cotton is essentially pure cellulose. The structure– property relation of cotton is considered as an important factor in textile industry. The elastic constants of cellulose were computed by assuming molecular models of Jaswan (Jaswan et al 1968). In this model, the strains present along the chain depend on the deformation of primary (covalent) bonds and hydrogen bonds. A comparison of this model has been carried out by Eichhorn and Davies (2006). Northolt and Vries (1985) reexamined tensile deformation of welloriented cellulose fibres and the results show the prospect for improving the mechanical properties of cellulose fibres. Here, by using two different sets of hydrogen bond force constants of 24⋅6 and 31⋅9 × 1010 N/m2, the Young’s modulus has been estimated along the chain direction (Gillis 1969). Tashiro and Kobayashi (1991) concluded that Young’s modulus along chain axis is not affected by inter-chain interaction but by intra-chain hydrogen bonds. Mann and Roldan–Gonzalez (1962) reported elastic moduli at different stages of relative humidity and the average value of elastic moduli was around 7–9 × 10¹⁰ N/m2. Here, we have employed wide angle X-ray scattering (WAXS) data to estimate the intrinsic strain and crystal size of Dharwar (cellulose I) cotton fibres. For this purpose, we have used line profile analysis (LPA) developed by us. We have also investigated the crystal structural features of these fibres using linked atom least squares (LALS) technique. The elastic tensor components of these fibres were determined using
*Author for correspondence (
[email protected])
Treloar’s (1960) equations and structural data, which were determined by LALS technique here. 2.
Materials and methods
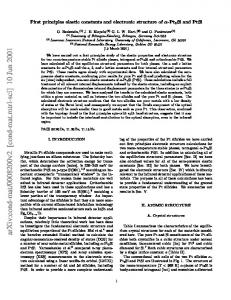
2.1 Preparation of sample Raw cotton (Dharwar) is plucked manually after ripening. This cotton is freed from the buds and taken for ginning. Ginning is a process where raw cotton is separated from seed, seed hulls and other small objects. This process must be done before cotton fibres can be used for studying. Depending on the varieties of cotton, ginning machine is employed. After removing the seed, it is taken for baling till it became as lint. The lint raw cotton sample is used for our study, without any additional treatment. 2.2 X-ray diffraction measurement The sample is taken as small bundles and clamped into a sample holder. Then this sample holder is mounted on a goniometer such that the rotational axis is parallel to fibres axis and perpendicular to X-ray beam. Here, we have used an imaging plate system (Dip-3200) with dimensions (440/240) mm2, which is moved parallel to the axis of rotation. The wavelength of X-ray radiation is λ = 0⋅71073 Å (Mo target). The X-ray generator (RIGAKU) settings were 50 kV and 32 mA. The time of exposure was kept at 400 s and X-ray diffraction pattern of cotton fibre (Dharwar) recorded using Weissenberg geometry is given in figure 1. Equatorial scan of intensity vs 2θ was carried out using the ‘MOSFLM’ software supplied with the instrument. This data was analysed using Peak-Fit software (Chen et al 2004). Background intensity was subtracted during peak fitting 503
504
O M Samir and R Somashekar
procedures. For peak fitting purpose, a Gaussian deconvolution was selected as peak profile of X-ray diffraction line of cotton fibres. The position of each diffraction line was calculated by resolving the symmetric peak position and was identified from residual peak-fitting procedure of Peak-Fit. The 2θ positions were computed by calculating the mean and standard deviation of each diffraction profile. Cell parameters and space group of crystal system of Dharwar cotton fibre were determined by using a ‘CHEKCELL’ freely available program. This program was developed for Windows by Jean Laugier and Bernard Bochu, which is a user-friendly procedure and was quite useful for identifying appropriate cell parameters with estimated STD and space group of the system. ‘CHEKCELL’ program was executed until a set minimum standard deviation was achieved. We could identify 11 reflections. Observed reflections were indexed by a unit cell with dimensions, a = 4⋅49 Å; b = 6⋅19 Å; c = 5⋅36 Å and the space group was P21. 2.3 X-ray diffraction data analysis To find the microstructural parameters of Dharwar cotton fibre, we have made simulation for intensity profiles using line profile analysis (LPA) method. This method is based on Fourier cosine series of Warren and Averbach (Warren and Averbach 1952; Warren 1955, 1969) and Hosemann’s one-dimensional paracrystal model (Hosemann 1982). The broadening of intensity profile is due to both crystal size and distortion of the lattice. Intensity profile in a direction joining the origin to the centre of the reflection is
I ( s) =
∞
∑ ( As (n).Ad (n))cos{2π nd (s − s0 )},
(1)
n =−∞
where As(n) are size coefficients, Ad(n) are lattice strain coefficients, d the interplanar spacing, s the value of {sin(θ)/λ}, s0 the value of s at peak of the reflection, θ the Bragg’s angle, λ the wavelength of radiation and n the harmonic number. The disorder component contribution is Ad (n) = exp(−2π 2 m 2 ng 2 ).
(2)
Here m is the order of reflection and g (=Δd/d) the lattice disorder. For a probability distribution of column length, P(i), the crystal size contribution will be As (n) = 1 −
n n ⎤ nd d ⎡ − ⎢ ∫ iP(i)di − n ∫ P (i )di ⎥ . D D ⎢⎣ 0 0 ⎦⎥
(3)
In cotton fibres, it is rare to obtain multiple reflections and hence we cannot use Warren and Averbach multiple order method. We have used single order method (Hall and Somashekar 1991; Pope and Balzar 2002; Balzar 2004) to obtain crystal size and lattice strain, using an analytical function for the probability distribution, P(i). For this reason, we have chosen an asymmetric function (exponential distribution) to find out the finer details of the microstructural parameters of Dharwar cotton fibres (Somashekar and Somashekarappa 1997). This distribution depends on the fact that there are no columns containing less than an assumed number of unit cells and those with more than the assumed number of cells will decay exponentially. There are four unknown parameters and to determine these, we have used a multidimensional minimization program SIMPLEX (Press et al 1986). The goodness of fit between experimental and simulated intensity profiles have been computed by Δ2 = [ I cal − ( Iexp + BG )]2 / number of points.
(4)
Here Ical, Iexp and BG represent calculated intensity, experimental intensity and a background correction term. 2.4 Molecular model
Figure 1. X-ray diffraction pattern recorded from Dharwar cotton fibre.
It is well known that cellulose is a linear polymer of β(1-4)D-glucopyranose units in 4C1 conformation (Fried 2002). There are two types of cellulose I which are cellulose, Iα and cellulose Iβ, but for higher plants such as cotton fibre the dominant one is cellulose, Iβ (Atalla 1999). The chair conformation of β-linked glucopyranose residues stabilizes the structure. The flexibility of polysaccharide chains depends on the ease of rotation around this glycosidic linkage. To find molecular structure of cotton fibres, we have considered molecular models having the 2/1-helical symmetry and the fibre-repeating period of 10⋅38 Å together with the pyranose ring in the standard with all bond lengths and angles. There are two dihedral angles (φ, ψ)
Crystal structure and elastic constants of Dharwar cotton fibre between two adjacent pyranose rings, which are called glycosidic linkage angles, and there is a dihedral angle (χ) to define the orientation of O6 oxygen atom (French and Johnson 2004). There are three possible values of O6, depending on the orientation of this atom related to pyranose ring, gauche–gauche, gauche–trans and trans–gauche. The molecular model of cotton fibres with standard bond lengths, bond angles and dihedral angles is shown in figure 2. 2.5 Crystal structure packing There are two molecular chains with 2/1 helical symmetry in a unit cell with space group, P21 (French and Johnson 2004). These two independent polymer chains are taken in parallel positions and pointing in the same direction in the unit cell. To obtain appropriate packing models, the fractional coordinates (u, w, v) of the origin atom (C1) were refined with stepwise procedures and the one which gives minimum standard deviation was used (Okuyama et al 1997). Here, u and v are the positional parameters of polymer chain in the ac-plane; w is the height of the origin along the b-direction and the azimuth angle (μ) around the molecular axis. The Eulerian angles (εx, εy, εz), the three angular parameters that specify the orientation of a molecule with respect to reference axes, were also determined using stepwise method. Other required packing parameters were also determined. 2.6 Linked atom least squares (LALS) program With the development of computer-based physical modeling, it is now possible to create accurate molecular model
505
in a unit cell by inputting the required parameters of this molecular structure into the program. This molecular and crystal structure was generated by using LALS method (Smith and Arnott 1978) and the computations were carried out using a Linux based PC. We have compiled the software, LALS, for execution using LINUX operating system. Actually there is a method to pack the two polymer chains with 2/1-helical symmetry in a unit cell with space group, P21, i.e. by locating the polymer chains at special positions on the crystallographic axes at (u = 0⋅25, v = 0⋅0) and (u = 0⋅75, v = 0.0). The azimuthal angles, μ1 and μ2, are searched within the asymmetric unit by calculating Rvalues for the equatorial reflections (Okuyama et al 1997). The two independent polymer chains are in the same direction. In the next step, we have searched the positional parameter, w, of the polymer chain along the c-direction. Then, this model was refined against all reflections, including unobserved ones. We have observed 15 reflections, of which 13 reflections have been identified conclusively in LALS program. The weight of reflection (w) was fixed at 1⋅0 for observed reflections. R and Rw were used to evaluate the agreement between observed and calculated structure amplitudes. We have carried out refinement of molecular and crystal structure parameters to minimize the difference in structure amplitudes of experimental Fobs and simulated Fcal in terms of R and Rw factors given as R = ∑ || Fo | − | Fc || / ∑ | Fo |, Rw = ∑ w (| Fo | − | Fc |)2 / ∑ wFo2 .
(5)
Atomic scattering factors for calculating structure factors were obtained by using the method and values given in the literature (Ibers and Hamilton 1974). Final values of refined parameters are listed in table 2 and fractional coordinates are given in table 3. Observed and calculated structure amplitudes are given in table 4. The X-ray agreement factors, R and Rw, are 17⋅43% and 21.06%, respectively, for reflection data. The packing structure is
Table 1. Microstructural parameters of Dharwar cotton fibre using exponential distribution function. (h k l)
Figure 2. The molecular model of cellulose, (1) carbon atom is black ball and oxygen atom is grey ball, (2) torsion angles [φ (C2–C1–O1–C4), ψ(C1–O1–C4–C3) and χ (O5–C5–C6–O6)] and (3) glycosidic angle [τ(C1–O1–C4)].
(0 1 0) (0 1 1) (1 1 0) (0 1 2) (0 0 2) (0 2 1) (–2 1 1) (2 1 2) (2 2 0) (–1 2 3) (2 1 3) (–3 1 2) (3 1 2)
dhkl (Å)
〈N〉
g (%)
Ds (Å)
Δ
8⋅25 6⋅44 5⋅38 4⋅37 4⋅13 3⋅83 3⋅47 2⋅83 2⋅69 2⋅56 2⋅41 2⋅29 2⋅18
4⋅45 6⋅30 7⋅79 9⋅08 10⋅19 10⋅13 11⋅92 14⋅80 15⋅01 16⋅11 16⋅89 17⋅60 18⋅54
0⋅10 0⋅50 0⋅10 1⋅00 0⋅10 0⋅60 0⋅10 0⋅50 0⋅50 0⋅10 0⋅10 0⋅50 0⋅60
36⋅71 40⋅57 41⋅91 39⋅68 42⋅09 38⋅80 41⋅36 41⋅88 40⋅38 41⋅24 40⋅71 40⋅30 40⋅42
0⋅035 0⋅042 0⋅051 0⋅062 0⋅051 0⋅035 0⋅055 0⋅061 0⋅036 0⋅052 0⋅054 0⋅068 0⋅058
506
O M Samir and R Somashekar
shown in figure 4 in which hydrogen bonds are denoted by dashed lines.
Table 2. Final model parameters of cellulose for Dharwar cotton fibre after several refinements using experimental intensities. Torsion angles at glycosidic linkage (deg.) φ (C2–C1–O1–C4) ψ(C1–O1–C4–C3)
147⋅09° 62⋅19°
Glycosidic angle (deg) τ (C1–O1–C4)
112⋅52°
Eulerian angles (deg) εx εy εz
103⋅38° 58⋅39° –118⋅87°
Orientation of O6 (deg) χ(O5–C5–C6–O6)
105⋅69° 0⋅49 106⋅25° 0⋅67 0⋅28 19⋅86 4⋅79E + 06 Cal/mol 0⋅174 0⋅211
μ1 and μ2, the azimuth angles for two separated chains around their molecular axes; w1 and w2, the heights of the origin atoms for the separated chains along c-axis; scale factor (factor by which the calculated intensities should be multiplied with this value in table 2 to give the observed intensities, which is used initially to bring the magnitude within the range of experimental data); attenuation factor, the amount of absorption of the radiation by the atoms; stereo-chemical energy is related to the spatial arrangement of atoms within a molecule; R and Rw (the normal and weighted residual factors). Table 3. Fractional atomic coordinates for one molecule of cellulose (chain-a) model from LALS program after several refinements against X-ray intensities.
C1 O1 C2 O2 C3 O3 C4 C5 O5 C6 O6
Modulus of elasticity of Dharwar cotton fibre depends mainly on molecular structure and morphology (Ravve 2000). For monoclinic crystal, the elastic constants are given by Perelomova and Tagieva (1983). ⎡ C11 ⎢C ⎢ 21 ⎢C31 ⎢ ⎢ − ⎢C51 ⎢ ⎣⎢ −
X
Y
Z
0⋅023 –0⋅019 0⋅173 0⋅328 0⋅169 0⋅299 –0⋅005 –0⋅152 –0⋅138 –0⋅333 –0⋅416
0⋅269 0⋅377 0⋅216 0⋅248 0⋅300 0⋅237 0⋅278 0⋅336 0⋅245 0⋅313 0⋅463
0⋅163 –0⋅226 0⋅079 0⋅146 –0⋅050 –0⋅131 –0⋅114 –0⋅016 0⋅101 –0⋅065 –0⋅088
For any atom with position (Xn, Yn, Zn) from the other independent chain can be generated by using (Xo, Yo, Zo), the position of the same atom in the above chain and the following equation: Xn = (Xo – 0⋅25)cosθ + Yosinθ + 0⋅75, Yn = (Xo – 0⋅25)sinθ + Yocosθ, Zn = Zo – w1 + w2, where θ = μ1 – μ2.
C12 C22
C13 C23
− −
C15 C25
C32 −
C33 −
− C44
C35 −
C52 −
C53 −
− C64
C55 −
⎡ S11 ⎢S ⎢ 21 ⎢ S31 =⎢ ⎢ − ⎢ S51 ⎢ ⎢⎣ −
126⋅15°
Packing parameters of polymer chains μ1 w1 μ2 w2 Scale factor Attenuation factor Stereo-chemical energy R Rw
Atom
2.7 Calculation of stiffness constants
− ⎤ − ⎥⎥ − ⎥ ⎥ C46 ⎥ − ⎥ ⎥ C66 ⎦⎥
S12
S13
−
S15
S22 S32
S23 S33
− −
S25 S35
−
−
S44
−
S52 −
S53 −
− S64
S55 −
− ⎤ − ⎥⎥ − ⎥ ⎥ S46 ⎥ − ⎥ ⎥ S66 ⎥⎦
−1
,
where C11, C22, C33 are stiffness constants, C44, C55 and C66 are the shear constants and C12, C23 and C13 are Poisson’s ratios. For simplifying the calculation, Treloar assumed the additional constants in monoclinic matrix to be equivalent to the orthorhombic matrix (Treloar 1960). The main and most important elastic constant is C22, which gives the elastic constant along chain direction (Treloar 1960; Jaswon et al 1968), and is influenced by three forces: primary bonds (covalent bonds), inter-chain bonds (hydrogen bonds which exist between chains) and intra-chain bonds (hydrogen bonds which exist between two atoms within a chain). The C22 can be expressed as follows ′ + C22 ′′ + C22 ′′′ . C22 = C22
(6)
Table 4. Observed Fo and calculated Fcal structure amplitudes for Dharwar cotton fibre, (hkl) Bragg reflections and multiplicity (M). hkl
M
Fcal
Fo
010 011 110 012 002 021 –2 1 1 212 220 –1 2 3 213 –3 1 2 312
2 4 4 4 2 4 4 4 2 4 4 4 4
135⋅65 101⋅37 201⋅46 132⋅28 142⋅78 320⋅57 121⋅76 67⋅32 87⋅69 92⋅91 105⋅62 72⋅09 75⋅68
55⋅95 106⋅45 191⋅29 121⋅61 151⋅72 382⋅93 106⋅05 77⋅41 72⋅53 93⋅36 73⋅50 66⋅28 60⋅17
Crystal structure and elastic constants of Dharwar cotton fibre
507
Figure 3. Experimental and simulated intensity profiles for different (hkl) reflections: (a) (0 1 0), (b) (0 1 1), (c) (1 1 0), and (d) (0 2 1).
According to Treloar’s (1960), C22′ is given by C22′ = CL2/V.
(7)
Here L is repeat distance in chain direction axis, V the volume of unit cell of cellulose (monoclinic) and C a gross constant, which can be computed by using bond angles, bond lengths, linear force constants and angular force constants of primary bonds. C′′2 is computed (Treloar 1960) using
C11 = (2 D12 / V )(Ch1 cos 2 Φ1 + ( K h1 / h12 ) sin2 Φ1 ) cos 2 Ω, (9) ′′ = (2 / V )(Ch1h12 sin 4 Φ1 + Ch3 h32 sin4 Φ3 C22 + K h1 sin2 Φ1 cos 2 Φ1 + K h 3 sin2 Φ3 cos 2 Φ3 ), (10) C33 = (2 D32 / V )[Ch3 cos 2 Φ3 + ( K h 3 / h32 )sin 2 Φ3 ] cos 2 Ω3 ,
(11)
(8)
C12 = (2 D1 h1 / V )[Ch1 − ( K h1 / h12 )]sin 2 Φ1 cos Φ1 cos Ω1 , (12)
where Φ2 is the angle formed by (O5–H…O3) in the chain. Treloar (1960) has shown that
C23 = (2 D3 h3 / V )[Ch3 − ( K h3 / h32 )]sin 2 Φ3 cos Φ3 cos Ω3 . (13)
′′ = (2 D22 / V )[Ch 2 sin 2 Φ2 + ( K h 2 / h22 ) cos 2 Φ2 ], C22
508
O M Samir and R Somashekar
Figure 4. The molecular and crystal structure of Dharwar cotton fibres along the three projections: (a) a-axis, (b) b-axis, and (c) c-axis, respectively. Dashed lines indicate the hydrogen bonds.
For explanations of angles and various symbols, we refer to the reference by Treloar (1960). Utilizing all these equations, we have written a source code in FORTRAN language to calculate the elastic constants for Dharwar cotton fibres.
in different Bragg planes, indicating the anisotropic nature of the intrinsic strains that are present during fibre formation.
3.
The molecular structure for cellulose is a typical structure with β (1–4) linked polysaccharides as observed in chitosan and chitin (Okuyama et al 1997). The main-chain conformation angles, φ (C2–C1–O1–C4) and ψ(C1–O1– C4–C3), are 62⋅19° and 147⋅09°, respectively. The value of χ (O5–C5–C6–O6), which defines the orientation of O6, is 126⋅15°. This orientation of O6 is gauche–trans (gt) and this conformation being the second most common conformation in the single crystal structures of oligosa-
Results and discussion
3.1 Microstructural parameters Using (1)–(4) and X-ray data, the computed microstructural parameters are given in table 1. Figure 3 has been plotted to show the goodness of fit between experimental and simulated intensity profiles. The computed intrinsic strain components (g) are small and have different values
3.2 Molecular structure
Crystal structure and elastic constants of Dharwar cotton fibre ccharides and also in polysaccharides including cellulose (Allen et al 1979). Table 2 shows the final parameters of cellulose-I using LALS program obtained after several refinements. The Eulerian angles (εx, εy, εz) were also given in table 2. 3.3 Crystal structure The unit cell parameters of cotton fibre studied here are a = 7⋅84 Å, b (fibre axis) = 10⋅38 Å, c = 8⋅30 Å, α = 90°, β = 89⋅80°, and γ = 90° with monoclinic and space group, P21. The two pyrasone rings along the b-axis represent the repeating monomer of this polymer chain, and the two adjacent polymer chains along b-axis are independent. These are arranged in parallel fashion. These two polymer chains have translational difference along the b-axis of approximately 1 fibre repeat unit and are linked to each other by inter-chain bonds (O6–H....O3) and intra-chain bonds (O3–H...O5) along the c- and b-axes, respectively (Langan et al 1999). These features make the sheet structure parallel to a.c.-plane. The sheets are accumulated along the c-direction, such that each neighbouring sheets are related by crystallographic 21-symmetry. 3.4 Evaluation of crystal modulus The numerical calculation of elastic stiffness matrix |Cij| requires suitable values for substitution into the formulas. We have used the values by Treloar for force constants (linear and angular) for primary bonds and hydrogen bonds and they are: C1 = 4⋅54 × 104 N/m2, C2 = 4⋅54 × 104 N/m2, C3 = 4⋅54 × 104 N/m2, K1 = 1⋅105 × 10–18 N.m/rad, K2 = 0⋅912 × 10–18 N.m/rad, K3 = 1⋅027 × 10–18 N.m/rad, K4 = 0⋅883 × 10–18 N.m/rad, Ch1 = 0⋅30 × 104 N/m2, Ch3 = 0⋅30 × 104 N/m2, Kh1 = Kh3 = 1⋅027 × 10–18 N.m/rad. We have used bond angles and bond lengths for both primary bonds and hydrogen bonds and also auxiliary angles to calculate the elastic constants. We have adopted Treloar assumptions even though that the chains of cellulose take parallel position to each other, which is contrary to Treloar assumption. Further, hydrogen bonds of the type O– H…O are dominant within a sheet and it takes perpendicular projection with the chain axes, whereas hydrogen bonds of the type C–H…O connect between every chains in different sheets. Treloar has mentioned that only O– H…O type are available for calculations and this may have an effect on the assumed values. The stiffness matrix of Dharwar cotton fibres so computed is (in GPa):
509
⎡ 4.21× 1.6 × − − − − ⎤⎥ ⎢ 1010 109 ⎢ . ⎥ . × 1.51 × ⎢ 1 69× 3 706 − − − ⎥ 11 10 10 10 ⎢ 10 ⎥ ⎢ ⎥ . . 1 51× 3 38 × ⎢ − − − − ⎥ 10 10 10 10 ⎢ ⎥ ⎢ ⎥ 2.5 × − − − − ⎥ ⎢ − 109 ⎢ ⎥ 1.85 × ⎢ ⎥ − − − − − ⎢ ⎥ 1010 ⎢ ⎥ 2.83 ×⎥ ⎢ − − − − − 1010 ⎦⎥ ⎣⎢
E11 = 4⋅14 × 109 N/m2, G12 = 0⋅708 × 109 N/m2, E22 = 3⋅58 × 1010 N/m2, G23 = 0⋅625 × 1010 N/m2, E33 = 3⋅32 × 109 N/m2, G31 = 0⋅463 × 1010 N/m2, μ12 = 0⋅045, μ21 = 0⋅382, μ23 = 0⋅446, μ32 = 0⋅042, μ31 = –0⋅016, μ13 = 0⋅0199. We find from the above results that E22 value is 35⋅8 GPa which is higher than that reported in our paper for (dch32) cotton fibre which is 1⋅55 GPa, which has been calculated using intrinsic strain tensor components (Samir and Somashekar 2007). The negative values of some Poisson’s ratio in some directions denote that while stretching a chain there is a transverse expansion with stretching instead of a contraction and this is relative to longitudinal extension. This has been observed for some materials (auxetic materials such as cellular solid foams) and materials with chiral microstructure with non-central force interaction or non-affine deformation (Lakes 1987). We have examined and quantified the disorder present in the cotton fibres using line profile analysis and a well established single order method. The observed broadening of reflection in cotton fibre is due to crystallite size of the order, 40–50 Å, and intrinsic strain present in the cotton fibres. These intrinsic strain tensor components affect slightly the hydrogen bonds only and not the primary bonds. By using this assumption and neglecting the deformation of primary bonds (3), we have also recalculated the elastic constants (in GPa), and we find ⎡ 4.27 × ⎢ 1010 ⎢ . ⎢1 6310× ⎢ 10 ⎢ ⎢ − ⎢ ⎢ ⎢ − ⎢ ⎢ ⎢ − ⎢ ⎢ − ⎣⎢
1.63 × − 1010 5.13 × 1.47 × 1010 1010 1.47 × 3.48 × 1010 1010 −
−
−
−
−
−
− ⎤⎥ ⎥ − − − ⎥ ⎥ ⎥ − − − ⎥ ⎥ ⎥ 2.44 × − − ⎥ 1010 ⎥ 1.89 × ⎥ − − ⎥ 1010 ⎥ 2.9 ×⎥ − − 10 10 ⎦⎥ −
−
510
O M Samir and R Somashekar
E11 = 3⋅68 × 109 N/m2, G12 = 0⋅72 × 1010 N/m2, E22 = 3⋅88 × 109 N/m2, G23 = 0⋅61 × 1010 N/m2, E33 = 3⋅00 × 109 N/m2, G31 = 0⋅47 × 1010 N/m2, μ12 = 0⋅36, μ21 = 0⋅38, μ23 = 0⋅42, μ32 = 0⋅33, μ31 = –0⋅15, μ13 = –0⋅12. The value of E22 (Young’s modulus) is in agreement with the reported range of values of Young’s modulus (5⋅5–12⋅5 GPa) (Eichhorn et al 2001). The shear modulus has a high value in the [100] and [010] directions and are of same magnitude. The Poisson’s ratios agree with the previous reported value (Roberts et al 1994), which is 0⋅30 for microcrystalline cellulose. 4.
Conclusions
In this paper, first, we have recorded wide angle X-ray scattering data from Dharwar cotton fibre. This WAXS data has been used to obtain the unit cell parameters and microstructural parameters of these fibres. For this purpose, we have analysed the data using line profile analysis, developed by us. The results show that the intrinsic strain components of cotton fibre are very small and have different values in different Bragg’s planes. This indicates the anisotropy nature of intrinsic strains present during fibre formation. We have also constructed molecular and crystal structures of this cotton fibre by using LALS and PLATON programs (Spek 2003). This is based on a model wherein two chains in a unit cell are parallel with the same conformations. We have also computed the elastic constants from microstructure data. There is an agreement between our result of longitudinal Young’s modulus (3⋅58 × 1010 N/m2) and that of Jaswon et al’s (1968) value (5⋅65 × 1010 N/m2). In the absence of primary bonds, the recalculated elastic constants give a significant value of Young’s modulus (3⋅88 × 109 N/m2). Acknowledgement The authors thank Prof. J S Prasad for providing X-ray diffractometer facilities and also for encouragement. References Allen F H et al 1979 Acta Crystallogr. B: Struct. Crystallogr. Cryst. Chem. 35 2331
Atalla R H 1999 10th international symposium on wood and pulping chemistry (Yokohama, Japan: TAPPI Press) Vol. 1, pp 608–614 Balzar D 2004 J. Appl. Cryst. 37 911 Brubaker C L, Bourland F M and Wendel J E 1999 The origin and domestication of cotton in Cotton: Origin, history, technology and production (eds) C W Smith and J T Cothren (New York: John Wiley and Sons) p. 3 Chen R, Jakes K A and Foreman D W 2004 J. Appl. Polym. Sci. 93 2019 Eichhorn S J and Davies G R 2006 Cellulose 13 291 Eichhorn S J et al 2001 J. Mater. Sci. 36 2107 French A D and Johnson G P 2004 Cellulose 11 5 Fried Joel R 2002 Polymer science and technology (New Delhi: Prentice Hall of India, Private Ltd.) Gillis P P 1969 J. Polym. Sci. Part A-2: Polym. Phys. 7 783 Hall I H and Somashekar R 1991 J. Appl. Cryst. 24 1051 Hosemann R 1982 Colloid Polym. Sci. 260 864 Ibers J A and Hamilton W C (eds) 1974 International table for crystallography (Birmingham, England: Kynoch Press) Vol. 4, pp 71–147 Jaswan M A, Gillis P P and Mark R E 1968 Proc. R. Soc. A306 386 Jean Laugier et Bernard Bochu (http/www.ccp14.ac.uk/ tutorial/Imgp/Jean Laugier et Bernard Bochu) Lakes R S 1987 Science 235 1038 Langan P, Nishiyama Y and Chanzy H 1999 Fibre Diffr. Rev. 8 42 Mann J and Roldan-Gonzalez L 1962 Polymer 3 549 Northolt M G and Vries H D 1985 Ang. Mak. Chem. 133 183 Okuyama K, Noguchi K, Miyazawa T, Yui T and Ogawa K 1997 Macromolecules 30 5849 Perelomova N V and Tagieva M M 1983 Problems in crystal physics with solutions (ed.) M P Shaskol’skaya (Moscow: Mir Publishers) Pope N C and Balzar D 2002 J. Appl. Cryst. 35 338 Press W, Flannery B P, Teukolsky S and Vetterling W T (eds) 1986 Numerical recipes (Cambridge: Cambridge University Press) p. 289 Ravve A 2000 Principles of polymer chemistry (New York: Kluwer Academic/Plenum Publishers) 2nd ed., Ch. 1, p. 8 Roberts R J, Rowe R C and York P 1994 Int. J. Pharm. 105 177 Samir O M and Somashekar R 2007 Powder Diffraction (in press) Smith P J C and Arnott S 1978 Acta Crystallogr. A34 3 Somashekar R and Somashekarappa H 1997 J. Appl. Cryst. 30 147 Spek A L 2003 J. Appl. Crystallogr. 36 7 Tashiro K and Kobayashi M 1991 Polymer 32 1516 Treloar L R G 1960 Polymer 1 290 Warren B E 1955 Acta Crystallogr. 8 483 Warren B E 1969 X-ray diffraction (Addison-Wesley: New York) p. 105 Warren B E and Averbach B L 1952 J. Appl. Phys. 23 497