Low density polyethylene P.E.C. (FX 361 CDF. Chimie). Polypropylene .... Linear P.E. (Manolene) (a) and branched P.E. (Lacquetene) (b). observed in branched ...
J.
Physique 41 (1980)
1459-1467
DÉCEMBRE
1980,
1459
Classification Physics Abstracts 61.50C - 36.20 81.20S -
Crystallization of polymers. Part I : Polydispersed polymers quenched from the liquid
state
J. Rault Laboratoire de
M.
Physique des Solides,
Université Paris-Sud, 91405
Orsay,
France
Sotton, C. Rabourdin and E. Robelin
Institut textile de France, 92100 Boulogne-sur-Seine, France
(Reçu le
13 juillet 1979, révisé le 17 juillet 1980,
accepté le 25 juillet 1980)
Nous avons mesuré les longues périodes de plusieurs polymères trempés à partir de l’état fondu. Nous Résumé. donnons la relation entre la longue période mesurée dans la phase semi-cristalline et la rigidité de la chaîne dans l’état liquide juste avant la cristallisation. On montre que la mesure des longues périodes d’échantillons préalablement recuits à l’état fondu, à différentes températures, et pendant des temps différents, nous permet de remonter à un temps de relaxation des pelottes dans le fondu. 2014
Abstract. The long spacing L of several crystalline polydispersed polymers quenched from the liquid state at various temperatures has been measured. We correlate the variations of the long period L with the variations of the dimension r0 > of the ideal coils in the melt just before the crystallization. The relationship between L and the rigidity C of the liquid chain is given. The annealing of the melt at different temperatures and for different times, and the subsequent crystallization allow us to measure the relaxation time of the coils in the liquid state. 2014
1. Introduction. Crystallization of polymers from the melt, the solid amorphous phase, and from dilute solution leads to a lamellar phase. The morphology of the structure has been widely studied [1, 2] by various techniques, especially by small angle X-ray scattering [3]. The thickness of the crystalline le and of amorphous layers la are two important parameters characterizing the lamellar structure. In semi-crystalline materials obtained by crystallization from the melt and from solution, the long period L la + le is dependent on the temperature of crystallization, on the supercooling AT. The observed laws giving L f (AT) are very similar. This fact suggests that the process of crystallization in both cases are not different. In solution grown material L - le is given by
approach, the two parameters have straightforward physical meaning. le is a characteristic length of the chain in the liquid state, about 20 times the persistence length [5], and A is directly related to the mobility of the chain in the solid state [4]. In this approach, the chain folding in the crystalline material is the consequence of the folding of the chain in the liquid state ; this general rule of crystallization is found if the crystalline lamellar thickness of solution grown crystals is compared to the rigidity of the chain in the liquid state (see Fig. 6 of refe-
where le and A are two constants. The same type of relation applies for polymers crystallized from the melt. Kinetics theories [1, 2] and two-stage crystallization theory [4] (freezing and annealing) explain this relationship between the lamella thickness and
crystals).
-
=
=
supercooling.
In the latter
a
rence
[5a]).
The crystalline lamella core thickness le is found to be of the order of magnitude of the mean length of the loops in the liquid ; le can be defined as the smallest part of the chain which has a gaussian character. In melt or in solution, oligomer chains longer than le crystallize with folds (like polymers) and shorter chains without folds (extended chain It is well known that melt and solution grown crystals present great differences with regard to the crystallinity x and the topology of folds [2, 6, 9]. In monocrystals grown from solution there is a great deal of evidence that there is some regularity of the
Article published online by EDP Sciences and available at http://dx.doi.org/10.1051/jphys:0198000410120145900
1460
[1, 2, 7], and a model of superfolding has been proposed [6]. According to this model the amorphous layer is constituted of sharp folds. A proportion of 30 % of sharp fold among loose folds is necessary for explaining the experimental neutron scattering results [9]. In melt crystallized materials there is significant evidence that the radius of gyration of the coil in the melt is not quite different to that of the chain in the crystal. This fact does not imply that order
the crystallization can be done with the same rate of cooling. c) For certain polymers like polybutene, the quenched material is in the amorphous state. Crystallization appears by heating the sample just above the glass temperature. In that case, no dependence of the long period on the temperature of crystallization
exist in the liquid. In the solidication model of Fischer [6b] the constancy of the radius of gyration is not a necessarily case. The relationship between the conformation of the chains in the melt and solid states indicate that the switchboard model of Flory is adequate for describing the semi-crystalline materials, quenched from the melt. The amorphous layer is important in these materials ; the long period L le + la is a complex function of the molecular weight which will be analysed in Part II [13]. The study of the crystallization process in semidilute solution is rendered difficult by the fact that :
The unperturbed dimension ( ro > and therefore the rigidity C rô >Ina’ of the chain having n monomers of length a vary with the temperature [15, 16]. This has been predicted by the theory of rotational isomery and experimentally verified by thermomechanical measurements on crosslinked polymers [11]. By crystallizing the melt annealed at different temperature T; above the melting temperature Tm, we are then able to find the relationship between the long period and the rigidity of the chain just before
folds
=
a) The exact conformation of the chains in the solution just before crystallization is not known in general. For various polymers the rigidity of the chain depends on the solvent. Generally the conformation of the chains has been determined in certain solvent, and the crystallization of the chains has been determined in another solvent [5], therefore preventing the study of the correlations between the conformation of the chains in the solid and liquid states.
b) The effect of annealing during the process of crystallization seem to be important. This effect depends on the degree of supercooling, and on the nature of the chains and the solvent.
c) Generally it is impossible to vary continuously [5a] the rigidity of the chain without varying the others parameters such as melting enthalpy, melting temperature,
etc.
In spite of these difficulties, there is a great deal of evidence that in solution grown crystals the long period L - le is related to the rigidity C of the chain in the liquid state. From reference [5a] it appears that L - le aC - 20 lp where lp is the persistence of the chain in the liquid state. length The aim of this paper is to find the same type of relationship between the solid and liquid phases in materials only quenched from the melt. The great advantages of that sort of crystallization are :
is observed.
crystallization. For various polydisperse polymers we compare the temperature coefficient fl of the chain in the liquid state with the temperature coefficient a of the lamellar thickness in the solid phase. These two parameters are
given by :
The relationship between a and f3 for polydisperse P.E. (Part I) and monodisperse P.E. (Part II) will describe the process of crystallization.
Experimental part. The polymers studied are : High density polyethylene P.E.M. (ManoleneM.N.P.E.) 2.
-
Low
density polyethylene Ato-Chimie)
Low
density polyethylene
P.E.L.
P.E.C.
(Lacquetene-
(FX
361 CDF
Chimie)
-
a) The ideality of the melt : as noted by Flory, the chain in the pure liquid are ideal, because intrachain and inter-chain interactions cannot be distinguished [8]. The coils have the unperturbated dimensions at each temperature of the melt provided the annealing at that temperature is long enough. b) Quenching prevents in general the annealing ’ of the material : the
thickening
of the lamellae and
Polypropylene Chimie)
P.P.1
(Narpyl 61 130 Naphta-
Polypropylene Chimie)
P.P.2
(Napryl
61 500
Naphta-
1461
Polyethylene oxyde Polybutene
1
P.E.O.
(CDF Chimie)
Polymer discs of dimensions 10 mm x 1 mm were melted at a temperature Ti between two copper plates of 1 mm thickness for 15 min. and then quenched in liquid nitrogen. The cooling rate was about 10 to 20°C/s. The order of magnitude of this rate was deduced by measuring the time taken by the sample to cool by 100 I)C during the quenching process. Samples (except P.E.O.) were then annealed at room temperature or at 70°C during two days, and the long periods L were measured with a Rigaku low angle X-ray camera set in front a RU 200 rotating anode X-ray generator. Exposures were carried out in the following conditions : Ni filtered Ka Cu, 40 kV, 80 mA, pinhole collimation first pinhole 0 0.3 mm, second pinhole 0 distance film-sample - 30 cm.
=
and an increase of the long period (and of x). In our experiments, there is no conspicuous change in the crystallinity, and the width of the peak is constant with the temperature of the melt (see Fig. 1, Part II). According to Tvanskin (Fig. 7 of ref. [18]) there is no correlation between the variations of x and L (even if the width is varied) in such a way that :
peak,
(Prolabo)
0.5 mm,
=
Some experiments were done at the synchrotron 1.8 A and a distance counterof Lure with 100 cm. In of that case the precision on the sample measurement of the long period is =
The distance between 2 channels in the counter is 0.25 mm. The experimental setup is described in reference [17].
Experimental procédure. - SAXS has been widely used in the estimation of lamellar thickness, calculated by the application of Bragg’s law to the maximum of the scattering intensity peak. However, 3.
experiments, a change of the Bragg long period indicates a change in the average long period ALav ¥= 0.
Therefore, in
our
b) Schultz model : the absence of second order peak (which is never completely absent in the previous model) seems to indicate that a two-phases system with sharp interfaces is not very adequate for describing polymers quenched from the melt. Schultz [19] has shown that the crystal-non crystal separation proceeding through intermediate density states can explain this feature; the density modulation is approximately sinusoidal rather than step-like. In that case obviously the long period deduced from Bragg law is proportional to the wavelength of the density modulation. The exact value of the mean period depends on the adopted model. Our purpose in this paper is not the explanation of the intensity curve in term of a fluctuation of the different layers and electronic density profiles, but rather the shift of the intensity curves and intensity maxima with the temperature of annealing Ti of the melt. It is worthwhile to note that in highly disorded systems, similar to amorphous systems, the Lorentz correction is not applied. As noted by Guinier the concept of L factor should be restricted to good crystals [20]. The usefulness of the Lorentz factor
is limited by the fact that in the paracrystalline lattice there is always a relatively strong background scattering whose radial distribution is not sufficiently
it is known that great care must be taken in the interpretation of the maximum of intensity, because of the angular distortions of the peak when distribution of periodicities is present. Two important interpretations of the intensity distribution of the SAXS curves have been given :
point-like [21].
a) Tvanskin model [3, 18] : the two-phase model is defined by the mean values of the thickness le and la and’by their distribution. The average long period La, is related to the long period given by the Bragg’s law by :
period is determined
We note that such a correction would broaden the peak and transform our intensity curves 1(0) of figure 1 into a very asymmetric curve 0’ 1(0). 4. Détermination of the long period. The long as follows. On each spectrum the median line passes by the points 1(0.), -
with I(Ol) 1(02) I(Om) (see Fig. 1). This curve, which tends to be vertical near the maximum, crosses the intensity curve at the maximum for ()m which gives L according to the Bragg law. This procedure for determining L is very accurate, two different samples of the same material having the =
parameter whose value depends on the the distribution of thickness of the and crystallinity, In this crystallites. theory an increase in crystalof the width of the intensity leads to a decrease linity where x is
a
=
1462
5. Results. We show in figure 2 the variations of the long period L with respect to TilT., both temperatures being expressed in OC. T. is the melting temperature. The time of annealing the melt at temperature Ti is greater than the relaxation time r defined later (self-consistent procedure). -
Small angle scattering of low density P.E. (lacquetene) Fig. 1. quenched from 230,DC. n is the number of channels in the linear counter. The synchrotron radiation has wavelength 1.8. The center of the X ray beam corresponds to channel 259. The median line M moves to M’ for a sample quenched from 150°C. The Bragg angle 0. determining the long period L is given by the intersection of the median line with the intensity curve. -
=
thermal treatment give two spectra, the diffein the measured value of L by this procedure yielding the accuracy of the measurement. For polyethylene (manolene) the accuracy on L by this procedure is about 4 A and 2.5 A respectively with the conventional Rigaku camera and synchrotron radiation experimental setup [17]. The accuracy is respectively 10 and 5 A when this procedure is not adopted as when the Bragg angle is determined solely by the location of the intensity maximum. For low density P.E. the intensity peak is not very well defined and a background subtraction was needed. The spectrum of the X-ray source without the sample was measured. The intensity at the center of the counter was normalized to that observed when the sample was in the X-ray beam. And finally the spectrum without sample was subtracted from the spectrum produced by the sample. For each set of experiments the same procedure was applied. Figure 1 shows for Lacquetene quenched from 230°C the corrected and un-corrected intensity. The same procedure based on the median line can be used for determining the maximum. same
rence
2. Long period L of various polydispersed polymers as a function of the temperature Ti of the melt. T. is the melting temperature of the polymer. All temperatures are expressed in °C. Points without error bar have been measured on the experimental setup of Lure. Polymers having a negative (a) or positive (b) temperature coefficient. The samples P.E.(M) n.a and P.E.(L) n.a are not annealed at 70 °C. The other P.E. samples are annealed at that temperature in order to have sharper intensity peaks.
Fig.
-
From this sions :
figure,
we
draw the
following
conclu-
a) The long spacing of all polymers is a quasilinear function of the initial temperature Ti of the melt. For high density polyethylene (M Manowe same obtain the lene) temperature dependence as in reference [10]. The long spacing of polyethylene, =
1463
and nylons decreases with increasing melt temperature (Fig. 2a), for polyoxyethylene it increases slightly and for polybutene a great increase is noted (Fig. 2b). This difference in behaviour must be related to the decrease of the rigidity for polymers like polyolefines (P.E., P.P.) and nylons and by contrast to the increase of C for polyoxyethylene and polybutene with increasing melt temperature. The mean square end to end distance ( r5 > of the chain in the coiled configuration decreases with increasing melt temperature for the first class of polymers [11] and increases for polymers like P.O.E. [11] and P.B. For nylon the variation of ( with temperature is not known. However the rigidity of the chain coming from the CH2 sequences between amido group, we believe that the variations are of the same order of magnitude as those of P.E.
polypropylene
Fig. 3. Method for determining the relaxation time of the coil, when the temperature of the melt is changed from Tl to T2 (or -
inversely).
r’ >
b) For polyethylene, the observed magnitude of variations of L with melt temperature are the same if the crystalline samples are annealed at room temperature or at 70°C. Similar results not illustrated in figure 2 are obtained for nylons annealed at 120 OC. At this temperature there is no thickening of the lamellae. The annealing of the solid leads to a rearrangement and perfection of the lamellae which gives sharper low angle diffraction. Furthermore, as seen in figure 2 for P.E.(M) and P.E.(L) the long period of the sample annealed at 70 OC is 8 % smaller than that of the sample annealed at room temperature. This can be due to the increase of the crystallinity or/and to a possible tilting of the chain in the lamellae. This effect is not observed for nylon. c) The law of variation of
L with the melt temfor low density and high density polyethylene. The absolute values of L are smaller for low density P.E. than for high density. The dependence of L and DLIDTI with the molecular weight will not be analysed in this paper. We will see that there is a great difference between these two polymers in regard to the relaxation times defined below.
perature Ti is the
same
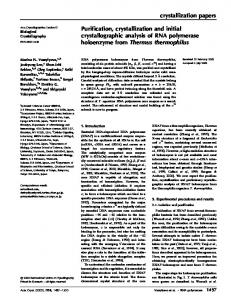
d) The value of L(T;) for P.B. are the same if the material has been crystallized from the melt or from the glassy state obtained by quenching the melt. In any case, the crystallization of P.B. is a much longer process compared to that for P.E. or P.E.O. 6. Relaxation time. - If the annealing time of the melt is not long enough the long period of the quenched material does not display any variation with Ti. This effect is reported here for linear polyethylene. The experiment is pictured in figure 3. The melt samples are annealed at 230°C for a long time and then quenched at 150 OC during a time t, and then quenched to liquid nitrogen. The long period measured as a function of the annealing time t is given in figure 3b. In figure 4 we report the variations of L
4. Long period measured in quenched P.E. as a function of the annealing timet of the melt. Samples were annealed during a long time at T 230 and then annealed at 150°C for a short time t. Linear P.E. (Manolene) (a) and branched P.E. (Lacquetene) (b).
Fig.
-
=
observed in branched P.E. (manolene) having the same thermal treatments. The measured relaxation time is about 30 min., an order of magnitude greater than for linear P.E. The samples have been submitted also to opposite treatments, they present the same type of curve L f (t) with opposite sense, the relaxation times measured by the two opposite treatments are of the same order of magnitude.
1464
We give in submitted to
figure 5 the variations of L of opposite thermal treatment.
an
P.B. The
liquid sample was annealed first at 150 OC for a long time (exceeding the relaxation time) and then annealed for a short time at 230oC. A relaxation time (16’) intermediate between those observed in linear and branched P.E. is measured.
explain qualitatively
the effect observed in P.E.O.
and P.B.
c) Crystallization of
P.B. is very slow
compared crystallization melt or from the glassy variations DLIDTI (and
to that of P.E. and P.E.O. Isothermal
is obtained either from the state, and gives the same same values L and T).
The relaxation time for low density P.E. is order of magnitude greater than for linear P.E., whereas thermal transients are the same.
d)
an
The effect of the annealing time of the liquid state the long period gives physical evidence of the relationship between the solid and liquid phases. It is well known that properties of solid polymers depend on the thermal history of the solid sample. We conclude from this work that they also depend on the thermal history of the liquid from which the on
samples
were
crystallized.
The effects reported in this paper on the annealing of the melt depend drastically on the relaxation time i, which is an intrinsic parameter of the polymer liquid chain (in the ideal state). We interpret this relaxation time as the time for the polymer chain to change its unperturbed dimension from r 1 to r2 when the temperature of the melt is changed from Tl
T2. (The time for changing the temperature of the melt must be shorter than the measured relaxation time T.) to
5. Long period of quenched polybutene. The samples were 1500 and then annealed at T 2300 annealed for a long time at T for a short time t.
Fig.
-
=
=
The relationship between this relaxation time and the molecular weight is given in reference [22]. 7. Discussion. It is well known that the long in period polymers is a function of the temperature of crysta’llization and of annealing [1, 2, 5]. Therefore, in polymers if the cooling rate is small compared to the crystallization time, the long period should be a function of the cooling rate, and therefore a function of the temperature of annealing and/or the temperature of crystallization. The reported results cannot be interpreted in terms of thermal transients when quenching the material from different temperatures, for the following reasons. -
a) The observed value of L and r are the same, whether P.E. samples are quenched in liquid nitrogen or in water-ice. Different values of Lare indeed obtained when the material has been crystallized at higher temperature, however similar variations with temperature are observed. The variations dLIdTi of P.B. are opposite P.E., and for P.E.O. the variations are If a difference in the temperature of crystalsmall. very lization due to thermal transients is assumed to be responsible for the effect observed in P.E., one cannot
b)
to those of
The measured values of r show the drastic influence of small and long branches along the backbone of the polymer chain. This parameter must depend on the number of entanglements along the chains and on the friction coefficient between chains. Expecting that the process of dimension change of the coil involve a reptation process, it is obvious that this relaxation time is strongly reduced by branches along the chain [23]. In a forthcoming paper we will analyse the dependence of this relaxation time with the molecular weight. The variation of the lamellae thickness with the temperature of the melt is also a characteristic parameter of the chain in the liquid state, but only if the time of annealing the melt is greater then the relaxation time r. For shorter values, DLIDTI is a function of the annealing time. From the variation DLIDTI it is not possible to deduce directly the respective variations of the crystalline and amorphous layers. These variations can be estimated if the crystallinity X(Ti) is known. The most accurate crystallinity measurement taking into account the lattice imperfections, leads to a accuracy on x of 5 % or somewhat less in certain cases [26]. In samples crystallized from different melt temperature, with the same quenching rate, we assume that the lattice distortions do not change, the measurement of the ratio Ac/ Aa of the crystalline and amorphous area can be measured with a accuracy of 1 % [27]. We have measured this ratio, and then
1465
crystallinity, for several samples crystallized according to the same procedure. The reproducibility of the measurements is about 1 %. In our samples crystallized from different T; temperatures, no change in the Ac/Aa is found, therefore we conclude that the crystallinity does not vary, or that the variation of the crystallinity is less than 1 %. By other technics like density and enthalpy measurements, Ergoz et al. [25] have also indicate that there is no change in crystallinity with the melt temperature. Assuming that the variations of the crystallinity x are proportional to the variations of the linear crystallinity lc/L, we obtain : the related index of
For linear P.E. quenched from 1500C and 230 OC the measured variations ALIL - 1 % are of the same order than the relative accuracy on the crystallinity. Therefore in that case from WAXS measurements, the variations of le cannot be estimated. For low density P.E. and P.P. the relative variation ALIL - 1.6 % would permit us to conclude that the relative variations of le are of the same order of magnitude and the same sign. It is to be noted that for linear P.E. the variations of le with the melt temperature have been determined directly by low frequency Raman spectroscopy. The variations found by Hendra [10] are of the same order of magnitude as those given by relation (1b) by assuming no variation of the crystallinity and of the same order of magnitude as the variation of L found in the present work. This variation of le with the melt temperature is expected if we consider le as a characteristic parameter of the solid phase dependent on the rigidity of the liquid chain just before crystallization. We have suggested previously that le is the mean length of the loops existing in the liquid state [5b], or the length of the smallest part of the chain which can be considered as gaussian [5a].
a)
In the first
case
le
is
given by :
where
lp
is related to the
rigidity by :
which is not very different from the definition of lp 2l 1. In general for a real chain C(l ~) =
=
2 a lp
Putting we obtain
The rigidity is a function of the temperature of the melt [11, 14, 15, 16] the variation of C with the temperature is given by the temperature coefficient
A small variation of C will give a large variation of the lamellar thickness. c" leads In general a power law dependence 1 to a linear variation of le with T; : =
This law explains the experimental results of Hendra on linear P.E. [.lo]. In a similar way, if we assume a power law dependence L ~ e the variations of the long period are
given by : or
eq.
(6) gives the relationship between the
two tem-
perature coefficients, characteristic of the liquid (fl)
given in
the literature [14-16], and characteristic of the solid phase (a). The linear relation (5) with 1 3 is approm priate for explaining the observed values ôL/ôT;. The exact power law L cm is however difficult to establish for several reasons : =
where v is the volume of a
monomer
unit of length
a) The variation of the rigidity
a.
b) In the second case we assume that the chain length le is gaussian when its rigidity C is equal to 90 % of the value of the infinite chain. The PorodKratky chain model is a very convenient model for calculating this length. The rigidity is [1 1] : of
C is assumed to be temperature range studied. The values of fi found by solution properties are in general different from the value obtained by measuring the thermoelasticity of the crosslinked polymer melt [14-16]. (For P.E. the same value of fl is found.) constant within the
b) In some cases, the long period L is a complex function of the molecular weight [12, 13] (MN, MW, Mi - - .). Therefore L cannot be only a function of the rigidity. The relationship between L and the molecular weight will be analysed in Part II.
1466
Table I. Experimental variations of the long period with the temperature Ti of the melt, compared to the theoretical value predicted by relation (5). From the crystallinity X the crystalline lamella thickness lclor P.E. is esti-
mated.
is the temperature p coefficient cof icient
( r2 0 given d(log
dTi
g
g
c) The rigidity C and the temperature coefficient stereospecific polymers like P.P. and P.B. depend on the tacticity [11, 15]. d) The value of PL in table I can be underestimated ; according to Tvanskin [18], in certain cases depending on the crystallinity, the value of the ratio la/le and the fluctuation of le and 1., the long period L deduced from the Bragg law can be smaller than the true long period by as much as 20 %. of
8. Conclusion. The long period of semi-crystalline polymers quenched from the melt is a function of the melt temperature, and is independent of the thermal history of the melt. The relaxation time measured in three different polymers has been related to the time for the liquid coils to change their unperturbed dimensions when the temperature is changed. This is a characteristic parameter of the liquid chain, which depends on the nature of the chain, and on its length as will be seen in a forthcoming paper. The slope ôL/ôT; is also a characteristic parameter of the liquid chain, provided that the annealing time of the liquid at the temperature Ti is greater than the relaxation time. The sign of the slope is given by the sign of the temperature coefficient fi of the liquid chain. The quasi-linear variation of the long period found in the present work and of the crystalline -
in
1[11, 15, 10].] references f >
>
lamellae thickness found by Hendra can be explained by the fact that these characteristic lengths of the solid phase depend on the persistence length of the chain in the liquid phase. We emphasize however that in polydispersed polymers the variations 8L/8T¡ are difficult to analyse because of the distribution of the molecular weight. The crystalline lamella core thickness does not depend on the molecular weight, but the long period is dependent on it in a complex manner. From this work and from other works [5, 10, 13], the crystalline core lamella is found to be proportional to the rigidity of the ideal chain (to the persistence length). This effect is predicted by the two-stage process of crystallization which leads to correlations between liquid and solid polymers. In spite of the discrepancies between the observed values DLIDTI and those predicted by relation (5), we conclude that the characteristics (L and le) of the lamellar structure of semi-crystalline polymers dependent on the characteristic parameters of the chains just before crystallization. It appears from this work that the measurements by SAXS technique of the variation of the long period with the temperature and time of annealing of the melt is a valuable method in order to characterize the nature of the polymer chains [22].
References
[1]GEIL, [2] [3]
P. H.,
Polymer Crystals (Wiley-Interscience
New
York)
1963. KELLER, A., Rep. Progr. Phys. 2 (1968) 923. KELLER, A., J. Macromol. Sci. B 15 (1978) 567. See for examples : CRIST, B., MOROSOFF, N., J. Polym. Sci. 11 (1973) 1023. BUCHANAN, D. R., J. Polym. Sci. 9 (1971) 645.
[4] RAULT, J., J. Physique Lett. 39 (1978) L-411. [5a] RAULT, J., J. Macromol. Sci. B 15 (1978) 567. [5b] RAULT, J., C.-R. Hebd. Séan. Acad. Sci. B. 285 (1977) 331. [6a] SADLER, D. M., KELLER, A., Polymer 17 (1976) 97. SADLER, D. M., KELLER, A., Science 203 (1979) 263, Comments Faraday discussion 68, 1980. [6b] FISCHER, E. W., Pure Appl. Chem. 50 (1978) 1319.
1467
[7] RAULT, J., J. Macromol. Sci. B 12 (1976) 335. [8] FLORY, P. J., Principe of Polymer Chemistry (Cornell University Press) 1953. [9] YOON, D. Y., FLORY, P. J., Polymer 18 (1977) 509. Faraday Discussion, 68, 1980.
[10] AITKEN, D., GLOTIN, M., HENDRA, P. J., JOBIC, H., MARSDEN, E., Polym. Lett. 14 (1976) 619. HENDRA, P. J., MARSDEN, E. P., Polym. Lett. 15 (1977) 258. [11]FLORY, P. J., Statistical mechanics of chain molecules (Intersciences publishers) 1968. [12] CAPACCIO, G., WARD, I. M., WILDING, M. A., LONGMAN, G. W., J. Macromol. Sci. Phys. B 15 (1978) 381. [13] ROBELIN, E., ROUSSEAUX, F., LEMONNIER, M., RAULT, J., Congrès de Société Française de Physique, juin 1979, Part II, J. Physique 41 (1980) 1469. [14] BIANCHI, U., J. Polym. Sci. A 2 (1964) 3083. [15] FLORY, P. J., Macromolecules 3 (1970) 613. [16] CIFERRI, A., J. Polym. Sci. A 2 (1964) 3089. [17] TCHOUBAR, D., ROUSSEAUX, F., PONS, C. H., LEMONNIER, M., Nucl. Instrum. Methods 152 (1978) 301.
[18] TSVANKIN, D. Ya., Vysokomol. S0153din. 6 (1964) 2078 ; TSVANKIN, D. Ya., Vysokomol. S0153din. 6 (1964) 2083. [19] SCHU, J. M., J. Am. Phys. Soc. 25 (1980) 249. [20] GUINIER, A., Private communication. [21] HOSEMAN, R., BAGHI, S. N., Direct analysis of diffraction by Matter P. (North Holland Pub.) 1962. [22] RAULT, J., ROBELIN, E., J. Am. Phys. Soc. 25 (1970) 351. RAULT, J., ROBELIN, E., Polym. Bull. 2 (1980) 393. [23] DE GENNES, P. G., J. Physique 36 (1975) 1179. [24] RAULT, J., Comments Faraday Discussion 68, Cambridge 1979. [25] ERGOZ, E., FATOU, J. G., MANDELKERN, L., Macromolecules, 5 (1972) 147. [26] ALEXANDER, L. E., X-Ray diffraction , methods in polymer science (Wiley-Interscience P.) 1969, p. 165 and 187. [27] HERMANS, P. H., WEIDINGER, A., Makromol. Chem. 44 (1966) 24.
STATTON, W.O., J. Appl. Polym. Sci. 7 (1963) 803. FARROW, G., WARD, I. M., Polymer 1 (1960) 330. OKUI, N., MAGILL, J. H., Polymer 18 (1971) 1152.