Jan 12, 2016 - IGMCS Program Committee the courses to be taken. Ã Requirement is still ... course work from three disci
CS 594 - 005 Scientific Computing for Engineers HPC Start to Finish Jack Dongarra University of Tennessee http://bit.ly/cs594-2016 1
Simulation: The Third Pillar of Science ◆
◆
◆
Traditional scientific and engineering paradigm: 1) Do theory or paper design. 2) Perform experiments or build system. Limitations: Ø Too difficult -- build large wind tunnels. Ø Too expensive -- build a throw-away passenger jet. Ø Too slow -- wait for climate or galactic evolution. Ø Too dangerous -- weapons, drug design, climate experimentation. Computational science paradigm: 3) Use high performance computer systems to simulate the phenomenon » Base on known physical laws and efficient numerical methods. 2
Computational Science
3 Source: Steven E. Koonin, DOE
Computational Science Fuses Three Distinct Elements: 4
5
Computational Science As An Emerging Academic Pursuit ¨
Many Programs in Computational Science ¤ College
for Computing n Georgia Tech; NJIT; CMU; … ¤ Degrees n Rice, Utah, UCSB; … ¤ Minor n Penn State, U Wisc, SUNY Brockport ¤ Certificate n Old Dominion, U of Georgia, Boston U, … ¤ Concentration n Cornell, Northeastern, Colorado State, … ¤ Courses
At the University of Tennessee 6
A few years ago there was a discussion to create a program in Computational Science ¨ This program evolved out of a set of meetings and discussions with faculty, students, and administration. ¨ Modeled on a similar minor degree program in the Statistics Department on campus. ¨ Appeared in the 2007-2008 Graduate Catalog ¨
7
Graduate Minor in Computational Science Students in one of the three general areas of Computational Science; n Applied Mathematics, n Computer related, or n a Domain Science will become exposed to and better versed in the other two areas that are currently outside their “home” area. ¨ A pool of courses which deals with each of the three main areas has been put together by participating department for students to select from. ¨ Interdisciplinary Graduate Minor in Computational Science (IGMCS) ¨
IGMCS: Requirements ¨
¨
¨
Applied Mathematics
The Minor requires a combination of course work from three disciplines - Computer related, Mathematics/Stat, and a participating Science/Engineering domain (e.g., Chemical Engineering, Chemistry, Physics). At the Masters level a minor in Computational Science will require 9 hours (3 courses) from the pools. ¤ At least 6 hours (2 courses) must be taken outside the student’s home area. ¤ Students must take at least 3 hours (1 course) from each of the 2 non-home areas At the Doctoral level a minor in computation science will require 15 hours (5 courses) from the pools. ¤ At least 9 hours (3 courses) must be taken outside the student’s home area. ¤ Students must take at least 3 hours (1 course) from each of the 2 non-home areas
Computer Related
Domain Sciences
8
IGMCS Process for Students 1.
2.
3. 4.
A student, with guidance from their faculty advisor, lays out a program of courses Next, discussion with department’s IGMCS liaison Form generated with courses to be taken Form is submitted for approval by the IGMCS Program Committee
IGMCS Participating Departments
Department
IGMCS Liaison
Email
Biochem & Cell and Mole Bio
Dr. Albrecht von Arnim
[email protected]
Chemical Engineering
Dr. Steven Abel
[email protected]
Chemistry
Dr. Robert Hinde
[email protected]
Civil & Envir. Eng.
Dr. Joshua Fu
[email protected]
Earth & Planetary Sci
Dr. Edmund Perfect
[email protected]
Ecology & Evol. Biology
Dr. Paul Armsworth
[email protected]
EECS
Dr. Jack Dongarra
[email protected]
Genome Sci & Tech
Dr. Albrecht von Arnim
[email protected]
Geography
Dr. Bruce Ralston
[email protected]
Information Science
Dr. Devendra Potnis
[email protected]
Material Science & Eng
Dr. David Keffer
[email protected]
Mathematics
Dr. Vasilios Alexiades
[email protected]
Mech, Aero & Biomed Eng
Dr. Kivanc Ekici
[email protected]
Microbiology
Dr. Gary Sayler
[email protected]
Nuclear Engineering
Dr. Ivan Maldonado
[email protected]
Physics
Dr. Thomas Papenbrock
[email protected]
Statistics
Dr. Hamparsum Bozdogan
[email protected]
Students in Departments Not Participating in the IGMCS Program Ò
A student in such a situation can still participate. É Student
and advisor should submit to the Chair of the IGMCS Program Committee the courses to be taken. É Requirement is still the same: Ð Minor
requires a combination of course work from three disciplines - Computer Science related, Mathematics/Stat, and a participating Science/Engineering domain (e.g., Chemical Engineering, Chemistry, Physics).
Ò
Student’s department should be encouraged to participate in the IGMCS program. Ò Easy
to do, needs approved set of courses and a liaison
Internship 12
This is optional but strongly encouraged. ¨ Students in the program can fulfill 3 hrs. of their requirement through an Internship with researchers outside the student’s major. ¨ The internship may be taken offsite, e.g. ORNL, or on campus by working with a faculty member in another department. ¨ Internships must have the approval of the IGMCS Program Committee. ¨
13
Why Turn to Simulation? ◆
When the problem is too . . . Ø Complex Ø Large / small Ø Expensive Ø Dangerous
◆
to do any other way. Taurus_to_Taurus_60per_30deg.mpeg
14
Why Turn to Simulation? ◆ ◆
◆
Climate / Weather Modeling Data intensive problems (data-mining, oil reservoir simulation) Problems with large length and time scales (cosmology)
15
Data Driven Science • Scientific data sets are growing exponentially - Ability to generate data is exceeding our ability to store and analyze - Simulation systems and some observational devices grow in capability with Moore’s Law
• Petabyte (PB) data sets will soon be common: - Climate modeling: estimates of the next IPCC data is in 10s of petabytes - Genome: JGI alone will have .5 petabyte of data this year and double each year - Particle physics: LHC is projected to produce 16 petabytes of data per year - Astrophysics: LSST and others will produce 5 petabytes/year (via 3.2 Gigapixel camera)
• Create scientific communities with “Science Gateways” to data 01/22/2013
CS267 - Lecture 1
16
Weather and Economic Loss ◆
$10T U.S. economy
◆
$1M in loss to evacuate each mile of coastline
Ø 40% is adversely affected by weather and climate Ø we now over warn by 3X! Ø average over warning is 200 miles, or $200M per event
◆
Improved forecasts
◆
LEAD
Ø lives saved and reduced cost Ø Linked Environments for Atmospheric Discovery » Oklahoma, Indiana, UCAR, Colorado State, Howard, Alabama, Millersville, NCSA, North Carolina 17
Source: Kelvin Droegemeier, Oklahoma
Look at the Fastest Computers ◆
Strategic importance of supercomputing Ø Essential for scientific discovery Ø Critical for national security Ø Fundamental contributor to the economy and competitiveness through use in engineering and manufacturing
◆
Supercomputers are the tool for solving the most challenging problems through simulations
18
Units of Measure • High Performance Computing (HPC) units are: - Flop: floating point operation, usually double precision unless noted - Flop/s: floating point operations per second - Bytes: size of data (a double precision floating point number is 8)
• Typical sizes are millions, billions, trillions… Mega Giga Tera Peta Exa Zetta Yotta
Mflop/s = 106 flop/sec Gflop/s = 109 flop/sec Tflop/s = 1012 flop/sec Pflop/s = 1015 flop/sec Eflop/s = 1018 flop/sec Zflop/s = 1021 flop/sec Yflop/s = 1024 flop/sec
Mbyte = 220 = 1048576 ~ 106 bytes Gbyte = 230 ~ 109 bytes Tbyte = 240 ~ 1012 bytes Pbyte = 250 ~ 1015 bytes Ebyte = 260 ~ 1018 bytes Zbyte = 270 ~ 1021 bytes Ybyte = 280 ~ 1024 bytes
• Current fastest (public) machine ~ 33.9 Pflop/s - Up-to-date list at www.top500.org 01/22/2013
CS267 - Lecture 1
19
High-Performance Computing Today In the past decade, the world has experienced one of the most exciting periods in computer development. ◆ Microprocessors have become smaller, denser, and more powerful. ◆ The result is that microprocessor-based supercomputing is rapidly becoming the technology of preference in attacking some of the most important problems of science and engineering. ◆
20
Technology Trends: Microprocessor Capacity
Gordon Moore (co-founder of Intel) Electronics Magazine, 1965 Number of devices/chip doubles every 18 months
2X transistors/Chip Every 1.5 years
Called “Moore’s Law”
Microprocessors have become smaller, denser, and more powerful. Not just processors, bandwidth, storage, etc. 2X memory and processor speed and ½ size, cost, & power every 18 21 months.
Moore’s Law put lots more transistors on a chip…but it’s Dennard’s Law that made them useful Dennard observed that voltage and current should be proportional to the linear dimensions of a transistor IEEE JOURN.4L OF SOLID-ST.iTE CIRCUITS, VOL.
2456
[41
[5’1
[61
[71
switching delays using CMOS/ in 1971 Int. Solid-State Circuit Conj., Dig. Tech. Papers, p. 225, E. J. Boleliy and J. E. Meyer, “High-performance low-power CMOS memories using silicon-on-sapphire technology,” IEEE J. Solid-State Circuits (Special Issue on Micropower Electronics), vol. SC-7, pp. 135-145, Apr. 1972. R. W. Bower, H. G. Dill, K. G. Aubuchon, and S. A. Thompson, ‘[MOS field effect transistors by gate masked ion implantation,” IEEE !t’’rams. Electron Devices, vol. ED-15, pp. 757-761, Oct. 1968. J. Tihanyi, “Complementary ESFI MOS devices with gate self adjustment by ion implantation,” in Proc. 5,th Iwt. Conj. Microelectronics in Munich, Nov. 27–29, 1972. MunchenWien, Germany: R. Oldenbourg Verlag, pp. 437447. E. J. Boleky, “The performance of complementary MOS transistors on insulating substrates,” RCA Rev., vol. 80, pp. 372-395,
Design
H.
DENNARD,
RIDEOUT,
Michael Pomper, 238 of this issue.
Jeno Tlhanyi, for 238 of this issue.
of Ion-Implanted
Very ROBERT
NO.
5>
OCTOBER 1974
1970.
formation in an insulated gate field [81 K. Goser, ‘[Channel effect transistor ( IGFET) and its emrivalent circuit .“ Sienzen.s Forschungsund Entwiclclungsbekhte, no. 1, pp.’ 3-9, 1971. “Accurate metallization [91 A. E. Ruehli and P, A. Brennan, capacitances for integrated circuits and packages,” IEEE J. Solid-State Circwits (Corresp.), vol. SC-8, pp. 289-290, Aug. 1973. SINAP (Siemens Netzwerk Analyse Programm Paket), [101 Siemens AG, Munich, Germany. ‘[Aufteilung der Gate-Kanal[111 K, Goser and K. Steinhubl,
Dennard Scaling : • Decrease feature size by a factor of λ and decrease voltage by a factor of λ ; then • # transistors increase by λ2 • Clock speed increases by λ • Energy consumption does not change
SC-9,
Kapazitat auf Source und Drain im Ersatzschaltbild eines und Ent wicldwrgsMOS-Transistors,” Siemenx Forxchungsberichte 1, no. 3$ pp. X4-286, 1972. [121 J. R. Burns, “Switching response of complementary+symmetry MOS transistors logic circuits,” RCA Rev., vol. 25, pp. 627481, 1964. [131 R. w. Ahrons and P. D. Gardner, ‘[Introduction of technology and performance in complementary symmetry circuits,” IEEE J. Solid-State Circuits (Special Issue on Technology jor Integrated-Circuit Design), vol. SC-5, pp. 24–29, Feb. 1970. [141 F. F. Fang and H. Rupprecht, “High performance MOS integrated circuits using ion implantation technique,” presented at the 1973 ESSDERC, Munich, Germany,
[31 E. J. Boleky, ‘%ubnanosecond SOS silicon-gate technology,”
Small
H.
Absfracf—This paper considers the design, fabrication, and characterization of very small MOSI?ET switching devices suitable for digital integrated circuits using dimensions of the order of 1 p. Scaling relationships are presented which show how a conventional MOSFET can be reduced in size. An improved small device structure is presented that uses ion implantation to provide shallow source and drain regions and a nonuniform substrate doping profile. One-dimensional models are used to predict the substrate doping profile and the corresponding threshold voltage versus source voltage characteristic. A two-dimensional current transport model is used to predict the relative degree of short-channel effects for different device parameter combinations. Polysilicon-gate MOSFET’S with channel lengths as short as 0.5 ~ were fabricated, and the device characteristics measured and compared with predicted values. The performance improvement expected from using these very small devices in highly miniaturized integrated circuits is projected.
Manuscript received May 20, 1974; revised July 3, 1974. The aubhors are with the IBM T. J. Watson Research Center, Yorktown Heights, N.Y. 10598.
and
please see p.
biogra~hy,
please
see p.
with
Dimensions
GAENSSLEN,
BASSOUS,
a photograph
and biography,
MOSFET’S
Physical
LIEMBER, IEEE, FRITZ
MEMBER) IEEE, ERNEST
for a photograph
AND ANDRE
HWA-NIEN
YU,
R. LEBLANC,
LIST
MEMBER, IEEE, V. LEO MEMBER, IEEE
OF SYMBOLS
a
Inverse
D
threshold characteristic. Width of idealized step function
semilogarithmic
slope of sub-
AW,
Work
pro-
fde for chaDnel implant. function
difference
and substrate. Dielectric constants
for
between
gate
silicon
and
silicon dioxide. Drain current. Boltzmann’s Unitless
constant.
scaling
constant.
MOSFET Effective
channel length. surface mobility.
Intrinsic
carrier
concentration.
Substrate acceptor concentration. Band bending in silicon at the onset of strong
inversion
for zero substrate
voltage.
[Dennard, Gaensslen, Yu, Rideout, Bassous, Leblanc, IEEE JSSC, 1974] 22
Unfortunately Dennard Scaling is Over: What is the Catch? Breakdown is the result of small feature sizes, current leakage poses greater challenges, and also causes the chip to heat up 2,200,000,000
10,000,000,000 Chip Transistor Count
1,000,000,000 100,000,000
Chip Power
Moore’s Law
10,000,000 1,000,000 100,000 10,000 2300 1,000
130 W
100 10 1
0.5 W
0 1970
1975
1980
1985
1990
1995
2000
2005
2010
2015
Powering the transistors without melting the chip
23
Dennard Scaling Over Evolution of processors The primary reason cited for the breakdown is that at small sizes, current leakage poses greater challenges, and also causes the chip to heat up, which creates a threat of thermal runaway and therefore further increases energy costs.
Dennard scaling broke
Single-core Era
Multicore Era
3.4 GHz
3.5 GHz
2003
2013
740 KHz
1971
2004
Moore’s Law is Alive and Well 1.E+07
1.E+06
Transistors (in Thousands) 1.E+05
1.E+04
1.E+03
1.E+02
1.E+01
1.E+00
1.E-01 1970
1975
1980
1985
1990
1995
2000
2005
2010
Data from Kunle Olukotun, Lance Hammond, Herb Sutter, Burton Smith, Chris Batten, and Krste Asanoviç
Slide from Kathy Yelick
25
Transistors into Cores
26
Today’s Multicores 99% of Top500 Systems Are Based on Multicore
Intel Westmere (10 cores) Sun Niagra2 (8 cores)
IBM Power 7 (8 cores)
Fujitsu Venus (16 cores)
AMD Interlagos (16 cores)
Nvidia Kepler (2688 Cuda cores)
27 IBM BG/Q (18 cores)
Intel Xeon Phi (60 cores)
But Clock Frequency Scaling Replaced by Scaling Cores / Chip 1.E+07
15 Years of exponential growth ~2x year has ended 1.E+06
1.E+05
Transistors (in Thousands) Frequency (MHz) Cores
1.E+04
1.E+03
1.E+02
1.E+01
1.E+00
1.E-01 1970
1975
1980
1985
1990
1995
2000
2005
2010
Data from Kunle Olukotun, Lance Hammond, Herb Sutter, Burton Smith, Chris Batten, and Krste Asanoviç
Slide from Kathy Yelick
28
Performance Has Also Slowed, Along with Power 1.E+07
1.E+06
1.E+05
Power is the root cause of all this Transistors (in Thousands) Frequency (MHz) Power (W)
1.E+04
Cores
1.E+03
A hardware issue just became a software problem 1.E+02 1.E+01
1.E+00
1.E-01 1970
1975
1980
1985
1990
1995
2000
2005
2010
Data from Kunle Olukotun, Lance Hammond, Herb Sutter, Burton Smith, Chris Batten, and Krste Asanoviç
Slide from Kathy Yelick
29
Power Cost of Frequency •
Power ∝ Voltage2 x Frequency (V2F)
•
Frequency
•
Power ∝Frequency3
∝ Voltage
30
Power Cost of Frequency •
Power ∝ Voltage2 x Frequency (V2F)
•
Frequency
•
Power ∝Frequency3
∝ Voltage
31
Look at the Fastest Computers ◆
Strategic importance of supercomputing Ø Essential for scientific discovery Ø Critical for national security Ø Fundamental contributor to the economy and competitiveness through use in engineering and manufacturing
◆
Supercomputers are the tool for solving the most challenging problems through simulations
32
Example of typical parallel machine
Chip/Socket
Core
Core
33
Core
Core
Example of typical parallel machine
Node/Board
Chip/Socket
Core
GPU
Core
…
Chip/Socket
Core
GPU
34
Chip/Socket
Core
GPU
Core
Example of typical parallel machine Shared memory programming between processes on a board and a combination of shared memory and distributed memory programming between nodes and cabinets
Cabinet
…
Node/Board
Chip/Socket
Core
GPU
Core
…
Node/Board
Node/Board
GPU
Chip/Socket
Chip/Socket
Core
35
Core
GPU
Core
Example of typical parallel machine Combination of shared memory and distributed memory programming Switch
…
Cabinet
…
Node/Board
Chip/Socket
Core
GPU
Core
…
Cabinet
Node/Board
Node/Board
GPU
Chip/Socket
Chip/Socket
Core
36
Core
Cabinet
GPU
Core
What do you mean by performance? ◆
◆
What is a xflop/s?
Ø xflop/s is a rate of execution, some number of floating point operations per second. » Whenever this term is used it will refer to 64 bit floating point operations and the operations will be either addition or multiplication.
What is the theoretical peak performance?
Ø The theoretical peak is based not on an actual performance from a benchmark run, but on a paper computation to determine the theoretical peak rate of execution of floating point operations for the machine. Ø The theoretical peak performance is determined by counting the number of floating-point additions and multiplications (in full precision) that can be completed during a period of time, usually the cycle time of the machine. Ø For example, an Intel Xeon 5570 quad core at 2.93 GHz can complete 4 floating point operations per cycle or a theoretical peak performance of 11.72 GFlop/s per core or 46.88 Gflop/s for the socket.
37
H. Meuer, H. Simon, E. Strohmaier, & JD
Rate
- Listing of the 500 most powerful Computers in the World - Yardstick: Rmax from LINPACK MPP Ax=b, dense problem TPP performance - Updated twice a year Size SC‘xy in the States in November Meeting in Germany in June - All data available from www.top500.org
38
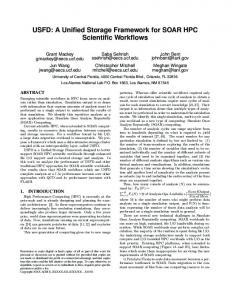
Performance Development of HPC over the Last 24 Years from the Top500 11E+09 Eflop/s
420 PFlop/s
100 Pflop/s 100000000
33.9 PFlop/s
10 Pflop/s
10000000
1 Pflop/s 1000000
SUM
100 Tflop/s
100000
206 TFlop/s
10 Tflop/s
N=1
10000
1 Tflop/s
1000
1.17 TFlop/s
100 Gflop/s
100
10 Gflop/s
59.7 GFlop/s
10
N=500
My Laptop 70 Gflop/s My iPhone 4 Gflop/s
1 Gflop/s
1
100 Mflop/s
400 MFlop/s
0.1
1994 1996 1998 2000 2002 2004 2006 2008 2010 2012 2014 2015
State of Supercomputing in 2016 • Pflops (> 1015 Flop/s) computing fully established with 81 systems. • Three technology architecture possibilities or “swim lanes” are thriving. • Commodity (e.g. Intel) • Commodity + accelerator (e.g. GPUs) (104 systems) • Special purpose lightweight cores (e.g. IBM BG, ARM, Intel’s Knights Landing)
• Interest in supercomputing is now worldwide, and growing in many new markets (around 50% of Top500 computers are used in industry). • Exascale (1018 Flop/s) projects exist in many countries and regions. • Intel processors largest share, 89% followed by AMD, 4%.
40
VENDORS / SYSTEM SHARE Lenovo/IBM, 5, NUDT, 5, 1% 1% IBM/Lenovo, Others, 9, 2% 48, 10% Dell, 11, 2% Fujitsu, 12, 2% Inspur, 15, 3%
HP Cray Inc. Sugon IBM HP, 156, 31%
Lenovo Bull
Bull, 21, 4% Lenovo, 25, 5% SGI, 30, 6%
SGI
IBM, 45, 9%
Cray Inc., 69, 14%
Inspur Fujitsu Dell IBM/Lenovo
Sugon, 49, 10%
# of systems, % of 500
Countries Share Absolute Counts US: 201 China: 109 Japan: 38 UK: 18 France: 18 Germany: 32
China nearly tripled the number of systems on the latest list, while the number of systems in the US has fallen to the lowest point since the TOP500 list was created.
Total Performance [Tflop/s]
Performance of Countries 100,000 10,000 1,000 100 10 1 0
US
Total Performance [Tflop/s]
Performance of Countries 100,000 10,000
US
1,000 100 10 1 0
EU
Total Performance [Tflop/s]
Performance of Countries 100,000 10,000 1,000 100 10 1 0
US EU Japan
Total Performance [Tflop/s]
Performance of Countries 100,000
US
10,000 EU 1,000 Japan 100 China 10 1 0
November 2015: The TOP 10 Systems Rank
Site
1
National Super Computer Center in Guangzhou
2 3
Computer
Tianhe-2 NUDT, Xeon 12C + IntelXeon Phi (57c) + Custom Titan, Cray XK7, AMD (16C) + DOE / OS Nvidia Kepler GPU (14c) + Oak Ridge Nat Lab Custom DOE / NNSA Sequoia, BlueGene/Q (16c) L Livermore Nat Lab + custom
Country
Cores
Rmax [Pflops]
% of Peak
Power MFlops [MW] /Watt
China
3,120,000
33.9
62
17.8
1905
USA
560,640
17.6
65
8.3
2120
USA
1,572,864
17.2
85
7.9
2063
4
RIKEN Advanced Inst for Comp Sci
K computer Fujitsu SPARC64 VIIIfx (8c) + Custom
Japan
705,024
10.5
93
12.7
827
5
DOE / OS Argonne Nat Lab
Mira, BlueGene/Q (16c) + Custom
USA
786,432
8.16
85
3.95
2066
USA
301,056
8.10
80
Swiss
115,984
6.27
81
2.3
2726
185,088
5.64
76
6
DOE / NNSA / Trinity, Cray XC40,Xeon 16C + Los Alamos & Sandia Custom Piz Daint, Cray XC30, Xeon 8C + Nvidia Kepler (14c) + Custom
7
Swiss CSCS
8
HLRS Stuttgart
9
KAUST
Shaheen II, Cray XC40, Xeon 16C + Custom
Saudi Arabia
196,608
5.54
77
2.8
1954
10
Texas Advanced Computing Center
Stampede, Dell Intel (8c) + Intel Xeon Phi (61c) + IB
USA
204,900
5.17
61
4.5
1489
500 (368) Karlsruher
Hazel Hen, Cray XC40, Xeon 12C Germany + Custom
MEGAWARE Intel
Germany
10,800
.206
95
Comparison
1 Gflop/s
70 Gflop/s
33,000,000 Gflop/s
~factor of 500,000
Tianhe-2 (Milkyway-2) ¨ China, 2013: the 34 PetaFLOPS ¨ Developed in cooperation between
NUDT and Inspur for National Supercomputer Center in Guangzhou ¨ Peak performance of 54.9 PFLOPS Ø 16,000 nodes contain 32,000 Xeon Ivy Bridge processors and 48,000 Xeon Phi accelerators totaling 3,120,000 cores Ø 162 cabinets in 720m2 footprint Ø Total 1.404 PB memory (88GB per node) Ø Each Xeon Phi board utilizes 57 cores for aggregate 1.003 TFLOPS at 1.1GHz clock Ø Proprietary TH Express-2 interconnect (fat tree with thirteen 576-port switches) Ø 12.4 PB parallel storage system Ø 17.6MW power consumption under load; 24MW including (water) cooling Ø 4096 SPARC V9 based Galaxy FT-1500 processors in front-end system
ORNL’s “Titan” Hybrid System: Cray XK7 with AMD Opteron and NVIDIA Tesla processors
4,352 ft2 404 m2
50
SYSTEM SPECIFICATIONS: • Peak performance of 27 PF • 24.5 Pflop/s GPU + 2.6 Pflop/s AMD • 18,688 Compute Nodes each with: • 16-Core AMD Opteron CPU • NVIDIA Tesla “K20x” GPU • 32 + 6 GB memory • 512 Service and I/O nodes • 200 Cabinets • 710 TB total system memory • Cray Gemini 3D Torus Interconnect • 9 MW peak power
Cray XK7 Compute Node XK7 Compute Node CharacterisIcs AMD Opteron 6274 Interlagos 16 core processor Tesla K20x @ 1311 GF Host Memory 32GB 1600 MHz DDR3 Tesla K20x Memory 6GB GDDR5
en2 PCIe G
HT3 HT3
Gemini High Speed Interconnect Z Y X
51
Slide courtesy of Cray, Inc.
Titan: Cray XK7 System System: 200 Cabinets 18,688 Nodes 27 PF 710 TB
Compute Node: 1.45 TF 38 GB 52
Board: 4 Compute Nodes 5.8 TF 152 GB
Cabinet: 24 Boards 96 Nodes 139 TF 3.6 TB
Sequoia ¨ USA, 2012: BlueGene strikes
back ¨ Built by IBM for NNSA and installed at LLNL ¨ 20,123.7 TFLOPS peak performance
Ø Blue Gene/Q architecture Ø 1,572,864 total PowerPC A2 cores Ø 98,304 nodes in 96 racks occupy 280m2 Ø 1,572,864 GB DDR3 memory Ø 5-D torus interconnect Ø 768 I/O nodes Ø 7890kW power, or 2.07 GFLOPS/W Ø Achieves 16,324.8 TFLOPS in HPL (#1 in June 2012), about 14 PFLOPS in HACC (cosmology simulation), and 12 PFLOPS in Cardioid code (electrophysiology)
Systems
Japanese K Computer
Linpack run with 705,024 cores at 10.51 Pflop/s (88,128 CPUs), 12.7 MW; 29.5 hours Fujitsu to have a 100 Pflop/s system in 2014
54
China ¨ First Chinese Supercomputer to
use a Chinese Processor
Ø Sunway BlueLight MPP Ø ShenWei SW1600 processor, 16 core, 65 nm, fabbed in China Ø 125 Gflop/s peak Ø #14 with 139,364 cores, .796 Pflop/s & 1.07 Pflop/s Peak Ø Power Efficiency 741 Mflops/W
¨ Coming soon, Loongson (Godson)
processor
Ø 8-core, 65nm Loongson 3B processor runs at 1.05 GHz, with a peak performance of 128 Gflop/s
55
Recent Developments ¨ US DOE planning to deploy O(100) Pflop/s systems for
2017-2018 - $525M hardware ¨ Oak Ridge Lab and Lawrence Livermore Lab to receive IBM and Nvidia based systems ¨ Argonne Lab to receive Intel based system Ø After this Exaflops
¨ US Dept of Commerce is preventing some China
groups from receiving Intel technology
Ø Citing concerns about nuclear research being done with the systems; February 2015. Ø On the blockade list: Ø National Ø National Ø National Ø National
SC Center SC Center University SC Center
Guangzhou, site of Tianhe-2 Tianjin, site of Tianhe-1A for Defense Technology, developer Changsha, location of NUDT 56
Yutong Lu from NUDT at the International Supercomputer Conference in Germany in July
07 57
07 58
Industrial Use of Supercomputers • Of the 500 Fastest Supercomputer • Worldwide, Industrial Use is ~ 50%
• • • • • • • • • • • • • • • • • • • • • • • • • • •
Aerospace Automotive Biology CFD Database Defense Digital Content Creation Digital Media Electronics Energy Environment Finance Gaming Geophysics Image Proc./Rendering Information Processing Service Information Service Life Science Media Medicine Pharmaceutics Research Retail Semiconductor Telecomm Weather and Climate Research Weather Forecasting
59
Power is an Industry Wide Problem ¨ Google facilities Ø leveraging hydroelectric power “Hiding in Plain Sight, Google Seeks More Power”, by John Markoff, June 14, 2006
Ø old aluminum plants
Google Plant in The Dalles, Oregon, from NYT, June 14, 2006
Microsoft and Yahoo are building big data centers upstream in Wenatchee and Quincy, Wash. – To keep up with Google, which means they need cheap electricity and readily accessible data networking
Microsoft Quincy, Wash. 470,000 Sq Ft, 47MW! 60
Commercial Data Centers Facebook 300,000 sq ft 1.5 cents per kW hour Prineville OR
Microsoft 700,000 sq ft in Chicago
Apple 500,000 sq ft in Rural NC 4 cents kW/h
Future Computer Systems • Most likely be a hybrid design • Think standard multicore chips and accelerator (GPUs) • Today accelerators are attached over slow links • Next generation more integrated • Intel’s Xeon Phi § 244 “threads” 61 cores
• AMD’s Fusion § Multicore with embedded graphics ATI
• Nvidia’s Kepler with 2688 “Cuda cores”, 14 cores § Project Denver plans to develop an integrated chip using ARM architecture in future?
63
Commodity plus Accelerator Today Commodity Intel Xeon 8 cores 3 GHz 8*4 ops/cycle 96 Gflop/s (DP)
Interconnect PCI-X 16 lane 64 Gb/s (8 GB/s) 1 GW/s
Accelerator (GPU) 192 Nvidia K20X “Kepler” 2688 “Cuda cores” .732 GHz 2688*2/3 ops/cycle 1.31 Tflop/s (DP)
6 GB
Cuda cores/SMX
64
Accelerators 80 70
Systems
60 50 40 30 20 10 0 2006 2007 2008 2009 2010 2011 2012 2013 2014
Intel Xeon Phi Clearspeed IBM Cell ATI Radeon Nvidia Kepler Nvidia Fermi
Performance Share of Accelerators Fraction of Total TOP500 Performance
40% 35% 30% 25% 20% 15% 10% 5% 0% 2006
2007
2008
2009
2010
2011
2012
2013
2014
Multi- to Many-Core
All Complex Cores Mixed Big & Small e.g. Intel Xeon Cores
All Small Cores e.g. Intel MIC
• Complex cores: huge, complex, lots of internal concurrency latency hiding • Simple cores: small, simpler core little internal concurrency latency-sensitive 67
Challenges of using Accelerators High levels of parallelism Many GPU/Accelerator cores, serial kernel execution [ e.g. 240 in the Nvidia Tesla; up to 512 in Fermi – to have concurrent kernel execution ]
Hybrid/heterogeneous architectures Match algorithmic requirements to architectural strengths [ e.g. small, non-parallelizable tasks to run on CPU, large and parallelizable on GPU ]
Compute
vs communication gap Exponentially growing gap; persistent challenge
[ Processor speed improves 59%, memory bandwidth 23%, latency 5.5% ] [ on all levels, e.g. a GPU Tesla C1070 (4 x C1060) has compute power o O(1,000) Gflop/s but GPUs communicate through the CPU using O(1) GB/s connection ]
LINPACK EFFICIENCY 100% 90%
Linpack Efficiency
80% 70% 60% 50% 40% 30% 20% 10% 0% 0
50
100
150
200
250
300
350
400
450
500
LINPACK EFFICIENCY 100% 90%
Linpack Efficiency
80% 70% 60% 50% 40% 30% 20% Green – custom innerconnect 10% 0%
Red – 10G Blue – Gigabit Ethernet Purple – Accelerator
0
50
100
150
200
250
300
350
400
450
500
Problem with Multicore • As we put more processing power on the multicore chip, one of the problems is getting the data to the cores
• Next generation will be more integrated, 3D design with a photonic network 71
Moore’s Law Reinterpreted • Number of cores per chip doubles every 2 year, while clock speed decreases (not increases). • Need to deal with systems with millions of concurrent threads • Future generation will have billions of threads!
• Need to be able to easily replace inter-chip parallelism with introchip parallelism
• Number of threads of execution doubles every 2 year
Average Number of Cores Per Supercomputer
Power Level (kW) 20000" 18000" 16000" 14000"
Top25
12000"
43 machines > 1 MW 20 machines > 2 MW
10000" 8000" 6000" 4000" 2000" 0" 0"
50"
100"
150"
200"
250"
300"
350"
400"
450"
500"73
Power Consumption 8 7
TOP10
Power [MW]
6
5.04 x in 5 y
5 4 3
TOP50
3.13 x in 5 y
TOP500
3.25 x in 5 y
2 1 0 2008
2009
2010
2011
2012
2013
Power Efficiency
AMD FirePro Tahiti
Linpack/Power [Gflops/kW]
3,500
Intel Phi
Max-Efficiency
3,000
BlueGene/Q
2,500 2,000
Cell TOP10
1,500 1,000
TOP50
500
TOP500
0 2008
2009
2010
2011
2012
2013
For Exascale need to be around 50 Gflops/W A factor of 20 needed
The High Cost of Data Movement • Flop/s or percentage of peak flop/s become much less relevant Approximate power costs (in picoJoules) 2011
2018
DP FMADD flop
100 pJ
10 pJ
DP DRAM read
4800 pJ
1920 pJ
Local Interconnect
7500 pJ
2500 pJ
Cross System
9000 pJ
3500 pJ
Source: John Shalf, LBNL
• Algorithms & Software: minimize data movement; perform more work per unit data movement.
76
For NVIDIA
nVIDIA's 28nm chips. For a floating point operation costs 20pJ. Getting the operands from local memory (situated 1mm away) consumes 26pJ. If the operands need to be obtained from the other end of the die, it requires 1nJ while if the operands need to be read from DRAM, the cost is 16nJ.
77
Energy Cost Challenge • At ~$1M per MW energy costs are substantial § 10 Pflop/s in 2011 uses ~10 MWs § 1 Eflop/s in 2020 > 100 MWs
§ DOE Target: 1 Eflop/s around 2020-2022 at 20 MWs 78
Looking at the Gordon Bell Prize (Recognize outstanding achievement in high-performance computing applications and encourage development of parallel processing )
¨
1 GFlop/s; 1988; Cray Y-MP; 8 Processors ¤ Static
¨
finite element analysis
1 TFlop/s; 1998; Cray T3E; 1024 Processors ¤ Modeling
of metallic magnet atoms, using a variation of the locally self-consistent multiple scattering method.
¨
1 PFlop/s; 2008; Cray XT5; 1.5x10⁵ Processors ¤ Superconductive
¨
materials
1 EFlop/s; ~2018; ?; 1x10⁷ Processors (109 threads)
Top500 List 54 Edition 1.E+09
1.E+08
1.E+07
1.E+06
Rpeak Extrap Peak
1.E+05
Rmax Extrap Max
1.E+04
1.E+03
1.E+02
1.E+01
1.E+00 0
10
20
30
40
50
60
Top500 List 54 Edition 1.E+09
1.E+08
1.E+07
1.E+06
Rpeak Extrap Peak
1.E+05
Rmax Extrap Max
1.E+04
1.E+03
1.E+02
1.E+01
1.E+00 0
10
20
30
40
50
60
Can I Build an Exascale Machine Today? Sure, #1 system is at ~33 Pflop/s ¨ Need 30 of them. ¨ 33 Pflop/s at 20 MW; need 600 MW ¨ 33 Pflop/s cost ~$400 M; need $12 B ¨ 33 Pflop/s has 3M cores; need 100 M cores ¨ 33 Pflop/s in 1 building; need 30 buildings ¨
¨
Each of these pose great challenges.
The winning architecture for building exascale systems, heterogeneous or homogeneous, and why? • Multicore: Maintain complex cores, and replicate (x86, SPARC, Power7) [#4 and 9] • Manycore/Embedded: Use many simpler, low power cores from embedded (BlueGene, future ARM) [ #3, 5, 7, and 8] • GPU/Coprocessor/Accelerator: Use highly specialized processors from graphics market space (NVidia Fermi, Intel Xeon Phi, AMD) [# 1, 2, 6, and 10]
Intel Xeon E7 (10 cores)
IBM BlueGene/Q (16 +2 cores)
Intel Xeon Phi (60 cores)
Conventional Wisdom is Changing Old Conventional Wisdom •
New Conventional Wisdom
Peak clock frequency as primary limiter for
•
Cost: FLOPs are biggest cost for system: optimize for compute Concurrency: Modest growth of parallelism by adding nodes Memory scaling: maintain byte per flop capacity and bandwidth Uniformity: Assume uniform system performance Reliability: It’s the hardware’s problem
•
performance improvement
•
•
•
•
•
•
•
• •
Power is primary design constraint for future HPC system design Cost: Data movement dominates optimize to minimize data movement Concurrency: Exponential growth of parallelism within chips Memory Scaling: Compute growing 2x faster than capacity or bandwidth Heterogeneity: Architectural
and performance non-uniformity increase
Reliability: Cannot count on hardware protection alone
Evolution Over the Last 30 Years • Initially, commodity PCs where decentralized systems • As chip manufacturing process shank to less than a micron, they started to integrate features on-die: § 1989: § 1999: § 2009: § 2016:
FPU (Intel 80486DX) SRAM (Intel Pentium III) GPU (AMD Fusion) DRAM on chip (3D stacking) 1/12/16
85
Future Systems May Be Composed of Different Kinds of Cores DRAM chips (cells)
3D DRAM (cells)
Latency
Lower latency Memory controller
Address
Data
Address
Data
Higher bandwidth
Memory controller
1/12/16
86
1/12/16
87
Major Changes to Software • Must rethink the design of our software § Another disruptive technology • Similar to what happened with cluster computing and message passing
§ Rethink and rewrite the applications, algorithms, and software
88
Critical Issues at Peta & Exascale for Algorithm and Software Design • Synchronization-reducing algorithms § Break Fork-Join model
• Communication-reducing algorithms § Use methods which have lower bound on communication
• Mixed precision methods § 2x speed of ops and 2x speed for data movement
• Autotuning § Today’s machines are too complicated, build “smarts” into software to adapt to the hardware
• Fault resilient algorithms § Implement algorithms that can recover from failures
• Reproducibility of results § Today we can’t guarantee this. We understand the issues, but some of our “colleagues” have a hard time with this.
Conclusions • For the last decade or more, the research investment strategy has been overwhelmingly biased in favor of hardware. • This strategy needs to be rebalanced barriers to progress are increasingly on the software side. • Moreover, the return on investment is more favorable to software. § Hardware has a half-life measured in years, while software has a half-life measured in decades. • High Performance Ecosystem out of balance § Hardware, OS, Compilers, Software, Algorithms, Applications • No Moore’s Law for software, algorithms and applications