transcoding techniques such as thumbnailing of GIF images have the ... Simple HTML tag transcoding such as HR or LI are more effectual for images that.
CS–1999–17 Transcoding Characteristics of Web Images Surendar Chandra Carla Schlatter Ellis
Ashish Gehani Amin Vahdat
Department of Computer Science Duke University Durham, North Carolina 27708–0129
November 1999
Transcoding Characteristics of Web Images Surendar Chandra, Ashish Gehani, Carla Schlatter Ellis and Amin Vahdat Department of Computer Science, Duke University, Durham, NC 27708 {surendar,geha,carla,vahdat}@cs.duke.edu
Abstract Transcoding is a powerful technique employed by network proxies to dynamically customize multimedia objects for prevailing network conditions and individual client characteristics. Transcoding can be performed along a number of different axes and the specific transcoding technique used depends on the type of multimedia object. Our research goal is to understand the nature of typical internet images and their transcoding characteristics. We focus our attention on transcodings that customize an image for file size savings. In this paper, we analyze the characteristics of images available on the web. We show that most GIF images accessed on the Internet in a representative trace are small; about 80% of the GIF images are smaller than 6 KBs. On average, JPEG images are larger than GIF images; about 40% of the JPEG images are larger than 6 KBs. We also establish the characteristics of popular image transcoding operations. We show that for JPEG images, the JPEG compression metric and a transcoding that reduces the spatial geometry are productive transcoding operations. We also show that, unless proper transcoding parameters are chosen, traditional transcoding techniques such as thumbnailing of GIF images have the potential of actually increasing the output image size. Our results allow the developers of a transcoding proxy server to choose the appropriate transcoding techniques for the important classes of internet images.
1 Introduction The advent of inexpensive hardware such as powerful personal computers, digital cameras, scanners and other easy-to-use technologies is making it easier for the average user to dabble in multimedia. The phenomenal growth of Internet technologies such as the Web and electronic mail allows users to disseminate and share these multimedia objects. While the ability to share multimedia objects makes the Internet more valuable to consumers, the capabilities of the clients and the underlying network are not always able to keep up with this shifting usage. Users access multimedia objects from a wide variety of devices with different resource constraints. Users are not only accessing multimedia objects from traditional desktops, but they are also using mobile devices such as palmtops and laptops as well as newer devices such as webtops and navigation systems that are resource constrained in terms of their processing, storage and display capabilities. Similarly, the network capabilities used in accessing these multimedia objects vary widely from wired networks such as high speed LANs, ISDN, DSL, cable and telephone modems to wireless technologies such as cellular, CDPD, Ricochet and GSM networks. Depending on the technology used, the networks exhibit a wide variability in speed, reliability and cost. In such an environment of varying network, storage and display capabilities, one size does not fit all. Consumers using expensive networks may wish to download multimedia images for the lowest possible cost. On the other hand, consumers using high speed networks and high quality displays may desire to view the multimedia images at the highest quality. Further, consumers using slow networks want to view the images as quickly as possible. Transcoding has been used in a number of systems [3, 4, 11, 12, 26, 23, 22, 21, 19, 27, 8, 17, 1, 28] to serve the same multimedia object at different quality levels to different users. Transcoding is a transformation that converts a multimedia object from one form to another, frequently trading object fidelity for size. Some of the transcoding choices for images include color reduction, spatial size reduction (e.g. thumbnails), increasing lossy compression, transliteration to audio and text, etc. Though transcoding has been used to target a multimedia object for a particular device, in this work we are concerned with intentional transcoding to save file size. By their very nature, multimedia objects are amenable to such soft access where users are willing to compromise object fidelity for faster/cheaper access. Our research goal is to understand the nature of typical internet images and their transcoding characteristics. We focus our attention on transcodings that customize an image for file size savings. Such knowledge allows the service to choose potential transcoding techniques that offer benefits for a wide variety of im2
ages. Such knowledge also allows the service to avoid choosing transcoding techniques that might appear promising but are not effective for their target workload. For our experiments, we analyze a large number of GIF [5, 6] and JPEG [13] images collected from the NCAR NLANR proxy access logs. We show that most of the GIF images are small; about 80% of the GIF images are smaller than 6 KBs. About 45% of these GIF images appear to be bullets, icons, lines or banners. On average JPEG images are larger than GIF images, 40% of the JPEG images are larger than 6 KBs. About 30% of these small JPEG images appear to be bullets, icons, lines or banners. These image characteristics have implications for transcoding techniques. Simple HTML tag transcoding such as HR or LI are more effectual for images that can be identified as serving in the role of bullets or lines. Our evaluations of image transcodings show that there is significant opportunity for sophisticated transcoding of JPEG images. We show that for JPEG images, the JPEG compression metric and a transcoding that reduces the spatial geometry are productive transcoding operations. Since the compression metric loses visually imperceptible information first, it is a good transcoding that reduces image file size, sacrificing as little visual information as possible. Unless proper transcoding parameters are chosen, traditional transcoding techniques such as thumbnailing of GIF images have the potential of actually increasing the output image file size. The remainder of this paper is organized as follows: Section 2 describes our experimental setup. Section 3 describes the characteristics of the images and Section 4 describes the results of performing various transcoding on the images. Section 5 describes related work. We conclude in Section 6.
2 Experiment Objectives and Design 2.1 Objectives We designed our experiments to answer the following questions:
• What are the characteristics of the images accessed on the Internet today? • How do various image transcoding techniques perform for these images? We are mainly concerned with transcodings that yield file size savings (as opposed to transcoding to fit an image to the target device characteristics). Hence we define a transcoding that saves at least 50% of the file size for 50% of the images as a productive transcoding. 3
2.2 Image Collection A workload of typical images accessed on the Web is crucial for drawing realistic conclusions about the effectiveness of a transcoding operation. However, standard access trace collections from network proxy and client web traces [24, 7] are either too old or hash the URL’s accessed so as to protect the privacy of the participants. For our study, we need the actual images so that we can measure the applicability of transcoding to the actual images and not to some synthetic images that were generated to be of the same size as the images available in an access trace. Hence, for our experiments, we use the Squid proxy logs from NLANR [29]. NLANR proxy caches make their traces (with actual, unscrambled URL’s) publicly available for the most recent seven day period. For our study, we utilized access traces that were collected on Sep 27, 1999 from the NCAR proxy at Boulder, Colorado. Of the images in the trace log, 74.81% of the images were GIF images and 24.41% of the images were JPEG images. Other image formats, including PNG make up the rest of the (0.78%) requests. GIF and JPEG images comprised 48.61% and 50.88% of the image bytes transferred, respectively. Interestingly, while most of the images are GIF’s, bytes transferred are evenly distributed between GIF’s and JPEG’s. For our experiments, we downloaded 97990 GIF images and 37616 JPEG images, totaling 402 MBs and 440 Mbytes respectively, identified from the NCAR cache access log. We tracked the various top-level internet domains from which our images came. Not counting repeated accesses to the same image, we have found that the vast majority of the images in our collection (80% of GIFs and 77% of JPEGs) are from the .com domain.
2.3 Implementation Details For our experiments, we used utilities from NetPBM [16] and libjpeg [20] to perform the various transcoding operations on GIF and JPEG images.
3 Static Image Characteristics In order to understand the characteristics of images accessed on the internet today, we first analyze the static characteristics of the images. Static image characteristics such as image geometry, file size, etc. give a sense of the possible axes along which transcoding can take place. In the next section, we analyze the transcoding characteristics for the images. We place emphasis on the characteristics of transcoding operations that make 4
100
Cumulative Distribution (%)
80
60
40
20
GIF (actual) GIF (size/#animations) JPEG 0 0
5
10
15
20
25
30
35
40
45
50
Image Size (KBs) - rounded down (0 to 1023 bytes is represented as 0 KB)
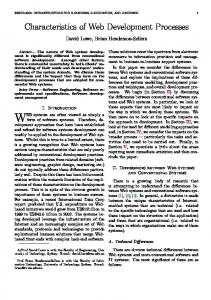
Figure 1: Image file size distribution sense for our image collection based on these static image characteristics.
3.1 Image File Size First we analyze the file sizes of the images in our workload. We plot the image file size distribution as a cumulative distribution in Figure 1. From Figure 1, we note that most (about 80%) of the GIF images are small (< 6 Kilobytes). By contrast, about 60% of the JPEG images are smaller than 6 Kilobytes. Since GIF images may be animations [5, 6] where a number of individual images are packed into a single GIF image file, we analyzed the number of animations in GIF images. We found that 14% of the GIF images contain more than one animation frame. 1% of the GIF images had more than 20 animation sequences per image. An obvious way to deal with large GIF files composed of numerous animations is to reduce or eliminate all but one of the individual animation frames. Next we plotted the average size of an animated frame in a GIF image size [measured as the image file size / number of animations] as a cumulative distribution in Figure 1. From Figure 1 we note that about 90% of the GIF images have frame size less than 6 KBs. Traditional human factors research [25] has shown that the response time for accessing a resource should 5
100
Cumulative Distribution (%)
80
60
40
20
0 0
50
100
150
200
250
Number of unique colors in the image
Figure 2: Distribution of number of unique colors in GIF images be in the 1 to 10 second range for information to be useful. If the response time is longer than this range, the users tend to lose interest and go on to other things. For our work, we choose a response time of 5 seconds as our preferred latency. We estimate the file size limit for images to be served within 5 seconds in the Internet. Users at least use a 9600 baud modem to connect to the internet. We compute the image size that can be served within a latency of 5 seconds on a 9600 baud modem at 5.9 KB. For many internet usage scenarios, it is less interesting to transcode images less than 6 KB in size. We conclude that typically transcoding is not necessary for over 90% of the GIF images and 60% of the JPEG images.
3.2 Number of colors Next we analyze the number of unique colors in an image. GIF compression is optimized for line drawings with a small number of colors. Hence, reducing the number of colors is a potential transcoding for GIF images. For the GIF images, we plot the number of unique colors in each image as a cumulative distribution in Figure 2. GIF specifies the number of bits required per pixel in an image in its screen descriptors. This restricts the number of unique colormap choices to a power of 2, which is evidenced in the clustering of the 6
100
Cumulative Distribution (%)
80
60
40
20
0 0
10
20
30
40
50
60
70
80
90
100
JPEG Quality Factor
Figure 3: Initial Quality Factor of the JPEG images number of unique colors (Figure 2) Also note that at least 20% of the GIF images have 256 unique colors suggesting that these images may be photographs (which are better suited to JPEG compression). On the other hand, the number of unique colors in an image compressed using a lossy compression technique such as JPEG not only depends on the image, but also on the precision of the decoder. Integer round-off errors introduced by the decoder add imprecision in the decoded color values. The exact number of colors does not provide much information about the original image and hence the number of unique colors for JPEG images is not explored here. JPEG is optimized for photographs and defines two color modes, TrueColor and GrayScale. For the images in our collection, 5% of the JPEG images were GrayScale.
3.3 JPEG Compression Metric Lossy compression techniques such as JPEG define a way to specify the amount of "lossiness" using metrics such as the compression metric (also referred to as the JPEG Quality Factor by Independent JPEG Group [20]). The Quality Factor value that was used in encoding a JPEG image is not stored along with the image. In our earlier work [2], we developed an algorithm to accurately measure the initial JPEG Quality Factor 7
1000 BULLET LINE ICON BANNER
Height (in pixels)
800
600
400
200
0 0
200
400
600
800
1000
Width (in pixels)
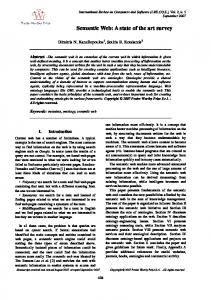
Figure 4: Image spatial size distribution - GIF images of an image. Using our algorithm, we calculate the initial JPEG Quality Factor of the JPEG images in our image collection. The results are plotted as a cumulative distribution in Figure 3. From Figure 3, we note that about 50% of the JPEG images have Quality Factor values greater than 75.
3.4 Spatial geometry size Thumbnailing images is a popular transcoding operation. For thumbnailing to be useful, the original images themselves should be originally above a threshold minimum dimension. Hence, we analyze the spatial geometry characteristic of this set of internet images. For the images in our collection, the spatial size of the images (width vs height) for GIF and JPEG images are plotted in Figure 4 and Figure 5 respectively. From Figure 4, we note that a significant proportion of GIF images are small (less than 150x150 pixels). Also, many GIF images are wider than taller (aspect ratio of width to height greater than 10:1). From Figure 5, we note that JPEG images have a rectangular aspect ratio (1:1, 2:3 and 3:2 appear to be popular) as compared to GIF images. We classify images based on the following heuristics: 8
1000 BULLET LINE ICON BANNER
Height (in pixels)
800
600
400
200
0 0
200
400
600
800
1000
Width (in pixels)
Figure 5: Image spatial size distribution - JPEG images • Bullets - images that are smaller than 25x25 pixels are categorized as bullets. Even though the images might themselves contain high quality images and arrows, such small images convey little useful information and can usually be transcoded into the HTML LI tag. • Lines - images whose width is greater than 300 pixels and height less than 25 pixels are deemed to be lines. Content providers typically use such images to provide a visually pleasing line. However, these images can be simply transcoded using the HTML HR tag. • Icons - images that are between 25x25 and 100x100 pixels in size are probably serving a role as icons. On typical computer displays (96 dpi monitors), this translates to between 0.25" and 1". These small images are typically used to give the user a hint of a larger image. Hence they can be transcoded to their HTML ALT text. • Banners - images that are wider than 300 pixels with a height between 25 and 100 pixels are often used as banners. Typical advertisement banners and background images fall in this range. Even though advertisers might object to transcoding banners, a transcoding system can transcode banners 9
Image Type Bullets Lines Icons Banners TrueImages
GIF images (%) 9.96 2.94 17.57 12.80 56.73
JPEG images (%) 0.64 3.27 21.86 4.41 69.82
Table 1: Image category distribution
with the HTML ALT text. We advocate that advertisers should provide network friendly ALT texts to advertise their products.
• TrueImages - We define images that do not belong to any of the categories mentioned above as TrueImages. Image level transcoding is typically appropriate for TrueImages. Obviously, some of our TrueImages may serve as icons or banners since we have been fairly conservative in our defining dimensions.
These image classification boundaries are illustrated in Figures 4 and 5. For our collection, the distribution of images in the various categories is tabulated in Table1. From Table1, we note that about 43% of GIF images and 30% of the JPEG images are for categories other than TrueImages. We note that TrueImages that are larger than 6 KB (throughout the rest of this paper, we will refer to TrueImages that are larger than 6 KB as LargeTrueImages) make up 181.3 MB (45.1%) and 344.5 MB (78.3%) of GIF and JPEG data, respectively. Hence, throughout the rest of this paper, we place special emphasis on the characteristics of LargeTrueImages. To summarize, in this section, we analyzed our collection of images accessed in the Web for static characteristics such as their file size, geometry, number of unique colors and initial Quality Factor of JPEG images. We note that most of the GIF images (80%) are small (less than 6 KBytes). Simple transcoding filters such as bullets, icons, lines and banners remove about 45% of the GIF images from image transcoding consideration using simple HTML tags. We note that about 10% of the GIF images are LargeTrueImages. However, these images make up 45.1% of the data transferred for all GIF images. On the contrary, about 70% of the JPEG images are TrueImages. About 35% of the images are LargeTrueImages. These 35% of the images consume 78.3% of the JPEG data transferred. Hence, JPEG transcoding is promising for a larger set of images (35%) than for GIF images (10%) and also account for more of the consumed bandwidth. 10
100
Cumulative Distribution (%)
80
60
40
20
JPEG - All images JPEG - TrueImages JPEG - LargeTrueImages > 6KB GIF - All images GIF - TrueImages GIF - LargeTrueImages
0 0
20
40
60
80
100
120
Percentage of Original File Size
Figure 6: Transcoding that reduces the spatial geometry by a factor of 2 along each axis
4 Image Transcoding Characteristics In the previous section, we analyzed the static characteristics of images accessed on the Internet. In this section, we analyze the transcoding characteristics of these images. For our study, we emphasize transcoding of LargeTrueImages. We explore transcodings that reduce the spatial geometry (frequently referred to as thumbnailing), the number of unique colors in an image, the JPEG compression metric as well as transcodings that change the image formats.
4.1 Transcoding that reduces the spatial geometry First we analyze a transcoding that reduces the spatial size of an image, frequently referred to as thumbnailing. For our experiments, we reduce the spatial geometry of all the images as well as LargeTrueImages. We reduce the geometry by a factor of 2 and 4 along each axis (which translates to 25% and 6.25% of the original image pixels). The resulting image file size as a percentage of the original image file size is plotted as a cumulative distribution in Figure 6 and Figure 7, respectively. 11
100
Cumulative Distribution (%)
80
60
40
20
JPEG - All images JPEG - TrueImages JPEG - LargeTrueImages > 6KB GIF - All images GIF - TrueImages GIF - LargeTrueImages
0 0
20
40
60
80
100
120
Percentage of Original File Size
Figure 7: Transcoding that reduces the spatial geometry by a factor of 4 along each axis
From Figure 6 we note that 65% of the JPEG images lose at least 50% of the image size for a transcoding that reduces the image geometry by a factor of 2 on each axis. Most (90%) of JPEG LargeTrueImages lose at least 50% of the image size. However, for the GIF images 25% of the images actually increase in size compared to the original image (image transcodes to a size that is more than 100% of the original image size). 20% of the GIF images save at least 50% of the original image file size. 40% of GIF LargeTrueImages save at least 50% of the original image file size. Transcodings that reduce the spatial geometry by a factor of 4 along each axis are shown in Figure 7. We note that 40% of the GIF images and 90% of the JPEG images lose at least 50% of the image file size. We note that most (>99%) of the GIF and JPEG LargeTrueImages transcode to less than 50% of the original image file size. A few GIF images (40% and 2% of the GIF images for a transcoding that reduces the image by a factor of 2 and 4 along each axis, respectively) transcode to a size that is larger than the original image file size (image transcodes to a size that is more than 100% of the original image size). GIF [5, 6] uses a variation of the LZW compression algorithm to reduce the number of bits required to store frequently occurring color 12
map values. In the GIF algorithm, pixels can be represented by 3 to 12 bits depending on the frequency of occurrence. A transcoding that reduces the spatial geometry tends to increase the number of unique colors in an image as original color values are replaced by a new average color value. Since it takes more bits to represent less frequent pixels, introducing less frequent color values with low occurrence frequency leads to an increase in the output image size; against our goal for transcoding an image to reduce its size. We will use an example to illustrate this problem. One of the GIF images in our collection of geometry 345x145 (file size 2999 bytes and 7 unique colors) was transcoded to a GIF image of geometry 173x73. The new image was 3005 bytes and had 133 unique colors. The popular color (which will be represented by 3 bits) occurred 90.88% of the time in the original image, while it only occurred 85% of the time in the transcoded image. Subsequently reducing the number of unique colors in the transcoded image to 7 produced an output image of size 1276 bytes (even though this image was visually less pleasing). The images have to be transcoded to a sufficiently small spatial size to overcome this effect. This phenomenon can be observed by the increase in the number of images that show space saving between a transcoding that reduces the spatial geometry by a factor of 2 (60% in Figure 6) and a transcoding that reduces the spatial geometry by a factor of 4 (98% in Figure 7). Reducing the image spatial geometry (both by a factor of 2 and 4 along each axis) is a productive transcoding for JPEG images as at least 50% of the images lose at least 50% of the file size. In the case of GIF images, reducing the image spatial geometry by a factor of 4 along each axis is a productive transcoding only for the GIF LargeTrueImages as at least 50% of the images lose at least 50% of the file size.
4.2 Transcoding that reduces the number of unique colors in an image Next we analyze transcoding operations that reduce the number of unique colors in an image. For the GIF images in our collection, we reduce the number of unique colors for all the images as well as for LargeTrueImages. We reduce the number of unique colors by 1/2 and 1/4 of their original values. The resulting image file size as a percentage of the original image file size is plotted as a cumulative distribution in Figure 8. From Figure 8 we note that for a transcoding that reduces the number of unique colors to 50% and 25% of the original unique colors, 8% and 20% of the images lose 50% of the original image file size, respectively. The results are worse for GIF LargeTrueImages, where for transcoding the images to lose 50% and 25% of the original unique colors, 2% and 5% of the images lose 50% of the original image file size, respectively. Hence reducing the number of unique colors in a GIF image is not a productive transcoding. 13
100 50% of original #colors 50% of original #colors (TrueImage) 50% of original #colors (LargeTrueImage) 25% of original #colors 25% of original #colors (TrueImage) 25% of original #colors (LargeTrueImage)
Cumulative Distribution (%)
80
60
40
20
0 0
20
40
60
80
100
Percentage of Original File Size
Figure 8: Transcoding that reduces the number of unique colors in GIF images
This phenomenon of color value distribution change affecting the LZW compression was noted earlier in Section 4.1.
As discussed in Section 3.2, reducing the number of unique colors in a lossy compression such as JPEG is not appropriate. JPEG supports two color modes: GrayScale and TrueColor. We analyze the effectiveness of converting JPEG TrueColor images to GrayScale images for the JPEG images in our collection. The resulting image file size as a percentage of the original image file size is plotted as a cumulative distribution in Figure 9. From Figure 9, we note 15% of the JPEG images lose 50% of the image file size. LargeTrueImages perform slightly better than the entire image collection (25% of the images lose 50% of the image file size).
Since fewer than 25% of images lose 50% in image file size, reducing the number of colors does not appear to be a productive transcoding operation, either for GIF or JPEG images. 14
100 All images TrueImages LargeTrueImages
Cumulative Distribution (%)
80
60
40
20
0 0
20
40
60
80
100
120
Percentage of Original File Size
Figure 9: Transcoding that converts a TrueColor JPEG image to a GrayScale JPEG image
4.3 Transcoding that changes the image format Next we explore a transcoding that changes the format of the images themselves; GIF to JPEG and JPEG to GIF format. Even though JPEG compression is better suited for full color photographs and GIF format is better suited for line drawings, transcoding among the formats is a popular image transcoding [11] and hence we explore the characteristics of this transcoding. One variable in converting from a lossless compression technique such as GIF to a lossy compression algorithm such as JPEG is the choice of the compression metric for the JPEG images. For our experiments, we transcode the GIF images to JPEG images of Quality Factor values of 25, 50 and 75. The resulting image file size as a percentage of the original image file size is plotted as a cumulative distribution in Figure 10. From Figure 10, we note that transcoding GIF images to JPEG images of Quality Factor values of 25, 50 and 75 can lead to an increase in the image file size for 50%, 60% and 70% of the GIF images respectively. Since an increase in file size is against our goal for performing a transcoding, such a transcoding is not productive. We note that transcoding to JPEG images of Quality Factor values of 25, 50 and 75 provide at least 50% 15
100
Cumulative Distribution (%)
80
60
40
20
0 0
20
40
60
80
100
Percentage of Original File Size GIF (ALL) to JPEG (Q=25) GIF (ALL) to JPEG (Q=50) GIF (ALL) to JPEG (Q=75) GIF (TrueImages) to JPEG (Q=25) GIF (TrueImages) to JPEG (Q=50) GIF (TrueImages) to JPEG (Q=75) GIF (LargeTrueImages) to JPEG (Q=25) GIF (LargeTrueImages) to JPEG (Q=50) GIF (LargeTrueImages) to JPEG (Q=75)
Figure 10: Transcoding that converts GIF images to JPEG images
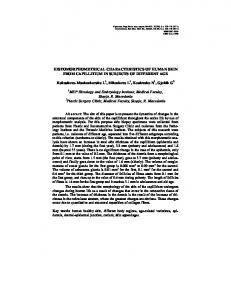
saving in size for 50%, 65% and 80% of the GIF LargeTrueImages respectively. Hence transcoding GIF images to JPEG images is a productive transcoding for GIF LargeTrueImages as at least 50% of the images save at least 50% in file size. GIF images are better optimized for line drawings with few colors. On the other hand, JPEG is optimized for photographs. Hence a GIF image with many colors might be expected to be better compressed as a JPEG image. To test this hypothesis, we analyzed the transcoding characteristics of transcoding GIF images with over 250 unique colors to JPEG images. The resulting image file size as a percentage of the original image file size is plotted as a cumulative distribution in Figure 11 From Figure 11, we note that such a transcoding is not productive as less than 30% of the images provide savings of 50% of the image file size. In order to better understand this counter-intuitive result, we visually inspected these GIF images and found that most of these GIF images appear to be computer generated (by composing photographs and textual information). Hence, even though the number of unique colors is over 250, the images are still overwhelmingly line drawings and hence are better encoded as GIF images. We show one such GIF image sample in Figure 12 for reference. 16
100 GIF (#colors > 250) to JPEG (Q=25) GIF (#colors > 250) to JPEG (Q=50) GIF (#colors > 250) to JPEG (Q=75)
Cumulative Distribution (%)
80
60
40
20
0 0
20
40
60
80
100
Percentage of Original File Size
Figure 11: Transcoding that converts GIF images (#colors > 250) to JPEG images Next we analyze the transcoding from JPEG to GIF images. Conversion from JPEG to GIF is straightforward. The resulting image file size as a percentage of the original image file size is plotted as a cumulative distribution in Figure 13. From Figure 13, we note that transcoding JPEG to GIF images is not a productive transcoding as less than 5% of the images show savings of 50% of the original image file size. Most images (90%) are larger than the original JPEG images. In summary, converting GIF images to JPEG images is a productive transcoding only for GIF LargeTrueImages as at least 50% of the images save at least 50% in file size.
4.4 Transcoding that changes the JPEG Compression Metric Next we explore transcodings that change the level of "lossiness" in an image. Lossy compression techniques such as JPEG define a way to control the amount of lossiness using a compression metric. The compression metric utilizes quantization tables such that images lose least perceptible artifacts first. Hence, changing the compression metric is intuitively a good transcoding metric for JPEG images. Earlier work [10, 18, 9] confirmed that JPEG compression metrics such as JPEG Quality Factor outperformed other measures in 17
Figure 12: Sample GIF image with 256 unique colors that was better encoded as GIF (rather than JPEG) predicting the quality loss of an image. For our experiments, we reduce the image Quality Factors by 25%, 50% and 75% of the original image Quality Factor values. The resulting image file size as a percentage of the original image file size is plotted as a cumulative distribution in Figure 14. From Figure 14, we note that cumulative distribution of the file sizes for all the images are similar to the distribution for JPEG TrueImages. For a transcoding that reduces the image Quality Factor by 25%, 95% of all the JPEG images lose 50% of the file size while over 99% of all the JPEG LargeTrueImages lose 50% of the file size. For a transcoding that reduces the image Quality Factor value by 50%, we note that 50% of all the JPEG images lose 50% of file size and 80% of all the JPEG LargeTrueImages lose 50% of file size. Finally, for a transcoding that reduces the image Quality Factor value by 75% we note that 25% of all the JPEG images lose at least 50% of file size and 45% of all the JPEG LargeTrueImages lose 50% of file size. Hence, we conclude that changing the JPEG compression metric is a productive image transcoding Next, we utilize the notion of efficient transcoding that we developed earlier [2] where we defined efficient transcoding as a transcoding that loses more in file size than image Quality Factor. An efficient transcoding gives a measure of worthwhile savings in size. Since for our experiments we reduce the image 18
JPEG - All images JPEG - TrueImages JPEG - LargeTrueImages
14
Cumulative Distribution (%)
12
10
8
6
4
2
0 0
20
40
60
80
100
Percentage of Original File Size
Figure 13: Transcoding that converts JPEG images to GIF images (notice change of scale of Y axis)
Quality factors by 25%, 50% and 75% of the original image Quality Factor values, an efficient transcoding would lose at least 25%, 50% and 75% in size respectively. In Figure 14, we draw the threshold 25%, 50% and 75% lines to mark the efficient images for the various transcodings. From Figure 14, we note that for transcodings that transcode images to 25%, 50% and 75% of the initial Quality Factor values, 25%, 50% and 70% of the JPEG images transcoded efficiently. We also note that 50%, 75% and 75% of LargeTrueImages transcoded efficiently for the same transcodings
In summary, we note that the JPEG compression metric is a productive transcoding operation for all JPEG images. In addition, for JPEG LargeTrueImages, reducing the spatial geometry (thumbnailing) is a productive transcoding. On the other hand, the only productive transcodings for GIF images are for transcoding GIF LargeTrueImages; transcoding to JPEG images and a transcoding that reduces the spatial geometry at least by a factor of 4 along each axis are productive. None of the other image transcoding techniques explored provide significant savings for all GIF images. 19
100
Cumulative distribution (%)
80
60
40
All images (25% Q) All images (50% Q) All images (75% Q) TrueImages (25% Q) TrueImages (50% Q) TrueImages (75% Q) LargeTrueImages (25% Q) LargeTrueImages (50% Q) LargeTrueImages (75% Q)
20
0 0
20
40
60
80
100
Percentage of Original File Size
Figure 14: Transcoding that reduces the JPEG image Quality Factor
5 Related Work 5.1 Web object characterization An important part of web characterization is the availability of Web access traces. ACM SIGCOMM sponsors the Internet Traffic Archives [7] as a moderated repository for publicly available internet access traces. This repository consists of client traces from Boston University, and UC Berkeley as well as web server traces from servers such as the Environment Protection Agency, NASA, Clarknet etc. Mogul et al. [24] have made the proxy access traces from Digital Equipment Corp (circa 1996) publicly available. These traces contain information about the time, the size of the request and the request time. These traces do not contain enough information about the multimedia datatypes to infer their transcoding characteristics. NLANR [29] publishes statistics such as the number of objects served, overall bytes served, number of HTTP requests served and the HTTP bytes served for each of the individual proxies since their inception (Dec 1995). 20
5.2 Image Transcoding A number of research and commercial products have used various forms of image transcodings to customize an image for the prevailing network conditions or the destination target device characteristics. Fox et al. [11] used transcoding to render an image on a PDA such as Palmpilot, as well as to offset access latencies from slow modems. Noble et al. [26] manipulated the JPEG Compression metric as a distillation technique for a web browser that adapts to changing network environments. Mazer et al. [23] describe a framework for allowing users to specify their own transcoding transducers for a application-specific proxy that acts on the HTTP stream to customize the stream for a particular client. Ortega et al. [27] have used JPEG progressive encoding to recode images to lower resolutions, thereby increasing the effective cache size. Commercial products such as WebExpress [8] from IBM, QuickWeb technology [17] from Intel, Fastlane [28] from Spectrum Information technology and Johnson Grace ART format [1] from AOL have used various forms of compression and transcoding operations to improve web access from slow networks. Even though transcoding has been widely used in a number of systems to deal with network access latencies, display characteristics or storage space requirements, there has been little formal work in conducting a systematic study to measure the information loss associated with a given transcoding. Han et al. [15, 14] present an analytical framework to quantify transcoding trade-offs. In our earlier work [2], we developed techniques to measure the initial information Quality Factor of a JPEG image as well as the computational costs and space benefits for a transcoding that changes the JPEG compression metric of an image. We utilized this informed transcoding technology in a transcoding web proxy serving mobile clients that access the web using slow and expensive networks [3]. We demonstrated that it is possible to use informed transcoding techniques to balance the demand for quality of multimedia content while reducing consumed network bandwidth and server CPU overhead. We also utilized informed transcoding in a web service that offers differentiated Quality of Service for different client classes [4]. We demonstrated that it is possible to use informed transcoding techniques to provide differentiated service and to dynamically allocate available bandwidth among different client classes, while delivering a high degree of information content (quality factor) for all clients.
6 Conclusions This paper makes the following contributions to our understanding of the characteristics of images accessed on the web and the use of image transcoding applied to them for size reductions: 21
• Most of the GIF images are small; about 80% of the GIF images are smaller than 6 KBs. Transcoding for size reduction is hardly worthwhile for such small images. • About 45% of the GIF images can be characterized as typical of bullets, icons, lines or banners. Simple HTML tag transcoding such as HR or LI are more effectual for such GIF images. • About 15% of the GIF images are animated GIF’s. An obvious way to deal with large GIF files composed of numerous animations is to reduce the number of individual animation frames. • Around 10% of the GIF images are TrueImages larger than 6 KB. However they make up 45.1% of the GIF data transferred. • For GIF LargeTrueImages, transcodings that reduce the spatial geometry at least by a factor of 4 along each axis as well transcoding the GIF images to JPEG images are productive (where at least 50% of the images lose at least 50% of image file size). • Popular transcoding techniques such as thumbnailing of GIF images have the potential of actually increasing the output image size. • There are more significant opportunities for JPEG images; on average JPEG images are larger than GIF images. 40% of the JPEG images are larger than 6 KBs. About 30% of JPEG images are TrueImages as we define them. 78.3% of the JPEG data is transferred for LargeTrueImages (35.6%). • For JPEG TrueImages, the JPEG compression metric and a transcoding that reduces the spatial geometry are productive transcodings. Since the compression metric loses visually imperceptible information first, it is a better transcoding since it loses image file size while sacrificing as little visual information as possible.
Acknowledgments This work was supported in part by a graduate fellowship from North Carolina Networking Initiative (NCNI). We thank NLANR for making the proxy access traces public. We hope more web sites make their sanitized access logs public.
References [1] America Online Inc. Johnson grace ART image format. 22
[2] Surendar Chandra and Carla Schlatter Ellis. JPEG Compression Metric as a Quality Aware Image Transcoding. In 2nd Symposium on Internet Technologies and Systems, Boulder, CO, October 1999. USENIX. [3] Surendar Chandra, Carla Schlatter Ellis, and Amin Vahdat. Multimedia Web Services for Mobile Clients Using Quality Aware Transcoding. In The Second ACM International Workshop on Wireless Mobile Multimedia, pages 99–108, Seattle, August 1999. ACM SIGMOBILE. [4] Surendar Chandra, Carla Schlatter Ellis, and Amin Vahdat. Differentiated multimedia web services using quality aware transcoding. In INFOCOM - Nineteenth Annual Joint Conference Of The IEEE Computer And Communications Societies, Tel Aviv, Israel, March 2000. IEEE. [5] CompuServe Inc., 5000, Arlington Centre Blvd, Columbus, OH 43220. Graphics Interchange Format (GIF) - A standard defining a mechanism forthe storage and transmission of raster-based graphics information, June 1987. [6] CompuServe Inc., 5000, Arlington Centre Blvd, Columbus, OH 43220. Graphics Interchange Format - Version 89a, 1989. [7] Peter Danzig, Jeff Mogul, Vern Paxson, and Mike Schwartz.
Internet traffic archive.
http://ita.ee.lbl.gov/. [8] Rick Floyd, Barron Housel, and Carl Tait. Mobile Web Access using eNetwork Web Express. IEEE Personal Communications, 5(5), October 1998. [9] A. M. Ford, R. E. Jacobson, G. G. Attridge, and M. R. Pointer. Effects of image compression on image quality. In Royal Photographics Society Symposium on Photographic Image Quality, London, Sep 1994. [10] Adrian M. Ford. Relations between Image Quality and Still Image Compression. PhD thesis, University of Westminster, May 1997. [11] Armando Fox and Eric A. Brewer. Reducing www latency and bandwidth requirements via real-time distillation. In Proceedings of Fifth International World Wide Web Conference, pages 1445–1456, Paris, France, May 1996. [12] Armando Fox, Steven D. Gribble, Eric A. Brewer, and Elan Amir. Adapting to network and client variability via on-demand dynamic distillation. ACM SIGPLAN Notices, 31(9):160–170, September 23
1996. Co-published as SIGOPS Operating Systems Review 30(5), December 1996, and as SIGARCH Computer Architecture News, 24(special issue), October 1996. [13] Eric Hamilton. JPEG File Interchange Format - Version 1.02. C-Cube Microsystems, 1778 McCarthy Blvd, Milpitas, CA 95035, September 1992. [14] Richard Han. Factoring a mobile client’s effective processing speeed into the image transcoding decision. In The Second ACM International Workshop on Wireless Mobile Multimedia, pages 91–98, Seattle, August 1999. ACM SIGMOBILE. [15] Richard Han, Pravin Bhagwat, Richard LaMaire, Todd Mummert, Veronique Perret, and Jim Rubas. Dynamic adaptation in an image transcoding proxy for mobile web browsing. IEEE Personal Communications Magazine, 5(6):8–17, December 1998.
[16] Tony Hansen and Jef Poskanzer. Netpbm release 7. http://wuarchive.wustl.edu/graphics/graphics/packages/NetPBM/net 1mar1994.tar.gz. [17] Intel quickweb. www-us-east.intel.com/quickweb/. [18] R. E. Jacobson, A. M. Ford, and G. G. Attridge. Evaluation of the effects of compression on the quality of images on a soft display. In Proc. of SPIE: Human Vision and Electronic Imaging II, San Jose, CA, Feb 1997. [19] Jussi Kangasharju, Younggap Kwon, and Antonio Ortega. Design and implementation of a soft caching proxy. In 3rd Intl. WWW Caching Workshop, Manchester, England, June 1998. [20] Tom Lane, Philip Gladstone, Luis Ortiz, Jim Boucher, Lee Crocker, Julian Minguillon, George Phillips, Davide Rossi, and Ge’ Weijers. The independent jpeg group’s jpeg software release 6b. ftp.uu.net/graphics/jpeg/jpegsrc.v6b.tar.gz. [21] M. Liljeberg, T. Alanko, M. Kojo, H. Laamanen, and K Raatikainen. Optimizing world-wide web for weakly connected mobile workstations: An indirect approach. In Proceedings of 2nd International Workshop on Services in Distributed and Networked Environments (SDNE’95), Whistler, Canada, June 1995. [22] Mika Liljeberg, Heikki Helin, Markku Kojo, and Kimmo Raatikainen. Mowgli www software: Improved usability of www in mobile wan environments. In IEEE Global Internet 1996, London, England, November 1996. IEEE Communications Society. 24
[23] Murray S. Mazer, Charlie Brooks, John LoVerso, Louis Theran, Fredrick Hirsch, Stavros Macrakis, Steve Shapiro, and Dennis Rockwell. Distributed clients for enhanced usability, reliability, and adaptability in accessing the national information environment. Technical report, The Open Group Research Institute, 11 Cambridge Center, Cambridge MA 02142, 1998. [24] Jeff
Mogul
and
Tom
M.
Kroeger.
Digital’s
web
proxy
traces.
ftp.digital.com/pub/DEC/traces/proxy/webtraces.html, 1996. [25] Jakob Nielsen. Usability Engineering. Academic Press, Boston, MA, 1993. (hardcover), 0-12-5184069 (paperback). [26] Brian D. Noble, M. Satyanarayanan, Dushyanth Narayanan, J. Eric Tilton, Jason Flinn, and Kevin R. Walker. Application-aware adaptation for mobility. In Proceedings of the 16th ACM Symposium on Operating Systems and Principles, Saint-Malo, France, October 1997. [27] Antonio Ortega, Fabio Carignano, Serge Ayer, and Martin Vetterli. Soft caching: Web cache management techniques for images. In IEEE Signal Processing Society 1997 Workshop on Multimedia Signal Processing, Princeton NJ, Jun 1997. [28] Spectrum Information Technologies Inc. Fastlane. www.spectruminfo.com. [29] The National Laboratory for Applied Network Research. A distributed testbed for national information provisioning. http://ircache.nlanr.net/.
25