FEDERAL RESERVE BANK OF NEW YORK ... Since the mid-1980s, unemployment rates in Ireland and the Netherlands have plummeted, while the average ...
FEDERAL RESERVE BANK OF NEW YORK
I N E C O N O M I C S
A N D F I N A N C E
May 2001
Volume 7 Number 5
Curbing Unemployment in Europe: Are There Lessons from Ireland and the Netherlands? Cédric Tille and Kei-Mu Yi
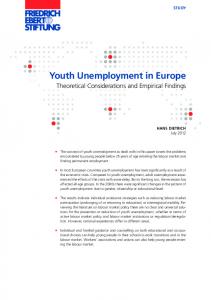
Since the mid-1980s, unemployment rates in Ireland and the Netherlands have plummeted, while the average rate for the European Union has maintained its longtime high level. Ambitious labor market reforms—including wage moderation and the tightening of unemployment benefits— have helped to bring the Irish and Dutch rates down. Other European countries would benefit from adopting similar reforms, but they are unlikely to see the same dramatic improvement in their unemployment numbers. The average unemployment rate in the European Union has remained stubbornly high for the past twenty years. Between the mid-1970s and the mid-1980s, the average rate soared from about 2 percent to more than 10 percent (Chart 1). After easing somewhat at the end of the 1980s, it hovered between 9 and 11 percent for most of the 1990s before dropping to 8.2 percent last year. But while the high average rate across Europe has proved difficult to subdue, two members of the European Union—Ireland and the Netherlands—have managed to cut unemployment sharply during the period, bringing their rates to levels under the low 4.5 percent rate currently prevailing in the United States. How have these two countries escaped the high unemployment rates bedeviling Europe as a whole? Over the past two decades, most European countries have undertaken some labor market reforms. Ireland and the Netherlands, however, have made the deepest and most widespread changes in their wage and work policies. The reforms enacted include wage moderation, income tax cuts, the tightening of unemployment benefits, and reductions in barriers to part-time work. In this edition of Current Issues, we assess the extent to which the Irish and Dutch reforms have helped lower the unemployment rates in these two countries. We draw on existing academic research to evaluate the effect of the reforms, and we consider in addition how the timing of the reforms may have shaped their impact. After
reviewing labor market developments within these countries, we go on to ask whether the Irish and Dutch reforms could be instructive for other European countries seeking to reduce their unemployment rates. Our analysis suggests that the reforms, particularly wage moderation, explain most of the turnaround in the Netherlands’ unemployment rate and at least part of the Chart 1
Unemployment Rate Percentage of labor force 20 Ireland 15
10
5
European Union average
Netherlands
0 1970 72 74 76 78 80 82 84 86 88 90 92 94 96 98 00 Sources: Organisation for Economic Co-operation and Development; authors’ calculations. Note: Unemployment rate = the unemployed /(the employed + the unemployed).
CURRENT ISSUES IN ECONOMICS AND FINANCE
an economy that experiences higher unemployment will see its wages fall. When wages drop, hiring activity accelerates and the unemployment rate declines. However, when a large percentage of unemployed workers become “long-term unemployed,” lower wages are often not enough to induce firms to overcome their misgivings about such workers and give them jobs. Consequently, the economy becomes caught in an unemployment “trap.”3
improvement in Ireland’s. Two features of the reforms emerge as especially important in improving labor market performance. First, the changes were consensual, the product of agreements between employers, unions, and the government. Second, the changes were part of a comprehensive package combining wage restraints with other initiatives that helped soften the impact of the restraints on workers’ net earnings. We conclude that adopting similar reforms could help other European countries reduce unemployment. Nevertheless, the gains would most likely fall short of those seen in Ireland and the Netherlands. Many of the advances brought about by the Irish and Dutch reforms—such as the increased participation of women in the workforce—had occurred earlier in other European countries. Thus, the scope for improvement in the unemployment rates in these countries would undoubtedly be smaller.
The Performance of the Irish and Dutch Labor Markets Given Europe’s record of persistent high unemployment, the achievement of Ireland and the Netherlands in reducing their unemployment rates is remarkable. In 1987, Ireland’s unemployment rate was 17.5 percent, far higher than the European average of 10.0 percent. By 2000, Ireland had cut its rate to 4.2 percent. The turnaround in the Netherlands’ unemployment rate was similarly impressive: the rate dropped from a high of 11.0 percent in 1983 to 2.8 percent in 2000. The unemployment rate in the European Union as a whole improved far less, receding from its mid-1980s peak of 10.3 percent to 8.2 percent in 2000.
Europe’s Chronic High Unemployment The European unemployment rate began to climb in the mid-1970s and hit 10 percent by the mid-1980s (Chart 1). For eighteen of the past twenty years, it has ranged between 8 and 11 percent. The persistence of the high rate sets Europe’s experience apart from that of the United States. The U.S. rate also rose in the mid-1970s and early 1980s, but after peaking at 9.7 percent in 1982, it fell more or less steadily to its current level of about 4.5 percent.
Another indicator of the labor market recovery in Ireland and the Netherlands is the decline in nonemployment (Chart 2). A broader measure than the unemployment rate, the nonemployment rate captures the percentage of the working-age population that is either unemployed or “not in the labor force.”4 People not in the labor force are those who are not working and not actively looking for work—a group that includes homemakers, students, and so-called discouraged workers.
Most economists agree on the sequence of events that has brought about Europe’s sustained high unemployment.1 In the prevailing view, the initial rise in the rate was triggered by a series of adverse shocks—two sharp hikes in oil prices, a slowdown in productivity growth beginning in the early 1970s, and high real interest rates in the 1980s. Once these shocks subsided, certain institutional features of the European labor markets kept unemployment rates from falling. These features include extensive regulations on wage bargaining, working hours, part-time employment, and dismissals, as well as generous unemployment insurance systems.
For much of the 1980s, Irish and Dutch nonemployment rates exceeded the European average by about 10 percentage points. Since then, nonemployment in Chart 2
Nonemployment Rate Percentage of working age population 50
Such regulations can encourage high unemployment rates by reducing the flow of workers in and out of unemployment. 2 For example, unemployed workers may find that rules limiting part-time work prevent them from securing some form of employment. Moreover, workers who have been laid off may find that generous unemployment benefits weaken their resolve to return to work. Of course, the longer such workers are unemployed, the more likely they are to lose their skills and to become discouraged. And as time passes, employers will increasingly view them as risky to hire. This chain of consequences suggests the way in which extensive regulations on work and wages can foster inflexible labor markets and perpetuate unemployment.
Ireland 45 Netherlands 40
30 1980
82
84
86
88
90
92
94
96
98
00
Sources: Organisation for Economic Co-operation and Development; authors’ calculations.
Long-term unemployment, in turn, will reduce an economy’s ability to adjust quickly to shocks. Normally, FRBNY
European Union average
35
Note: Nonemployment rate = (the unemployed + those not in the labor force) / (the employed + the unemployed + those not in the labor force).
2
the Organisation for Economic Co-operation and Development (OECD). In accordance with the Irish national wage pacts, taxes were reduced beginning in 1987, with the marginal rate falling from 35 percent to 29 percent by 1991 in the lowest income bracket, and from 58 percent to 48 percent in the highest bracket. As a result, the average tax burden posed by income and social security taxes fell from 35 percent in 1987 to 31 percent in 1994, and fell further to 29 percent in 1996. By 1994, the tax wedge was below the OECD average.8
Ireland and the Netherlands has fallen roughly 15 percentage points to about 35 percent in 2000, with most of the decline occurring after 1993. This improvement is largely attributable to increased labor force participation rates.5 The movement of women from the home to the workplace accounted for much of the growth in labor force participation in both countries. In Ireland, the labor market turnaround has also encouraged a return migration of workers from the United Kingdom and other countries. Almost all of these workers have come back to jobs, and they now contribute more than 0.6 percentage point to annual Irish labor force growth, reinforcing the declines in unemployment and nonemployment (OECD 1999, p. 72).
Tightening of Unemployment Benefits Other reforms have restricted the size and availability of unemployment benefits. The replacement rate—the ratio of unemployment benefits to after-tax wage income—was reduced from a high of 77 percent to 64 percent in 1994, a level below the OECD average.9 The Irish welfare system traditionally provided “more or less permanent support for the unemployed” with no maximum duration for unemployment assistance.10 In recent years, however, recipients in some age groups have been required to register in a public employment or training program if they wish to continue to receive benefits after their first six months on the rolls.11
Significantly, the dramatic improvement in the Irish and Dutch labor markets since the mid-1980s has coincided with a series of far-reaching labor market reforms in both countries. In the next two sections, we examine these reforms and assess their contribution to the turnaround in the countries’ unemployment rates. Labor Market Reforms in Ireland Spurred by a 17 percent unemployment rate, wage growth that showed little sign of easing, and anemic GDP growth, Ireland began a series of labor market reforms in the late 1980s.6 The reforms included limits on wage increases, reductions in income taxes, a cutback in unemployment benefits, and the adoption of “active labor market policies”—policies favoring public job training and placement programs. The recovery that followed took place in two stages. The first stage, beginning at the end of the decade and continuing until 1993, involved a stabilization of the labor market and a modest decrease in the unemployment rate. The second stage, extending from 1993 to the present, saw a spectacular employment boom.
Active Labor Market Policies In the 1990s, the Irish government increased spending on programs designed to mobilize the labor supply, improve job skills, and increase the efficiency of labor markets. The share of GDP spent on such programs rose from 1.4 percent in 1991 to 1.8 percent in 1995, a level that is twice the OECD average. 12 Community Employment, Ireland’s largest program, targets older people who have been unemployed for long periods. This program provided 40,000 part-time jobs in 1995, equivalent to 3 percent of total employment.
Wage Moderation The most significant initiative in the early period was a three-year national wage pact, the Programme for National Recovery. Supported by employers, trade unions, and the government, the pact limited annual wage increases to 2.5 percent between 1988 and 1990. As part of the pact, the government agreed to offset the limits on wages by cutting income taxes and increasing spending for welfare, health, and housing services. Shortly after the program was launched, the number of workdays lost to strikes fell sharply and business confidence improved. Over time, unemployment declined and GDP growth rose. The success of this pact led to four subsequent pacts, and they appear to have become an enduring feature of the Irish labor market landscape.7
Effect of the Reforms Academic studies of labor market reforms suggest that a number of these initiatives brought significant benefits. Blanchard (2000) identifies wage moderation as the key reform in Ireland because it allowed productivity to grow faster than wages, a development that encouraged employers to increase hiring. Gains in productivity also boosted firms’ profit margins, prompting employers to step up their investment spending. Studying a broad group of European countries, Nickell (1997) finds evidence that income tax reductions have increased the incentive to work and that limits on the duration of benefits may have significantly lowered unemployment. Reforms that have not been found to be useful in reducing unemployment are the job training and placement programs.13
Income Tax Reductions In the early 1980s, Ireland’s “tax wedge”—the difference between the cost of a worker to the employer and the net wage received by the worker—was the fourth highest in
The effectiveness of Ireland’s wage moderation initiative owes much to the consensual nature of the wage pacts. Because the trade unions worked with employers and the government to formulate agreements that would 3
CURRENT ISSUES IN ECONOMICS AND FINANCE
growth had hurt firm profitability, prompting employers to reduce investment spending and cut back on new hiring. The Wassenaar Agreement laid the foundations for a labor market recovery by limiting wage increases, tightening unemployment benefits, and removing barriers to part-time work.
have the backing of all parties, the risks of reneging were minimized. Also contributing to the success of the initiative was the decision to include provisions for tax cuts and enhanced health and housing services in the wage pacts. By offsetting the adverse effects that wage restraints would have on worker earnings, these provisions eased the implementation of the wage agreements.14
Wage Moderation Under the terms of the agreement, the linking of wage increases to inflation increases was eliminated. The minimum wage was first frozen in nominal terms, then reduced in subsequent years, resulting in an overall cut of 22 percent in real, or inflation-adjusted, terms by 1997. The minimum wage also declined relative to the average wage. Together, these changes have kept gross average wages constant in real terms since the early 1980s—an outcome that contrasts sharply with the 25 percent increase in wages during the 1970s. The steadiness of real wages has meant that subsequent productivity gains have lowered the cost of labor, thereby restoring firms’ profitability and ability to invest.
Although the evidence that Ireland’s reforms were effective is strong, existing research does not directly consider the extent to which the reforms could be responsible for the post-1993 employment boom. Certainly, the timing of the reforms makes it difficult to attribute much of the boom to them. Wage moderation began in 1987 and has stayed fairly constant in the ensuing three-year pacts. The most ambitious income tax cuts occurred in the late 1980s, and subsequent reductions have been more moderate. Thus, it seems reasonable to conclude that these reforms were instrumental in producing the first phase of the labor market turnaround in the late 1980s and early 1990s but contributed less to the rapid employment growth after 1993.
Reinforcing the reduction in labor costs was a cut in the tax that firms pay for each worker, especially for low-wage workers. For example, the tax wedge for minimum-wage workers dropped from 30 percent in the 1980s to 15 percent in 1998. The negative effect of wage moderation on workers’ earnings was offset by tax cuts, which pushed the real after-tax wage up 14.8 percent between 1983 and 1998.
Of course, one might take the “longer” view that the reforms laid the groundwork for the post-1993 boom. Nevertheless, if we adopt this perspective, then we must consider how other early reforms may have created the right conditions for the post-1993 employment surge. Consider, for example, the long-term effects of the 1967 legislation mandating free secondary education.15 In 1965, only 50 percent of 15-year-olds and 25 percent of 17-year-olds were in school full-time; by 1992, 100 percent of 15-year-olds and 66 percent of 17-year-olds were full-time students. The most recent statistics suggest that 82 percent of the population now complete upper secondary level education. Since workers who are more highly educated tend to have lower unemployment rates, the upgrading of education levels could well have played a role in the employment boom of the 1990s.
Tightening of Unemployment Benefits The unemployment insurance system was significantly curtailed in 1986-87. The duration of benefits was reduced from thirty to six months for younger workers and the replacement rate was lowered from 80 to 70 percent. Because minimum benefits are linked to the minimum wage, lowering the minimum wage reduced the minimum benefit. By 1998, the minimum benefit had been pared to 60 percent of the average wage, a decline of 9 percentage points from the early 1980s. In addition, in 1995 the government tightened the eligibility standards for benefits, requiring a longer period of employment. Recipients are also now expected to accept a “suitable” job offer; those who refuse such offers receive reduced benefits. Finally, what constitutes a suitable offer is interpreted more liberally for recipients who have had relatively long unemployment spells—a change in the rules that is designed to induce the unemployed to broaden their job search as time passes.
Moreover, education reform may have contributed to the recent explosion in foreign direct investment, a development that the OECD has called “possibly the most important causal influence” on Ireland’s employment boom. 16 Improvements in the education level of the workforce may have helped persuade foreign firms to establish operations in Ireland during the post-1993 period. These firms have become leading employers in the country, accounting for 47 percent of Ireland’s manufacturing jobs alone (OECD 1999, p. 62). Labor Market Reforms in the Netherlands The turnaround in the Dutch labor market began with the so-called Wassenaar Agreement of November 5, 1982. 17 The agreement, reached through negotiations between the government, unions, and employers, followed a period of deterioration when wages were growing significantly faster than productivity. Rapid wage
Removal of Barriers to Part-Time Work The Wassenaar Agreement eased rules on part-time work. Unions waived their opposition to part-time work, and part-time employees became eligible for full social security benefits, including unemployment insurance and disability insurance. The lowering of barriers to part-time work contributed to a large influx
4
FRBNY
of women into the labor force. As a consequence, the nonemployment rate among women fell 17 percentage points between 1979 and 1998, while it remained steady among men. The employment gains of Dutch women were concentrated in part-time jobs: between 1983 and 1998, the percentage of women workers holding parttime jobs rose from 50 to 68 percent.18
The evidence suggests that wage moderation could indeed help lower unemployment rates elsewhere in Europe. Such a strategy is most likely to be successful if it has the backing of the government, trade unions, and employers and if limits on wage growth are accompanied by tax cuts or other measures that soften the negative effects on worker earnings.
Effect of the Reforms The Wassenaar Agreement was quickly followed by a strong recovery of the labor market, suggesting that the reforms precipitated the turnaround. Quantitative studies by Nickell and van Ours (2000) and others point to wage moderation as the chief cause of the recovery. Once again, the effectiveness of the wage moderation initiative stemmed in part from the support it enjoyed from all parties—the unions, the employers, and the government. Moreover, the inclusion of tax cuts in the wage pact tempered the effects of the wage restraints and encouraged acceptance of the reforms.
Nevertheless, while other European countries could improve their labor market performance by following the Dutch and Irish lead, they will probably not achieve the same radical reduction in their unemployment rates. Many of the reforms in Ireland and the Netherlands simply enabled these countries to catch up to the rest of the European Union. Other European countries had already seen a marked increase in the labor force participation of women, and they had long maintained much lower rates of nonemployment than Ireland and the Netherlands. 20 Thus, European countries that enact labor market reforms modeled on those in Ireland and the Netherlands are likely to reap more modest rewards.
The contribution of unemployment insurance reform to the improvement in the Dutch labor market is more difficult to assess. The benefits of this reform are not easily measured. However, a similar reform of the Dutch disability system, undertaken between 1985 and 1987, has had only limited success. Although the government lowered the replacement rate for benefits and required recipients to meet a more stringent definition of disability, the share of the working-age population receiving disability benefits has remained steady at about 8 percent since the early 1980s.
Notes 1. See, for example, Blanchard (2000), Blanchard and Wolfers (1999), IMF (1999), and Nickell (1997). 2. See Blanchard (2000) and Blanchard and Portugal (2001). 3. Research has shown that labor market regulations do not necessarily increase unemployment in the absence of shocks, but substantially hinder the ability of the economy to adjust to shocks. See Balakrishnan and Michelacci (2001) and IMF (1999).
The value of removing barriers to part-time work would seem to be much less ambigious. This reform has helped bring about a substantial increase in the labor force participation of Dutch women since the early 1980s. Nevertheless, larger cultural changes must also be credited with encouraging women to work. These cultural changes had taken effect in other European countries much earlier, and the Netherlands was in a sense simply “catching up” with the rest of Europe. Still, it appears that the Netherlands’ progress in this area was facilitated by the reforms.
4. The nonemployment rate = (the unemployed + those not in the labor force) / (the employed + the unemployed + those not in the labor force). This measure is particularly useful because it corrects for differences in the criteria used by various countries to identify those people actively looking for work. 5. The participation rate measures the labor force (the employed + the unemployed) as a percentage of the working age population (the employed + the unemployed + those not in the labor force). 6. Our discussion of Ireland’s labor market reforms draws heavily on OECD sources (OECD 1989, 1991, 1993, 1995, 1997a, 1999). 7. The pacts were the Programme for Economic and Social Progress (increases of 3.75 percent for 1991-93), the Programme for Competitiveness and Work (increases of 2 percent in 1994, 2.5 percent in 1995, and 3.5 percent in 1996), the Partnership 2000 (increases of 7.25 percent for 1997-99), and the Programme for Prosperity and Fairness (increases of 15.5 percent for 2000-2003).
Conclusion During the past two decades, Ireland and the Netherlands have achieved dramatic labor market improvements after undertaking wide-ranging reforms. Academic research has shown that the reforms—in particular, wage moderation—can explain almost all of the Netherlands’ turnaround since the mid-1980s, and at least the first phase of Ireland’s recovery.19
8. In 1998, the lowest and highest marginal rates were reduced to 24 and 46 percent, respectively, putting Ireland’s tax wedge even further below the OECD average. 9. The replacement rate cited is for a married worker who has two children and earns the average industrial wage.
The effectiveness of the reforms prompts us to ask whether other European countries might benefit from following the example of Ireland and the Netherlands.
10. See OECD (1993, p. 61; 1997a, p. 81).
5
FRBNY
CURRENT ISSUES IN ECONOMICS AND FINANCE
11. The requirement, applied first to 18- and 19-year-olds in 1996, generated immediate results: “twenty-eight percent were struck off the rolls either because of a voluntary departure or because they had accepted a job or training place” (OECD 1999, p. 127). In 1998, the requirement was extended to recipients in certain other age groups, further reducing the unemployment rolls. 12. Spending on these programs has fallen recently; they accounted for 1.5 percent of GDP in 1998. 13. The European Social Fund Evaluation Unit judged the Community Employment program to be particularly weak “in terms of progression to employment and training certification” (OECD 1999, p. 129). 14. This is a particularly important point given the political sensitivity of changes to the welfare state. See IMF (1999, p. 34) and Watson et al. (1999, p. 41). Indeed, partial reforms may have unintended adverse effects if they merely shift distortions to other margins of the labor market. See Blanchard and Landier (2000). 15. See Barry (1999), IMF (2000), and OECD (1999). 16. FDI inflows have increased dramatically, rising from an average of less than $0.14 billion per year in the 1980s to an average of more than $1.1 billion per year in the 1990s (OECD 1999, p. 53; authors’ calculations). Foreign-owned manufacturing firms now account for about 30 percent of GDP (OECD 1999, p. 62). 17. Our discussion of the Dutch reforms is based on Blanchard (2000), Nickell and van Ours (2000), and Watson et al. (1999).
References Balakrishnan, Ravi, and Claudio Michelacci. 2001. “Unemployment Dynamics across OECD Countries.” European Economic Review 45, no. 1 (January): 135-65. Barry, Frank, ed. 1999. Understanding Ireland’s Economic Growth. London: Macmillan. Blanchard, Olivier. 2000. “The Economics of Unemployment: Shocks, Institutions, and Interactions.” London School of Economics, Lionel Robins Lectures. Blanchard, Olivier, and Augustin Landier. 2000. “The Perverse Effects of Partial Labor Market Reform: Fixed Duration Contracts in France.” Unpublished paper, Massachusetts Institute of Technology. Blanchard, Olivier, and Pedro Portugal. 2001. “What Hides Behind an Unemployment Rate: Comparing Portuguese and U.S. Labor Markets.” American Economic Review 91, no. 1: 187-207. Blanchard, Olivier, and Justin Wolfers. 1999. “The Role of Shocks and Institutions in the Rise of European Unemployment: The Aggregate Evidence.” Unpublished paper, Massachusetts Institute of Technology. International Monetary Fund (IMF). 1999. “Chronic Unemployment in the Euro Area: Causes and Cures.” World Economic Outlook, June. ———. 2000. Ireland: Staff Report for the 2000 Article IV Consultation, August.
18. In the European Union as a whole, the percentage of women holding part-time jobs rose only 7 percentage points—from 26 to 33 percent—over the same period. Note that the increase in parttime employment among Dutch women reflected their choice and was not the outcome of a shortage of full-time positions (OECD 1997b, p. 33).
Nickell, Stephen. 1997. “Unemployment and Labor Market Rigidities: Europe versus North America.” Journal of Economic Perspectives 11, no. 3 (summer): 55-74.
19. Wage moderation is the most visible effect of a structural change in the bargaining process between unions and employers. When unions broaden their focus to include the unemployed, they put relatively less emphasis on securing wage increases for the employed workers they represent and more emphasis on promoting the hiring of the unemployed. This shift in focus was a key component of the agreements reached in Ireland and the Netherlands.
Organisation for Economic Co-operation and Development (OECD). 1989, 1991, 1993, 1995, 1997a, 1999. Economic Survey: Ireland, May
20. See Chart 2.
Nickell, Steve, and Jan van Ours. 2000. “The Netherlands and the United Kingdom: A European Unemployment Miracle?” Economic Policy: A European Forum, no. 30 (April): 135-75.
———. 1997b. Employment Outlook, June. Watson, C. Maxwell, Bas B. Bakker, Jan Kees Martijn, and Ioannis Halikias. 1999. “The Netherlands: Transforming a Market Economy.” IMF Occasional Paper no. 181.
About the Authors Cédric Tille is an economist and Kei-Mu Yi a senior economist in the International Research Function of the Research and Market Analysis Group.
The views expressed in this article are those of the authors and do not necessarily reflect the position of the Federal Reserve Bank of New York or the Federal Reserve System.
Current Issues in Economics and Finance is published by the Research and Market Analysis Group of the Federal Reserve Bank of New York. Dorothy Meadow Sobol is the editor.