Current Account Fact and Fiction∗ David Backus† Espen Henriksen,‡ Frederic Lambert,§ and Chris Telmer¶
First draft: June 1, 2005 This revision: December 14, 2005
Abstract With US trade and current account deficits approaching 6% of GDP, some have argued that the country is “on the comfortable path to ruin” and that the required “adjustment” may be painful. We suggest instead that things are fine: although national saving is low, the ratios of household and consolidated net worth to GDP remain high. In our view, the most striking features of the world at present are the low rates of investment and growth in some of the richest countries, whose surpluses account for about half of the US deficit. The result is that financial capital is flowing out of countries with low investment and growth and into the US and other fast-growing countries. Oil exporters account for much of the rest. JEL Classification Codes: F21, F32, E21. Keywords: net exports; trade balance; saving; consumption; real exchange rate; oil. ∗
We welcome comments, including advice on data and measurement issues and references to papers we inadvertently overlooked. We thank Richard Clarida, Gian Luca Clementi, Nouriel Roubini, and Gian Luca Violante for useful comments, as well as participants at the SED (June 2005) and NBER Summer Institute (July 2005). The latest version of the paper will be available at: http://pages.stern.nyu.edu/∼dbackus/CA/BHLT latest.pdf . If you print this document, we suggest you turn off “Auto-Rotate and Center.” † Stern School of Business, New York University, and NBER;
[email protected]. ‡ Department of Economics, University of Oslo;
[email protected]. § Stern School of Business, New York University;
[email protected]. ¶ Tepper School of Business, Carnegie Mellon University;
[email protected].
1
Introduction
In many respects, economic life in the United States has never been better. Per capita GDP reached an all-time high of $39,921 in 2004. Real GDP grew by 3.6% over the last year, modest by US standards but faster than Canada (3.0%), France (2.4%), Germany (1.5%), Italy (0.8%), Japan (0.8%), and most other developed countries. Employment hit a record 141 million in April 2005, with the unemployment rate steady at 5.2%, well below its 2003 peak of 6.3%. Despite these signs of prosperity, many professional observers see signs of trouble on the horizon. Most of them trace their discomfort to the widely-reported trade and current account deficits (“external deficits”), which they attribute to a low saving rate and a government budget deficit. Representative samples of opinion include: • Lawrence Summers (2004a): “The most serious problem we have faced in the last fifty years is that of low national saving, resulting dependence on foreign capital, and fiscal sustainability. ... The current account deficit has widened sharply over the last four years ... to an unprecedented rate of 5% of net national product. More than 100% of the deterioration of the current account deficit is accounted for by a drop in national saving. ... The clear change in national saving ... comes from the increase in the federal budget deficit, which accounts for the fact that the US now has the lowest rate of national saving in its history.” • Stephen Roach (2004): “June’s enormous US trade deficit should be a wake-up call to America and the rest of the world. ... As long as the US continues to live well beyond its means and as long as the rest of the world fails to live up to its means, this seemingly chronic condition will only get worse. The imperatives of global rebalancing are reaching a flashpoint. ... The basic problem [is] a saving-short US economy that is locked into the destructive spiral of ever-widening twin deficits.” • Nouriel Roubini and Brad Setser (2004, pp 9, 22): “[We examine] ... US external deficits and the ... international monetary system that is integral to their financing – a system whose stability hinges on the willingness of Asian central banks to hold enormous amounts of US Treasuries. ... Our analysis suggests that the ... system is fragile, and likely will prove unstable. Even if the United States continues to be able to borrow on terms that other, comparable, debtors could not imagine, our analysis suggests that the US is on an unsustainable and dangerous path. ... The deficits since 2000 reflect the need for a low savings country to ... finance large budget deficits.” • Maurice Obstfeld and Kenneth Rogoff (2005, pp 67-69, 73): “The speed at which the US current account ultimately returns to balance, the triggers that drive that
adjustment, and the way in which the burden of adjustment is allocated across Europe and Asia all have enormous implications for global exchange rates. Each scenario for returning to balance poses, in turn, its own risks to financial markets and to general economic stability. ... In our view, any sober policymaker or financial market analyst ought to regard the US current account deficit as a sword of Damocles hanging over the global economy. ... [In] our baseline simulation, in which [all] current account balances go to zero, the dollar needs to depreciate in real effective terms by 33%.” • Olivier Blanchard (2004, p 20): “The dollar needs to depreciate.” • Joseph Stiglitz (2004): “America’s huge fiscal and trade deficits ... jeopardise future American generations’ well-being. As ... Herb Stein put it: ‘If something can’t go on forever, it won’t.’ But no one knows how, or when, it will all end. ... An even weaker dollar is a strong possibility.” • Warren Buffett (2005, p 20): “As time passes, and as claims against us grow, we own less and less of what we produce. ... Should we continue to run current account deficits comparable to those now prevailing, the net ownership of the US by other countries and their citizens a decade from now will amount to roughly $11 trillion. ... [I]f foreign investors were to earn only 5% on that net holding, we would ... be delivering 3% of annual output to the rest of the world simply as tribute for the overindulgences of the past. In this case, ... the sons would truly pay for the sins of their fathers.” Financial Times columnist Martin Wolf (2004) gives us the bottom line: “Let’s be blunt about it. The US is now on the comfortable path to ruin.” Are we on the path to ruin? It’s never easy to predict the future. We recall that in the late 1980s, Americans and Europeans alike were preoccupied with the success of the Japanese economy. We moved on to other things when Japan entered a 15-year depression. We think the current tendency toward panic is a similar overreaction, and see the situation in much different terms than the people quoted above. Our goal, however, is not to convince you that everything is fine, but to put the US current account deficit into perspective. We do this by considering a broad range of evidence — broad in time, in country coverage, and in range of variables — in the hope of getting a clearer picture of the current situation, and perhaps some insight into its continuing evolution. We think this evidence goes some way toward separating fact from fiction as we think about the likely causes and consequences of the US current account deficit. We proceed as follows. In the next section, we take a quick look at external balances in the US and other countries, including the US deficit and corresponding surpluses elsewhere. In Section 3, we start to put this into a broader historical context by documenting some of 2
the properties of external balances in developed countries. In some cases, we describe data going back more than a hundred years; in others, we focus on the period since 1960. We use the data to comment on several common propositions about external balances: that the US deficit is unprecedented, follows from the fiscal deficit, will lead to a real depreciation of the dollar, and reflects excessive spending by American households. We argue that most of these propositions are fiction. In Section 4 we suggest an alternative: that US consumers are spending because their wealth is high, and that capital is leaving other countries because of poor performance. We discuss related issues in Section 5 and summarize our analysis in Section 6.
2
The situation
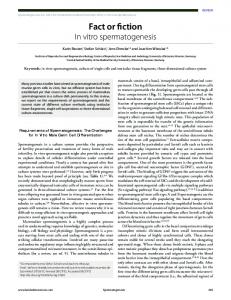
The US is now running an external deficit of more than 5% of GDP. You can get a hint of its origins from Figure 1, where we plot (gross national) saving, (gross private) investment, and net exports over the last fifty years. Each is expressed as a ratio to GDP, with both numerator and denominator valued at current prices. We define saving S as GDP minus personal consumption and government purchases, so that S = I + NX ,
(1)
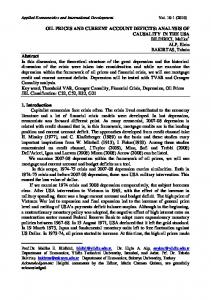
where I is gross private investment and NX is net exports (the “trade balance”). This definition is somewhat unusual, but there are so many definitions floating around that it hardly seems unreasonable to add one more. The flow identity (1) retains the traditional role of the external balance (net exports in this case) in reconciling saving and investment. If the definition of saving is novel, the message is not. The ratio of net exports to GDP has moved from modest to substantial deficit over the last 25 years. There was a local minimum in the trade balance of about –3% in the mid-1980s, then a return to balance in the early 1990s. By the mid-1990s, net exports was again declining, hitting –3% in 2000 on the way to –5.9% in the first quarter of 2005. The growing deficit necessarily reflects differences in the movements of saving and investment. Both exhibit short-run fluctuations over the business cycle (they’re procyclical), but their long-run movements are quite different. While investment has been a relatively stable fraction of GDP over the last fifty years, the saving rate has declined gradually since about 1980. The trend in net exports mirrors the decline in the saving rate. In Figure 2, we see that the long-run decline in saving reflects a similar increase in consumption, which rose steadily from 63% of GDP in 1980 to 70% today. The issue, then, is that American households are consuming a substantially larger fraction of GDP than in decades past, and that this increase is reflected in a trade deficit of similar magnitude. 3
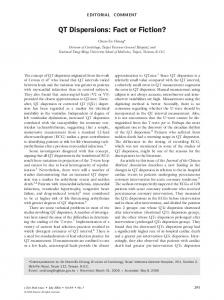
The cumulative effect of 25 years of external deficits is that the US net international investment position has moved from positive to negative: foreign claims on the US economy now exceed US claims on the rest of the world (Figure 3). The net international investment position is now about 20% of GDP. The US deficit is matched, of course, by surpluses elsewhere, but the numbers vary substantially across countries; see Table 1. The largest surpluses are Japan ($172b, 3.7% of GDP), Germany ($104b, 3.8%), China ($69b, 4.2%), Russia ($60b, 10.3%), Saudi Arabia ($52b, 20.5%), Switzerland ($43b, 12.0%), and Norway ($$34b, 13.5%). The deficit countries include Spain ($55b, 5.3%), the UK ($42b, 2.0%), and Australia ($40b, 6.4%). Panel (c) shows us that advanced economies, in aggregate, accounted for a little more than half the US deficit. Emerging economies accounted for about a third, split evenly between the Middle East and Asia. What’s left (the “world deficit” of $86b) remains a mystery; our measures of current account balances do not balance worldwide, as they should. The major oil producing countries (the Middle East, Russia, and Norway) collectively account for about a third of the US deficit. In short, the US is running a large external deficit that reflects, in large part, a 25-year increase in the ratio of personal consumption to GDP. Other countries, on the whole, are running surpluses, with about half from advanced economies and a third from emerging economies. The US deficit is by far the largest “imbalance” in absolute terms, but not as a percentage of GDP.
3
The consensus reconsidered
The opinions we quoted at the start describe what Roubini (2005) calls the consensus view, which goes something like this: The US is running an external deficit of unprecedented size. This deficit is the consequence of a low national saving rate, which itself is the consequence (at least in part) of a large government deficit. Since the current account is financed by equal and opposite capital inflows, the US external deficit is financed by foreign borrowing. This can’t last forever — eventually the interest on our foreign liabilities would exceed our income — so we should expect to see the deficit shrink. Since the external deficit depends on the relative price of local and foreign goods and services, the reversal will require a decline in the real value of the dollar. Even so, our accumulated foreign debt will depress the living standards of future generations. How persuasive is this line of argument? We break it down into its component “propositions” and discuss each in turn. In each case, we summarize the logic, use data to shed light on it, and deliver a verdict: fact or fiction? 4
We rely, in most cases, on data for other developed countries (“advanced economies” in the nomenclature of the IMF). We focus, in particular, on the OECD, excluding such new members as Korea, Mexico, Turkey, and central European members of the European Union. That leaves us with 15 countries: Australia, Belgium, Canada, Finland, France, Germany, Italy, Japan, the Netherlands, Norway, Spain, Sweden, Switzerland, the UK, and the US. For this set of countries, we construct three datasets. Quarterly series are taken from the OECD’s Quarterly National Accounts and Main Economic Indicators. We constructed a longer annual dataset for these countries and a few others from the IMF’s International Financial Statistics. Finally, annual series prior to 1950 are taken from studies by economic historians; most of the sources will be familiar from Backus and Kehoe (1992), Jones and Obstfeld (1996), and Taylor (2002). The sample in this case includes Australia, Canada, France, Japan, Norway, Sweden, the UK, and the US (8 countries altogether). Details on all of these sources are reported Appendix A.
The US external deficit is unprecedented. Few articles on the US external deficit are able to resist calling it “unprecedented.” Certainly it’s unlike anything we’ve seen in the US over the last fifty years — that’s clear from Figure 1. Figure 4 suggests that the term is less accurate for other eras and countries. In the top panel of the figure, we see that the US had at most modest deficits between 1900 and 1980. In the first half of the nineteenth century, however, deficits were more common, with a deficit over 5% in 1815 and smaller but more persistent deficits in the 1830s and 1870s. Large surpluses have also occurred, with surpluses greater than 5% of GDP during World War I and immediately following World War II. In both cases, surpluses were short-lived. In other countries, large imbalances have been more common. In the second panel of Figure 4 we plot long series of the ratio of net exports to GDP for seven other countries for which reasonably good data are available: Australia, Canada, France, Japan, Norway, Sweden, and the United Kingdom. In these countries, both deficits and surpluses occurred in about 5% of available observations prior to 1960, giving us imbalances greater than 5% roughly 10% of the time. Jones and Obstfeld (2000, Figure 3) and Taylor (2002, esp Figure 1) make a similar point about the period from 1850 to World War I: that relatively free mobility of capital prior to World War I was associated with larger current account imbalances than we saw between 1950 and 1970. In several cases, large trade imbalances lasted a decade or more. In our historical dataset, Canada’s deficit averaged 3.5% from 1870-1913; Japan’s deficit averaged 3.5% from 1896-1905; Norway’s deficit averaged close to 4% from 1890-1912; Norway’s surplus averaged over 10% from 1995-2004; Switzerland’s surplus averaged close to 6% from 1992-2004; and the UK’s surplus averaged over 3% from 1892-1904. Such periods aren’t typical, but they happen. 5
In Figure 5, we report external balances for a larger set of countries over the period 1960present. [more coming!] The most striking feature of the figure is the substantial increase in both deficits and surpluses over the last 15 to 25 years. If the US deficit is unusually large, so are the surpluses currently run by Germany, Japan, and (especially) Norway and Switzerland. Clearly the dispersion in external balances has increased sharply in the recent past. Blanchard and Giavazzi (2002) make the same point about the EU, stressing the huge deficits run by Portugal and Greece, which we do not include in our sample. Whether this represents a return to the imbalances of a century ago or something new remains to be seen. Verdict: it depends. If we regard evidence on other advanced countries as relevant to the US situation, the proposition is fiction: there are numerous examples of large deficits and surpluses in the distant and recent past. Alternatively, we might regard the US as unique in its size and role in the world economy. As Obstfeld and Rogoff (2005, p 71) put it: “[A]ny comparison based on the experience of small countries, even small industrial countries, is of limited value.” Perhaps the best comparison is the UK before World War I. Here there is a stark contrast: the UK was a major source of capital for the developing world while the US, at present, is a major destination for financial flows from both rich and poor countries.
The US external deficit is the result of the government deficit. The so-called “twin deficit” proposition is mentioned in the Roach, Roubini-Setser, and Summers quotations above, as well as many other places. DeLong (2004) gives us a particularly vivid version: “[Treasury undersecretary] John Taylor ... is not allowed to say the obvious thing: that savings as a share of GDP has declined as a result of the big Bush budget deficits.” This line of thought was equally popular in the mid-1980s, when the US was also running both external and fiscal deficits. The logic of the proposition is that a decline in government saving leads to a decline in total saving, which is then reflected in net exports as in equation (1). The key issue, of course, is the impact on consumption. What’s the evidence? Since 2000, the government surplus and net exports (expressed as ratios to GDP) have both declined sharply; see Figure 6. DeLong cites similar evidence. However, there is little connection between these two variables in general. If we look at the period between 1990 and 2000, for example, we might as easily conclude that they move in opposite directions. The second panel of the figure is a scatter-plot of the variables. The correlation between the two is 0.15 for annual data between 1960 and 2004. Other countries show similar patterns, with correlations of −0.08 (Australia), −0.05 (Canada), −0.06 (Switzerland), and 0.12 (Sweden). [more coming] The lone strong positive correlation is Norway (0.57), with twin deficits in the 1970s and twin surpluses recently. [This is a direct reflection of oil, more later.] At present, Germany and Japan are running substantial 6
external surpluses with government deficits similar in magnitude to the US. In general, the correlations between external and government deficits in developed countries are slight. Others come to the same conclusion by different routes. Chinn and Prasad (2003, Table 3) regress current account balances on fiscal deficits and other variables. They find that for rich countries, a 1% fiscal deficit is associated with a 0.13% current account deficit. Similarly, quantitative theoretical exercises by Erceg, Guerrieri, and Gust (2005) and Ferrero (2005) suggest that in popular non-Ricardian models, a 1% increase in the fiscal deficit leads to about a 0.20% increase in the trade deficit. Neither line of work suggests that the US fiscal deficit can account for more than a small fraction of the US current account deficit. Verdict: the proposition is fiction. Neither evidence nor theory suggests that the US fiscal deficit plays a central role in its current account deficit. Figure 2 tells us why: the steady increase in consumption over the last 25 years has been associated with fiscal deficits and surpluses alike. The puzzle is not why consumption is high now, but why it has continued to increase over the last 25 years whatever the fiscal situation.
Interest on foreign debt is becoming a significant burden. The downside of foreign debt is the expense of servicing it. We quoted Buffett earlier as suggesting that current trends could lead us to pay 3% of GDP to foreign owners in ten years. Roubini and Setser (2004) do a more systematic analysis, with a range of possible scenarios, but come to a similar conclusion. In the scenario that mirrors Buffett’s, they hold constant the ratio of net exports to GDP and apply a (nominal) interest rate on net foreign debt of about 4.5%. Here net foreign debt rises from its current value of about 25% of GDP to almost 90% by 2015. The current account deficit at that point is close to 9% of GDP, which includes net interest payments to the rest of the world of 3% of GDP. In some other scenarios, the interest burden rises further. The logic is sound, but US data suggest that the interest burden may be significantly more modest. For one thing, the yield on foreign claims in the US is now about 3% and has not been as high as 5% since 1990. See Figure 7. For another, the yield on US-owned foreign assets has been consistently higher than the yield on foreign claims on the US. With gross positions increasing over time, net international interest income has hardly changed as the net international investment position has moved from 13% of GDP in 1980 to −22% of GDP in 2004. The result is evident in Figure 8: over this period, net interest income has never been larger than 1% of GDP. In the most recent year, the number was +0.3%. (Yes, that’s a plus sign.) Given the evidence, it’s not hard to believe that net investment income has much less impact on consumption decisions than (say) expectations of future labor income. 7
These features of the data are equally well-known and puzzling. Is the difference in yields the result of Asian purchases of low-yield US Treasury securities? No. We see the same thing if we focus our attention on direct investment. Does it reflect mismeasurement? Possibly, but attempts to track down the measurement error have been unsuccessful; see, for example, Matalino (2000). Could the interest burden get worse? Of course it could, but the scenarios described by Buffett and Roubini-Setser both start with the premise that the external deficit will continue for a decade. The evidence suggests instead that deficits of this magnitude are unlikely to last more than a few years. External imbalances are persistent, but they have a half-life of about 3 years. You can get a sense of this from the behavior of the ratio of net exports to output for a panel of 15 developed countries. The autocorrelations are 0.76 over 4 quarters, 0.58 over 8 quarters, and 0.41 over 12 quarters. See Figure 9. Moreover, the quadrants of the figure do not indicate much difference in this respect between deficit and surplus countries. Verdict: the proposition is fiction. Although external debt can, in principle, lead to a significant interest burden, it has yet to do so in the US. This could change, of course, but so could other things. Given the evidence, interest on foreign debt strikes us as a far less important factor for US households than the growth rate of the US economy.
The deficit will lead the dollar to depreciate. The consensus view continues with the proposition that if the US external deficit is to shrink, the mechanism must involve a fall in the real value of the dollar, possibly a sharp one. DeLong (2004) puts it this way: “Two major factors affect demand for imports: (a) the exchange rate, and (b) the level of demand in the US. Two major factors affect demand for exports: (a) the exchange rate, and (b) the level of demand outside the US. Barring a severe recession in the United States or an exhorbitant spending boom outside the US, it is the exchange rate that *must* move if the US current account is to be significantly reduced.” Modern dynamic theory makes no such claim for a strong connection between the external balance and the real exchange rate, but this kind of analysis continues to dominate popular discussions. Obstfeld and Rogoff (2005, pp 70-71) summarize the argument: “Any correction to the trade balance is likely to entail a very large change in the dollar exchange rate: our baseline figure, with moderate adjustment speed, is over 30 percent.” Is this fact or fiction? We’re not alone in viewing exchange rates as the supreme challenge of international macroeconomics. Decades of work has left us with the opinion that shortand medium-term fluctuations are inexplicable, both before and after the fact. Frankel and Rose (1995) is the classic reference, but more than a decade of work underlies their conclusion. Their punchline is echoed nicely by Obstfeld and Rogoff (2000, p 381), who remark: “No model seems to be very good at explaining exchange rates even ex post.” 8
There is, to be sure, a statistical relation between short-run movements in the real exchange rate and the trade balance: fluctuations in real exchange rates (the ratio of foreign prices to domestic prices) are typically negatively correlated with future trade balances, positively correlated with past trade balances. This “J-curve” property has widely documented, but there are a couple difficulties in applying it to the current situation. One is that the relationship is unstable; see, for example, Backus, Kehoe, and Kydland (1994, Figure 2) and the references mentioned there. The other is that it pertains to short-term fluctuations, which leave out virtually all of the movement in the US current account over the last 25 years. The US current account deficit is an issue about the long run, not the short run. We consider the proposition directly: Do current account deficits (surpluses) tend to be followed by depreciations (appreciations)? The answer, in general, is no. We show in Figure 10 (for our usual collection of countries) that there has been no general connection between the ratio of net exports to GDP and subsequent movements in the real effective exchange rate (the IMF’s CPI-based measure) over periods of 4 to 16 quarters. In other words, knowing the trade balance has not been useful for forecasting subsequent movements in the real exchange rate. There is, however, an exception: the US (Figure 11), where the correlations increase with the time horizon. We hesitate to put much weight on this (correlations between highly persistent variables are based on a small effective number of observations), but it’s only fair to note that US data agree with the proposition. Verdict: we don’t know. It would be nice to say that we understand exchange rates, but it simply isn’t true. We’re reminded of a comment made by Leamer in reference to the many studies of the impact of NAFTA. We recall him saying: “Any serious scientific methodology has to allow the answer, ‘We don’t know.’” We think that’s true here, but only time will tell whether the US deficit is followed by depreciation, appreciation, or no change. Even then, we won’t know whether the change was luck or the result of a systematic relation between these two variables. The absence of such a relation in other countries makes us skeptical. The carefully qualified language of Rosenberg and Folkerts-Landau (2002, p 80) suggests the same conclusion: “The message ... is that certain economic disturbances may cause exchange rates and the current-account balance to move in the same direction while other disturbances may cause exchange rates and the current account to diverge.”
Americans are living beyond their means. The bottom line of the consensus view is that Americans are overspending: by running persistent external deficits, we are financing a consumption binge by borrowing abroad. When the debt comes due, our living standards will suffer. Buffett (2003) describes the 9
situation with a folksy story in which the citizens of Squanderville borrow from the citizens of Thriftville to finance a level of consumption above what they produce. In one scenario, future generations of Squanderville work harder and consume less to service the debt they inherit. They are, as the saying goes, paying for the sins of their fathers. In another scenario, the people of Squanderville decide not to service their debt, triggering a financial crisis. Neither scenario is appealing. Is that what we see? One way to address the question is to look at the balance sheet of US households. If more claims on the US economy are owned by people outside the country, has our net worth fallen? We use the Flow of Funds measure of household net worth, which includes claims on the government and business sectors, including assets held by pension funds. With this data, the answer is no; see Figure 12. The ratio of household net worth to GDP remains well above its post-war average, even after the sharp drop in the stock market in 2001-02. At the end of 2004, the ratio of net worth to consumption (4.2) was above its peak value in the period 1950-1990 (3.6). Note, too, that the net international investment position (−20% of GDP) is small relative to household net worth. One component of net worth that has not risen is government. The government’s net worth (capital stock at replacement cost minus government liabilities) has fallen over the last 25 years, reflecting both a drop in the capital stock and an increase in debt (with both measured as ratios to GDP). If we add this to household net worth to get an economy-wide net worth number, the results are only slightly less sanguine: consolidated household and government net worth is also above its post-war average. Household net worth itself reflects a number of components. Figure 13 shows that the most volatile component, and the one that accounts for most of the increase since 1980, is corporate equity. The line in the figure includes only direct holdings; if we included indirect holdings through insurance companies and pension funds, it would be larger. Housing, on the other hand, has increased gradually over the same period. As others have noted, there has been an increase in market value, but much of the increase reflects a rise in housing valued at replacement cost. Piazzesi and Schneider (2005, Figure 1) perform a similar analysis. Verdict: the proposition is fiction. Although non-residents now own a larger share of claims to the US economy, the value of the remaining claims is high by historical standards. If “living beyond our means” suggests spending income and assets we don’t have, we’re not doing it. Buffett’s analogy evidently requires some modification. We suggest something like this: the residents of Squanderville have a terrific new project. To finance it, they sell 10% to 10
residents of Thriftville, whose own projects do not look as promising. When the project proves to be wildly profitable, the people of Squanderville are happy to share the returns with the people of Thriftville, who in turn are happy with the benefits of access to foreign projects. The mayor of Squanderville writes to Buffett requesting that their town’s name be changed to Entrepreneurville.
4
What’s really going on?
If the consensus view is largely fiction, what’s really going on in the world today? The facts are clear: the US is running a large external deficit, US consumption and net worth are high by historical standards, and many other countries are running large surpluses. We explore these issues with a series of questions.
Why is US consumption so high? With US consumption and net worth both high, it’s not hard to imagine a connection between them. Most models of consumption and saving lead to decision rules in which consumption depends on net worth, expected labor income, and asset returns. The form of the rule depends, typically, on the preferences of the agent and the stochastic properties of labor income and asset returns, but consumption is invariably increasing in net worth. Figure 14 is a scatter plot of consumption and household net worth for the US. We see that in periods when net worth has been high relative to GDP, consumption has also been high. The relation is not a decision rule (we’re missing some of the components), but it suggests an answer to our question: US consumption is high now because net worth is high. Given the inverse relation between consumption and saving, it also suggests a rationale for low saving rates. Quantitatively, this may not be enough. In most models of consumption and saving, human capital (the capitalized value of labor income) is larger than financial wealth. But if the values of financial and human capital are closely related (both might reflect the performance of the economy as a whole), then we would expect to see a relation between consumption and financial wealth similar to Figure 14.
Why are so many rich countries running external surpluses? If high net worth helps us to understand the US, what do we make of other countries? We saw in Table 1 that about half of the US deficit is matched by surpluses in Japan, Germany, Switzerland, and Norway. If we ask why the US has a deficit, we might also ask why these countries have surpluses. 11
Consider these countries in turn. Switzerland is a particularly striking case, so we’ll take it first. You can see in Figure 15 that investment dropped sharply in the early 1990s and has yet to recover. With an average annual growth rate of real GDP between 1990 and 2003 of less than 1%, Kehoe and Ruhl (2005) label this a “great depression,” so we might regard the fall in investment to be a natural feature of an economic downturn. However, while investment fell, saving remained steady, and a large trade surplus was a direct consequence. This surplus implies the active accumulation of foreign assets including, no doubt, claims on the US. Germany is less extreme but follows a similar pattern; see Figure 16. Investment fell sharply in 2001 as output growth dipped below 1%. With saving flat, a substantial trade surplus emerged. The largest surplus is Japan; see Figure 17. There we see that a persistent trade surplus emerged in the early 1980s. Over that time, and particularly since 1990, investment has fallen steadily. However, saving fell, too, so there has been little additional impact on the surplus. Like the other two countries, a trade surplus has been associated with poor economic performance. Conversely, the second and third largest deficits after the US come from the UK and Spain, two countries whose growth rate have exceeded the EU average over the last 10-15 years. This tendency for countercyclical external balances has been widely documented for short-term fluctuations; see, for example, Aguiar and Gopinath (2004, Table 1), Backus, Kehoe, and Kydland (1994, Table 1), and Neumeyer and Perri (2005, Table 1). What’s different here is the magnitude: the external imbalances we see today are much larger than those documented in business cycle research. The bottom line, however, is the same: capital tends to flow into countries that are growing quickly, and out of those that are not. Norway is apparently an exception; see Figure 18. Investment has fallen, yet output is growing and the trade surplus is greater than 10% of GDP. The difference is almost certainly oil: (non-permanent) price increases raise income and saving, but do not generally lead to increases in investment. From a business cycle perspective the result is perverse, with investment falling during a boom, but it’s a natural feature of business cycle models if you distinguish between productivity and oil shocks; see Backus and Crucini (2000). More to the point, we see much the same thing Russia and Saudi Arabia, the two largest oilexporting countries. Saving rises and investment either falls or stays flat, leading to large external surpluses. The answer to the question, then, is that Japan, Germany, and Switzerland have been running surpluses precisely because their economies have suffered through a period of unusually poor performance. Oil exporters are the reverse: their surpluses reflect high oil prices, not poor economic performance. Together these two groups of countries account for about two-thirds of the US deficit.
12
5
Open questions
We think this is a coherent story for global imbalances, but it leaves some questions. Among them:
Why is US net worth so high if saving is so low? The rate of saving rate depicted in Figure 1 overstates net US saving; when we subtract depreciation, saving is essentially zero. How, then can net worth can be so high? The answer is that most of the change in net worth consists of valuation changes (capital gains), which do not appear in NIPA measures of saving. Gale and Sabelhaus (1999) show that this has been a feature of US net worth for decades: most of the change in net worth comes from valuation changes, not saving. You can ask a similar question about the capital stock: if net investment has been flat, how can household net worth be so high? Where does the value of these claims come from? The primary source must be the stock of physical capital, but the net capital stock at current cost has fallen slightly over the last 25 years. This decline reflects two competing forces. First, the price of investment goods, particularly equipment, has fallen, so that a given fraction of nominal GDP now buys more capital. See, for example, Greenwood, Hercowitz, and Krusell (1997). Second, investment has shifted toward capital goods with shorter lives, so the aggregate depreciation rate (nominal depreciation divided by the net capital stock at current cost) has gone up, driving the net stock of capital down. The net effect is that the capital-output ratio has fallen a little. But if the capital-output ratio has fallen, why has net worth gone up? The answer is again valuation effects. Housing, we know, has benefitted from positive valuation effects (see Figure 13), but apparently the same is true of business capital. The source of the latter remains a subject of active debate, but see Hall (2001) and McGrattan and Prescott (2005).
Isn’t this all about Asian central banks? A recurring theme in discussions of the US deficit is that a large fraction of it is being financed by Asian central banks. Some observers ask what will happen if they stop; see Roubini and Setser (2005). Others argue that this reflects the central role of the US and the dollar in global financial markets; see Dooley, Folkerts-Landau, Garber (2003) and Ferguson (2005). The numbers are these: At the end of 2004, the rest of the world held financial claims on the US valued at $12.5 trillion, while the US held claims on the rest of the world valued at $10.0t. The former included $1.9t in US treasuries and $0.8t in US agency issues, 13
of which about two-thirds was held by foreign central banks. These numbers are large in an absolute sense, but they are a small fraction of total foreign claims on the US economy.
Does foreign debt make us vulnerable? Some of the concern about the US international investment position comes from experience with emerging economies where international indebtedness similar to current US levels has sometimes been followed by economic collapse. Could the same happen to the US? We’d bet against it. One reason is that the US has much stronger institutions, which give foreign and domestic investors greater assurance of repayment than they would face in (say) Mexico or Russia. Another is that the form of indebtedness is different. While much foreign debt in emerging markets takes the form of (literally) debt, much of it issued or guaranteed by the government, in the US most foreign claims are private, and almost half consist of direct investment and corporate equity. This financial structure is less fragile, and in our view is less likely to lead to the kinds of solvency problems that have plagued debt markets in emerging economies.
What’s going on in China? China is now running a current account surplus of about $70b or 4% of its GDP; see Table 1. Figure 19 gives us some idea of its origins: both saving and investment are unusually high, with saving higher than investment in the recent past. Are the Chinese saving too much, as some have suggested? That’s hard to say, but we see two reasons why the Chinese might want to accumulate assets. One is a rapidly aging population, which suggests that high saving rates may be necessary to finance the old age of current workers. Another is concerns over the stability of the financial system. The central bank’s accumulation of reserves will put it in a stronger position to deal with a banking collapse, should one occur.
How important are demographics? To paraphrase Leamer again, we don’t know, but it’s possible we have given them too little attention. Figure 20 shows that the age distributions of some of the world’s largest economies are substantially different. It’s not hard to imagine this leading to substantial international capital flows. Work by Attanasio and Violante (2005), Brooks (2003), Domeij and Floden (2005), Feroli (2005), Ferrero (2005), and Henriksen (2005) all show that demographic differences can lead to large and persistent current account imbalances. Most suggest that demographics alone cannot account for more than 1 or 2% of the 6% US deficit, but that conclusion may change as our expertise evolves. 14
Have we entered a new world? Modern theory predicts much larger capital flows than we’ve seen over the last fifty years. Could the global imbalances we now see be a sign that the world is changing? Perhaps. Economists have been claiming for at least thirty years that we have no entered a world of capital mobility, and it’s probably more true now that we’ve seen in a century. It’s possible that the global imbalances we see now are a reflection of that development.
6
Final thoughts
The world is a much different place than it was just 10 years ago. International trade in goods, services, and assets continue to grow faster than GDP and are now at all-time highs. Current account balances show greater dispersion, particularly in the developed world, than we’ve seen in a century. In the US, the current account deficit is close to 6% of GDP and gross claims on the US economy are more than one year’s GDP. In Japan and Germany, on the other hand, current account surpluses are 3-4% of their GDPs. What are we to make of these developments? One popular line of thought is that these “imbalances” are a sign of trouble: they are the result of unwarranted spending by US households and government and require “adjustment” or “correction.” Even the language is troubling. How could a reasonable person be in favor of “imbalance” and against “correction”? Nevertheless, we think this interpretation is more fiction than fact. We propose a second interpretation that we believe is suggested by the evidence. First, spending by US consumers is higher because the value of their assets is high. This reflects, in large part, the relatively strong performance of the US economy. Second, capital outflows in several high-surplus countries reflect weak economic performance: low growth and low rates of investment. Roughly speaking, capital is moving from countries with low growth rates of real GDP to countries with high growth rates. Other versions of this story have been proposed by Bernanke (2005), Caballero, Fahri, and Gourinchas (2005), and Engel and Rogers (2005). Summers (2004a) puts it this way: There is a standard set of things that the finance ministers of countries with significant current account deficits say, suggesting that such deficits are somehow a sign of economic strength. Perhaps the sharpest formulation that I have heard is: ‘We live in a country that capital is trying to get into. Would you rather live in a country that capital is trying to get out of?’
15
Summers is being facetious, but we think the story fits the current facts quite well. Capital is not only trying to leave Germany and Japan, it’s succeeding. The surpluses of oil exporters and the aging populations of Japan, Europe, and China, complete the picture. In short, we see little to worry about. The world might very well change in troubling ways in the near future, but there’s little in current data to suggest it. Our guess is that the Japanese and German economies will rebound, which would tend to moderate their outflows of capital, and that the price of oil will fall, which would do the same for oil exporters. Until they do, we can expect to see large, persistent imbalances around the world – and that’s probably not a bad thing for either deficit or surplus countries.
A
Data sources
[To do.]
16
References Aguiar, Mark, and Gita Gopinath, 2004, “Emerging market business cycles: the cycle is the trend,” manuscript, 2004. Attanasio, Orazio P., and Giovanni L. Violante, 2005, “The demographic transition in closed and open economy: a tale of two regions,” unpublished manuscript, February. Backus, David K., and Mario J. Crucini, 2000, “Oil prices and the terms of trade,” Journal of International Economics 50, 185-213. Backus, David K., and Patrick J. Kehoe, 1992, “International evidence on the historical properties of business cycles,” American Economic Review 82, 864-888. Backus, David K., Patrick J. Kehoe, and Finn E. Kydland, 1994, “Dynamics of the trade balance and the terms of trade: the J curve?” American Economic Review 84, 84-103. Bernanke, Ben S,. 2005, “The worldwide saving glut and the US current account deficit,” remarks at the Sandridge and Homer Jones Lectures, March and April. Blanchard, Olivier, and Francesco Giavazzi, 2002, “Current account deficits in the euro area: the end of the Feldstein-Horioka puzzle?,” Brookings Papers on Economic Activity, 147-186. Blanchard, Olivier, 2004, “A macroeconomic survey of Europe,” unpublished manuscript, MIT, December. Brooks, Robin, 2003, “Population aging and global capital flows in a parallel universe,” IMF Staff Papers 50, 200-221. Buffett, Warren E., 2003, “America’s growing trade deficit is selling the nation out from under us,” Fortune, November 10. Buffett, Warren E., 2005, “Letter to shareholders of Berkshire Hathaway Inc.,” February 28. Caballero, Ricardo J., Emmanuel Fahri, and Pierre-Olivier Gourinchas, 2005, “An equilibrium model of ‘global imbalances’ and low interest rates,” unpublished manuscript, October. Chinn, Menzie D., and Eswar S. Prasad, 2003, “Medium-term determinants of current accounts in industrial and developing countries: an empirical exploration,” Journal of International Economics 59, 47-76. DeLong, Brad, 2004, “John Taylor blasts off for the gamma quadrant,” Brad DeLong’s Semi-Daily Journal, November 8. Domeij, David, and Martin Floden, 2005, “Population aging and international capital flows,” International Economic Review , forthcoming. Dooley, Michael P., David Folkerts-Landau, and Peter Garber, 2003, “An essay on the revived Bretton Woods system,” NBER Working Paper 9971, September. Engel, Charles, and John H. Rogers, 2005, “The US current account deficit and the ex17
pected share of world output,” unpublished manuscript; prepared for the November Carnegie-Rochester Conference on Public Policy. Erceg, Christopher J., Luca Guerrieri, and Christopher Gust, 2005, “Expansionary fiscal shocks and the trade deficit,” Board of Governors of the Federal Reserve System, January. Ferguson, Niall, 2005, “Our currency, your problem,” New York Times Magazine, March 13. Feroli, Michael, 2005, “Global aging and the current account,” unpublished manuscript, June. Ferrero, Andrea, 2005, “Demographic Trends, fiscal policy and trade deficits,” unpublished manuscript, New York University, November. Frankel, Jeffrey, and Andrew Rose, 1995, “An empirical characterization of nominal exchange rates,” in Handbook of International Economics (Volume III), G. Grossman and K. Rogoff, eds., Amsterdam: North-Holland. Gale, William G., and John Sabelhaus, 1999, “Perspectives on the household saving rate,” Brookings Papers on Economic Activity, 181-224. Gourinchas, Pierre-Olivier, and H´el`ene Rey, 2005, “International financial adjustment,” NBER Working Paper 11155, February. Greenwood, Jeremy, Zvi Hercowitz, and Per Krusell, 1997, “Long-run implications of investment-specific technological change,” American Economic Review 87, 342-362. Hall, Robert E., 2001, “The Stock Market and Capital Accumulation,” American Economic Review 91, 1185-1202. Henriksen, Espen, 2005, “A demographic explanation of US and Japanese current account behavior,” unpublished manuscript, September. Jones, Matthew T., and Maurice Obstfeld, 2000, “Saving, investment, and gold: a reassessment of historical current account data,” in Money, Capital Mobility, and Trade: Essays in Honor of Robert A. Mundell, Guillermo A. Calvo, Rudiger Dornbusch, and Maurice Obstfeld, eds., Cambridge: MIT Press. Kehoe, Timothy J., and Kim J. Ruhl, 2005, “Is Switzerland in a great depression?” Review of Economic Dynamics, forthcoming. Lane, Philip R., and Gian Maria Milesi-Ferretti, 2002, “External wealth, the trade balance, and the real exchange rate,” European Economic Review 46, 1049-1071. McGrattan, Ellen R., and Edward C. Prescott, 2005, “Expensed and sweat equity,” unpublished manuscript, September. Meese, Richard, and Kenneth Rogoff, 1983, “Empirical exchange rate models of the seventies: do they fit out of sample?,” Journal of International Economics 14, 3-24. Mataloni, Raymond J., 2000, “An examination of the low rates of return of foreign-owned US companies,” Survey of Current Business (March), 55-73. Neumeyer, Pablo A., and Fabrizio Perri, 2005, “Business cycles in emerging economies: the 18
role of interest rates,” Journal of Monetary Economics 52, 345-380. Obstfeld, Maurice, and Kenneth Rogoff, 2000, “Six major puzzles,” NBER Macroeconomics Annual, 339-390. Obstfeld, Maurice, and Kenneth Rogoff, 2005, “Global current account imbalances and exchange rate adjustments,” Brookings Papers on Economic Activity 1, 67-146. Parker, Jonathan A., 1999, “Spendthrift in America? on two decades of decline in the US saving rate,” NBER Macroeconomics Annual, 317-370. Piazzesi, Monika, and Martin Schneider, 2005, “Inflation and the price of real assets,” unpublished manuscript, November. Roach, Stephen, 2004, “Twin deficits at the flashpoint?,” Morgan Stanley, Global Economic Forum, August 16. Rosenberg, Michael R., and David Folkerts-Landau, 2002, The Deutsche Bank guide to exchange-rate determination, May. Roubini, Nouriel, 2005, “Global imbalances: a contemporary Rashomon tale with five interpretations,” Global Economics Blog, May 1. Roubini, Nouriel, and Brad Setser, 2004, “The US as a net debtor: The sustainability of the US external imbalances,” unpublished manuscript, November. Stiglitz, Joseph, 2004, “This can’t go on forever — so it won’t,” Guardian, January 1. Summers, Lawrence H., 2004a, “The United States and the global adjustment process,” Stavros S. Niarchos Lecture, Institute for International Economics, March. Summers, Lawrence H., 2004b, “The US current account deficit and the global economy,” Per Jacobsson Lecture, International Monetary Fund, October. Taylor, Alan M., 2002, “A century of current account dynamics,” Journal of International Money and Finance 21, 725-748. Wolf, Martin, 2004, “America is now on the comfortable path to ruin,” Financial Times, August 18.
19
Table 1 Global current account balances Current Account Balance, 2004 US Dollars (billions) % of GDP
Country or Aggregate
(a) Largest Deficits United States Spain United Kingdom Australia Turkey Italy Portugal Hungary France Greece
–668.1 –55.3 –42.1 –39.8 –15.5 –15.0 –12.7 –8.8 –8.4 –8.0
–5.7 –5.3 –2.0 –6.4 –5.1 –0.9 –7.5 –8.8 –0.4 –3.9
(b) Largest Surpluses Japan Germany China Russia Saudi Arabia Switzerland Norway Sweden Singapore Korea
172.1 103.8 68.7 59.9 51.6 43.0 33.8 28.5 27.9 27.6
3.7 3.8 4.2 10.3 20.5 12.0 13.5 8.2 26.1 4.1
(c) Country Aggregates United States Other advanced economies Emerging economies Middle East Developing Asia World (discrepancy)
–668.1 354.1 227.1 102.8 93.0 –86.3
–5.7 — — 12.4 2.9 —
Source: International Monetary Fund, World Economic Outlook Database, September 2005.
20
.2
Figure 1 US flows 1: saving, investment, and net exports
.15
Investment
Ratio to GDP .05 .1
Saving
−.05
0
Net Exports
1940
1960
1980
2000
Year
The figure is based on the expenditure identity: Y = C + I + G + NX , where Y is GDP, C is private consumption, I is private investment (including the change in inventories), G is government consumption and investment, and NX is net exports. The lines represent gross national saving (S = Y − C − G), gross private investment, and net exports, each measured at current prices and expressed as a ratio to GDP.
21
.8
Figure 2 US flows 2: consumption, government purchases, and net exports
Consumption .6
70%
Ratio to GDP .4
63%
.2
Government Purchases
0
Net Exports
1940
1960
1980
2000
Year
The lines represent the components of gross national saving (consumption and government purchases) and net exports, each measured at current prices and expressed as a ratio to GDP.
22
.2
Figure 3 US net international investment position
Ratio to GDP 0
.1
Current Cost
−.2
−.1
Market Value
1970
1980
1990 Year
2000
2010
The lines represent the US net international investment position (US claims on the rest of the world minus foreign claims on the US) expressed as a ratio to GDP. One line values direct investment at current cost, the other at market value.
23
Figure 4 Net exports over the last two centuries
−.2
Ratio to GDP −.1 0 .1
.2
United States
1800
1850
1900 Year
1950
2000
1950
2000
−.2
Ratio to GDP −.1 0 .1
.2
Other Countries
1800
1850
1900 Year
The top panel shows the ratio of net exports to GDP for the US since 1800. The bottom panel shows the same for seven other countries: Australia, Canada, France, Japan, Norway, Sweden, and the United Kingdom.
24
Ratio of Net Exports to GDP −.1 0 .1 .2
Figure 5 External deficits since 1960
1960
1970
1980
1990
2000
2010
1990
2000
2010
Ratio of Current Account to GDP −.1 0 .1 .2
Year
1960
1970
1980 Year
The two panels picture ratios of net exports (top) and the current account balance (bottom) to GDP for a subset of developed countries (list: ??).
25
.02
Figure 6 Twin deficits in the US
Ratio to GDP −.06 −.04 −.02 0
Government Surplus
Net Exports 1960
1970
1980
1990
2000
2010
−.06
Net Exports −.04 −.02 0
.02
Year
−.06
−.04
−.02 Government Surplus
0
.02
The panels illustrate the relation between net exports and the government surplus. Both series are plotted in the top panel. In the bottom panel, we report the same data as a scatter plot. The correlation between the two variables is 0.15.
26
.1
Figure 7 Yields on US holdings of foreign assets and foreign holdings of US assets
.04
Annual Yield .06
.08
Yield on US Assets Abroad
.02
Yield on Foreign Assets in the US
1970
1980
1990 Year
2000
2010
The lines represent yields (income divided by investment position) on US holdings of foreign assets and foreign holdings of US assets. In these calculations, direct investment is measured at current cost.
27
.8
Figure 8 Net income on foreign assets
.2
Annual Return .4
.6
Consumption
0
Net Income on Foreign Assets 1960
1970
1980
1990
2000
2010
Year
The lines represent net income on foreign assets (US income on foreign assets minus foreign income on US assets) and consumption, both expressed as ratios to GDP.
28
.2 8 Quarters Ahead 0 .1 −.1
−.1
4 Quarters Ahead 0 .1
.2
Figure 9 Persistence of net exports
.1
−.1
−.05 0 .05 Ratio of Net Exports to GDP
.1
−.1
−.05 0 .05 Ratio of Net Exports to GDP
.1
−.1
−.05 0 .05 Ratio of Net Exports to GDP
.1
20 Quarters Ahead 0 .1 −.1
−.1
12 Quarters Ahead 0 .1
.2
−.05 0 .05 Ratio of Net Exports to GDP
.2
−.1
The panels plot the ratio of net exports to GDP at different dates: the ratio “n” quarters in the future against the ratio now. The data are quarterly for 15 countries starting in 1980.
29
Two−Year Appreciation −.2 0 .2 .4 −.4
−.2
One−Year Appreciation −.1 0 .1 .2 .3
Figure 10 External deficits and real exchange rates
0 Net Exports
.1
.2
−.2
−.1
0 Net Exports
.1
.2
−.2
−.1
0 Net Exports
.1
.2
−.2
−.1
0 Net Exports
.1
.2
−.4
Four−Year Appreciation −.2−5.55e−17 .2 .4
−.1
Three−Year Appreciation −.4 −.2−5.55e−17 .2 .4
−.2
The figure shows the relation between net exports and the rate of appreciation of the real exchange rate over 1-4 years in annual data. The correlations are 0.05, 0.07, 0.08, and 0.06.
30
−.2
One−Year Appreciation −.1 0 .1
Two−Year Appreciation −.3 −.2 −.12.78e−17.1 .2
Figure 11 External deficits and real exchange rates in the US
−.02 −.01 3.47e−18 Net Exports
.01
−.04
−.03
−.02 −.01 3.47e−18 Net Exports
.01
−.04
−.03
−.02 −.01 3.47e−18 Net Exports
.01
−.04
−.03
−.02 −.01 3.47e−18 Net Exports
.01
−.4
Four−Year Appreciation −.2−5.55e−17 .2 .4
−.03
Three−Year Appreciation −.4 −.2 0 .2 .4
−.04
The figure shows the relation between net exports and the rate of appreciation of the real exchange rate over 1-4 years in annual data. The correlations are 0.38, 0.47, 0.56, and 0.60.
31
5
Figure 12 US Net Worth
Ratio of Net Worth to GDP 2 3 4
Households + Government
1
Households
0
Government
1940
1960
1980
2000
Year
Ratio of net worth to GDP for households, government, and the two together. Net worth includes financial assets and durable goods, with housing at market value.
32
4
5
Figure 13 Components of US Household Net Worth
Ratio to GDP 2 3
Net Worth
1
Housing at Market Value
Housing at Cost 0
Equity 1940
1960
1980
2000
Year
The lines compare the ratio of household net worth to GDP with similar ratios for equity and housing. Equity includes indirect holdings through pension funds and insurance. Housing is reported at both market value and replacement cost.
33
.6
Ratio of Consumption to GDP .62 .64 .66 .68
.7
Figure 14 US consumption and net worth
3
3.5 4 Ratio of Net Worth to GDP
4.5
The points represent time series observations of consumption and household net worth, with both expressed as ratios to GDP. The sample period is 1952-2004. The correlation between the two variables is 0.77.
34
.4
Figure 15 Swiss flows: saving, investment, and net exports
Ratio to GDP .2
.3
Saving
0
.1
Investment
Net Exports 1960
1970
1980 Year
1990
The lines represent components of the expenditure identity. See Figure 1.
35
2000
.25
Investment
.05
Ratio to GDP .1 .15
Saving
.2
Figure 16 German flows: saving, investment, and net exports
0
Net Exports
1990
1995
2000 Year
The lines represent components of the expenditure identity. See Figure 1.
36
2005
.4
Figure 17 Japanese flows: saving, investment, and net exports
.3
Saving
.1
Ratio to GDP .2
Investment
0
Net Exports
1960
1970
1980 Year
1990
The lines represent components of the expenditure identity. See Figure 1.
37
2000
.4
Figure 18 Norwegian flows: saving, investment, and net exports
Ratio to GDP .1 .2
.3
Saving
0
Investment
−.1
Net Exports
1960
1970
1980 Year
1990
The lines represent components of the expenditure identity. See Figure 1.
38
2000
.5
Figure 19 Chinese flows: saving, investment, and net exports
.4
Saving
.1
Ratio to GDP .2 .3
Investment
0
Net Exports
1970
1980
1990 Year
2000
The lines represent components of the expenditure identity. See Figure 1.
39
2010