Current Transformers (CTs) supplying protec- tive relays may suffer permanent or transient saturation under severe faults. Majority of protective relays are more ...
365
CURRENT RELATED RELAYING ALGORITHMS 1M:MUNE TO SATURATION OF CURRENT TRANSFORMERS B.Kasztenny
E.Rosoiowski
J.Izykowski
M.Eukowicz
The Technical University of Wrociaw Wroclaw, POLAND
INTRODUCTION
Current Transformers (CTs) supplying protective relays may suffer permanent o r transient saturation under severe faults. Majority of protective relays a r e more o r less sensitive to CTs saturation. O n the other hand, contemporary microprocessor based relays open the window of opportunity for performing sophisticated checkings in order to either reconstruct the secondary current waveform [1,2] or compensate the measuring algorithms for saturation of CTs [3,4]. As its innovative contribution, this paper delivers algorithms for measuring current amplitude and impedance components, resistive to transient saturation of CTs. The presented algorithms combine two procedures: (1) Recognition of periods of saturated/linear operation of an observed CT, and (2) Variable-length data window measuring algorithms [5,6] that use unsaturated samples of the secondary current.
The error signal, el, is defined as:
where:
present sampling instant, scaling coefficient given as:
k
p 2
P=
(Z)
,(2) (k) -
T N
d2)
sampling period, number 'of samples per cycle, 2nd order derivative of the secondary current, i, computed using the 5-point formula:
-i(k)
16i(k - 1) -30i(k -2)
-k 16i(k -3 ) --i(k -4)
12 T 2 (3)
Since eq. ( 3 ) gives the 2nd order derivative for tlhe time marker k-2, the signal x in eq. (I) must be also taken for k-2, thus:
DETECTION OF CT SATURATION
(4)
X(k) = i(k-2)
In transient saturation a CT shows, in every cycle of the fundamental frequency, periods of errorless transformation. In the proposed approach, these unsaturation periods are detected by one of three alternative methods. Algorithm 1.
Algorithm 1 combines the secondary current and its second order derivative and is based upon the fact that the secondary current and its appropriately re-scaled second order derivative assume approximately the same amplitude, but opposite signs during linear operation of a CT. The error signal defined as the ratio of a sum of the secondary current and its second order derivative to the current amplitude is compared with the appropriate pre-set thresholds indicating, in this way, periods of saturation/unsaturation of a CT. Developments in Power System Protection, 25-27th March 1997, Conference Publication No. 434, 0 IEE, 1997
X
where:
amplitudle of t h e signal x computed as:
m,xq orthogonal components of x obtained using the sin/cos filters of the lindow length Ni12.
The signal el shows significant peaks when a CT both enters and leaves its saturation periods. Thus, the flag SAT indicating the saturation intervals is set as follows:
366 where:
A I ,Bi
thresholds optimized for a given type of a CT.
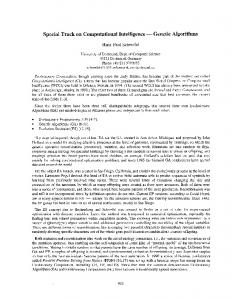
Certainly, when the algorithm is initiated the flag SAT is re-set (SAT= 0). Figures l a and l b illustrate operation of the algorithm l. Two basic observations must be pointed-out here:
(1) the algorithm gives very good recognition of t h e s a t u r a t e d k n e a r operation of a CT, but requires the sampling frequency a t the level of 3kHz o r more; this is so mainly due t o t h e need of computing the 2nd order derivative, (2) it brings more troubles in detecting the end of a saturation interval than its beginning; this is so because the waveshape of a secondary current is more smooth when a CT leaves t h e mode of saturated operation (with reference t o Figures l a and l b , the signal el displays lower peaks a t the ends of t h e saturation periods).
..'primary -I m
1
0.02
0.04
0.06
0.08
0.1
0.12
0
'
0.02
0.04
0.06
0.08
0.1
0.12
0
0.02
0.04
0.06
0.08
0.1
0.12
0
0.02
0.04
0.06
0.08
0.1
0.12
-1m I 0
0.02
0.04
0.06
0.08
0.1
0.12
0.04
0.06
0.08
0:l
0.12
0
-2
I
I
.
Algorithm 2,
Algorithm 2 combines mean and median filters applied to the secondary current waveform and is based o n the ability of such a pair of filters to detect changes in the shape of a signal. The error signal defined as difference between the outputs from mean and median filters of the same window length is a base for recognition. The error signal, e2, is thus defined as: e2(k) =
where:
mn [ i(k) ] - md [ i(k) ]
Z(k)
mn md
(7)
amplitude of i computed according t o eq. ( 5 ) , mean over the chosen number of samples, W , median over the same number of samples.
The signal e2 displays high values when the secondary current changes its shape, particularly when a CT enters and leaves its saturation periods. The flag SAT is handled exactly in the same way as in the algorithm 1 (eq. ( 6 ) ) ,but certainly, the thresholds A2 and B2 assume their own values. The length of the windows for the mean and median filters, W, has been optimized and recommended t o be set a t N/12. Figures l a and IC illustrate the method. Comparing Figures l b and IC one observes exactly the same output given by the algorithms 1 and 2.
10
'Ad-
" ;b
--
TIME [ms]
Figure 1. Illustration of the proposed algorithms. The primary and secondary currents (a); the algorithm 1 related signals (b);the algorithm 2 related signals (c); direct (d) and quadratic (e) orthogonal components of the current; the amplitude estimated by applying the full-cycle algorithm and the new technique (f).
Algorithm 3.
Algorithm 3 based on Artificial Neural Network (ANN) technique feeds a n ANN with samples of the secondary current from a pre-defined and
367 sliding data window, while the output from an ANN indicates saturation/unsaturation of a watched CT. The used net is non-linear, threelayer and fully interconnected.
component based approach. The direct, id and quadratic, i, orthogonal components of the secondary current, i, are filtered-out as follows [5,61:
The traininghesting cases have been accomplished by ATP-EMTP simulation. The target output for the ANN was defined by comparing the primary and secondary currents. When trained, the ANN was forced to give either + 0.5 (saturation) o r -0.5 (linear operation of a CT). During testing, in turn, positive outputs from the ANN indicate on saturated operation of a CT. For l k H z as a sampling frequency ( N = 2 0 samples), 15 samples (3/4 of a cycle) was chosen as the window length for the ANN. The best results have been achieved for tanh as an activation function and the configuration 8-4-1.
L(k --I id(k) = a(n,L) i(k-n) n =O
Considering all the samples in all the collected waveforms and comparing the target and actual output from the ANN-based saturation detector we obtained: 0 0
percentage of missing indications on saturation: 0.82%, percentage of false indications on saturation: 1.33%.
In most the cases the above recognition errors correspond to one-sample delay between the target and actual signals SAT.
iq(k) ="i-;(n,L) n=O
where:
i(k-n)
a,b
data window coefficients.
The window length, L(k), increases until it reaches its rated length (ussualy a cycle or half a cycle). Current Amplitude Measurement.
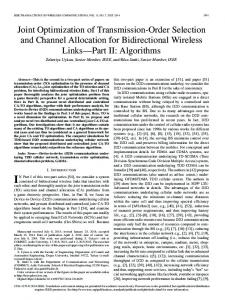
With reference to Figure 2, the amplitude is measured in the following way: When a fault is detected, the window length, L , is set a t 3 samples. The saturation detector (methaids 1, 2 clr 3) process the samplles of the secondaLry current and either detects (SAT= l ) o r not (SAT=O) saturation of the CT. If the C T is not saturated, the variable data window algorithm is executed and gives the estimate of the amplitude based first on 3 samples, next on 4 samples, etc. until the window length reaches its full length N
The alternative algorithms 1, 2 and 3 have been carefully investigated. Generally one concludes:
DETECTION
(a) all three methods give the same output in most t h e cases, (b) the first two methods face more difficulties in finding the end of a saturation period, (c) the ANN-based technique works well also under comparatively low sampling frequency (IkHz is sufficient, while a? least 3kHz are required for the methods 1 and 2).
L-------l-----i
I
SATURATION DETECTION
MEASURING ALGORITHMS
The variable data window measuring algorithm completes the proposed technique. Unlike the algorithms of constant data window length, the variable data window does not slide with passing of time, but extends its length by one sampling period with every new-coming sample until it reaches its pre-defined full length, and only after that it starts to slide. By this operation, one earns ultra-high-speed response of a measuring algorithm due to removing pre-fault samples from the data window. Deterioration of the filtration quality of such an algorithm is the price to pay for this gain [5,6]. This paper uses the variable data window algorithm not only for speeding-up the measurement, but, first of all, for selecting samples of secondary current not affected by saturation of a CT. Generally, this paper follows the orthogonal
(8)
NEXT SAMPLE
.-
VARIABLE DATA WINDOW LENGHT MEASURING ALGORITHM
CONSTANT DATA WINDOW LENGHT ALGORITHM
7
I -
Figure 2. The basic flow chart of the proposed measuririg algorithm (M - an auxiliairy counter used for detecting the permanent saturation, L - present window length, N
-
number of samples in a cycle).
368 (a cycle in this paper). If so, the window starts to slide instead of extending. When saturation is detected ( S A T = l ) , the amplitude is not measured, but the previous amplitude estimate is frozen. When the flag SAT is deleted (the CT out of saturation), the algorithm re-activates and starts from L= 3 again. When a CT does not show periods of linear transformation for a specified time interval (counter M in Figure 2), the algorithm returns to its classical constant length full-cycle variant.
40 20
i~ ./---. -.
Ir0
7
-
-
* - . - - _ _ _ _
0 02
0 04
0 06
0 08
01
-50 0 02
0 04
0.06
0 08
01
012
Figures l a , I d , l e and If deliver sample results. Impedance Components Measurement.
The impedance (R,X) is measured based upon orthogonal components of both voltage, v, and current, i, signals: R(k) =
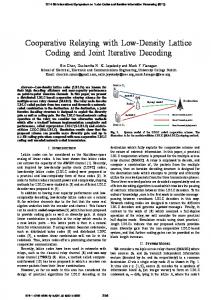
Figure 3. Sample impedance measurement (current sig-
Vd(k) id(k) -4- vq(k) iq(k)
i 2d(k)
(9)
i 2q(k)
(10) Voltage is analyzed using a constant length fullcycle Fourier data window, while current signal is split into its orthogonal components using the proposed method (eq. (8)). Since the voltage data window slides, thus its mid-point moves by one sample. O n the other hand, the data window for a current extends, thus its mid-point moves by half a sample. Therefore, an appropriate phase compensating procedure must be applied: The group delay assumes:
Therefore, the corrected ponents of the current are:
012
TIME [ms]
nal shown in Figurela): 1 - full-cycle sin/cos filters fed by primary current, 2 - full-cycle sin/cos filters fed by secondary current, 3 - the new method.
CONCLUSIONS
The new method for measuring amplitude of a current and impedance components immune to saturation of a C T is proposed. The technique combines detection of saturated/ linear operation of a CT with the variable data window measuring algorithm. Three alternative methods have been presented and analyzed for detecting the status of a CT. The simulation studies have shown both faster time response and better steady state accuracy of the proposed measuring technique.
orthogonal
com-
Certainly, the correcting algorithm (12) is nonstationary - for short windows the correction is significant, when the data window for the current reaches its full length ( L = N ) the correction vanishes. Figure 3 illustrates the proposed impedance algorithm. The full-cycle sin/cos algorithm fed by the hypothetical primary current is a comparison base (curves 1). Such as algorithm, but fed by the actual (partly saturated - see Figure l a ) secondary current gives much worse results (curves 2). T h e new method (curves 3 ) , in turn, provides much better response. As in Figure 2, the impedance estimates a r e frozen when saturation of the CT is detected.
REFERENCES [ l ] Kang Y.C., Kang S.H., Park J.K., Johns A.T. and Aggarwal R.K., 1996, "Development and hardware implementation of a compensating algorithm for the secondary current of current transformers", Proceedings, Part C, Vo1.143, No.1, pp.41-49. [2] Kang Y.C., Park J.K., Kang S.H., Johns A.T. and Aggarwal R.K., 1996, 'An algorithm for compensating secondary currents of current transformers" PES Winter Meeting, Baltimore 1996, paper 96 WM 064-6 PWRD.
[3]Hosemann G. and Steigerwald H.M., 1993, "Modal Saturation Detector for Differential Protection", IEEE Trans. on Power Delivery, Vo1.8, No.3, p p . 9 3 3 - 9 4 0 . [4]Wiszniewski A. and Szafran J., 1989, "Distance Digital Algorithm Immune t o Saturation of Current Transformers', Proceedings of the 4th Developments i n Power system Protection Conference, pp.196-199. [5]Xia Y.Q. and Li K.K., 1994, "Development and ImDlementation of a Variable-Window Aloorithm for High-speed and Accurate Digital DistaKce Protection", IEE Proceedings, Part C, Vo1.141, N0.4, pp.383-389. [6] Wiszniewski A., 1990, "Digital high-speed calculation of the distorted signal fundamental component", Proceedings, Part C, Vo1.137, No.1, pp.19-24.