J Toxicol Pathol 2008; 21: 207–221
Review
Current Status of Automation in the Process of Visualisation and Analysis: What is important for Toxicologic Pathology? Paul-Georg Germann1, Andreas Doelemeyer4, Manfred Kohler1, Lars Mecklenburg1, Chihiro Noguchi2, Thomas Nolte3, Elke Persohn4, Frank Seeliger5, Maria Wendt1, and Thomas Wöhrmann1 1 Nycomed GmbH, Byk Gulden-Str. 2, 78467 Konstanz, Germany 2
Drug Safety and Pharmacokinetics Laboratories, Taisho Pharmaceutical Company Ltd., 1–403 Yoshino-cho, Kita-ku, Saitama-shi, Saitama 331–9530, Japan 3 Boehringer-Ingelheim Pharma GmbH & Co. KG, Birkendorferstrasse 65, 88400 Biberach / Riss, Germany 4 Preclinical Safety, Novartis Pharma AG, Auhafenstrasse, CH-4132 Muttenz 1, Switzerland 5 AstraZeneca R&D, SAP, B.68:2, SE-15185, Södertälje, Sweden
Abstract: Current advances in automation of pathology methods with focus on toxicologic pathology are dealt with. Areas of tissue can be separated and collected for further analysis by laser microdissection. Automatic stainers for histology and immunohistochemistry rapidly produce high standard quality stains of tissue sections. Confocal laser scanning microscopy allows visualization of fluorochromes with superior quality optical data. Introduction of field emission cathodes and low vacuum technologies to scanning electron microscopy enables examination of non-coated and non-dehydrated specimens. Energy filtering transmission electron microscopy yields high contrast images and provides novel specimen information. Digital image analysis offers systems to support users in specific evaluations. To facilitate orientation on the market, a selection of commercially available equipment is presented and the features of the devices are compared. (J Toxicol Pathol 2008; 21: 207–221) Key words: automation, confocal microscopy, energy filtering transmission electron microscopy, laser microdissection, scanning electron microscopy, stainers for histology and immunohistochemistry, toxicologic pathology
Introduction For obvious statistical reasons, biological experiments are carried out on groups of individuals exposed to the same treatment, rather than on single individuals. Observations in a single individual may be purely incidental, as their statistical probability is 50%. Only with 6/6 individuals reacting the same way, statistical significance > 95% can be achieved. And, because due to individual biological variability not always all individuals react the same way, groups larger than 6 individuals are required to enable meaningful evaluation of experiments. In subchronic toxicology studies with rodents, groups of 10 to 20 animals per sex are formed, and in chronic experiments the group size amounts to 50 or more animals per sex and dose level. High accuracy of the results can be achieved on material in which the individual variation is limited by standardization.
Received: 28 August 2008, Accepted: 24 September 2008 Mailing address: Paul-Georg Germann, Nycomed GmbH, Byk Gulden-Str. 2, 78467 Konstanz, Germany TEL: 49-0-7531844910 FAX: 49-0-75318494910 E-mail:
[email protected]
Nowadays, for toxicology studies, animals are available with standard genotypic and phenotypic features, and the in life conditions of studies such as husbandry, feeding and clinical examinations are highly standardized as well. Microscopic evaluation, on the other hand, still widely remains to be “science and art” based on personal judgment. The methods used for effect evaluation in toxicologic pathology were analyzed by Holland 1 . He compared the power of discriminant methods used in pathology, such as affected / not affected, outside-control, pair-contrast, scoring (grading), ordering and measuring, and proved that ordering, and especially measuring were the most powerful approaches. In order to carry out unbiased evaluation and to apply such quantitative methods, there is a need for increased standardization and for automation of pathology procedures. In toxicologic pathology, quantitative evaluation is used in areas such as staging of spermatogenesis, counting of ovarian follicles, or brain morphometry in developmental neurotoxicity studies. However, this work —usually carried out manually— is tedious and labor intensive. Progress in standardization has been achieved by introducing recommendations with respect to trimming tissues 2–4 .
208
Automation in Toxicologic Pathology
Another important step forward in standardization was the introduction of two international systems of nomenclature and diagnostic criteria for terms used in toxicologic pathology (WHO/IARC and STP/SSNDC). The INHAND initiative, which has been started in 2006, is currently revisiting these nomenclature systems to achieve one single international system of nomenclature and diagnostic terms for toxicologic pathology (www.goreni.org). The proprietary knowledge base CEPA (Cell proliferation and Apoptosis5) aims on standardization of immunohistochemical techniques as well as techniques for quantification of cell proliferation and apoptosis and provides a collection of related standardized protocols. This review deals with current advances in automation of processing, imaging and evaluation in pathology, i.e. developments which clearly increase quality of data, and, additionally to this beneficial effect, also help to increase productivity and limit costs of experimental work.
Laser Microdissection in Toxicologic Pathology Microdissection of particular tissue substructures or even single cells allows to separate the particular cells of interest from the surrounding tissue without damaging genes and proteins (reviewed in Ladanyi et al.6). Microdissection of whole tissues is increasingly applied in toxicologic pathology and meanwhile has become an essential basis for mechanistic studies in toxicology7. In contrast, microdissection of living cells or cytology specimens is of little interest to the toxicologic pathologist and therefore is not dealt with here.
Techniques of laser microdissection In principle, there are 2 techniques. The first technique is laser capture microdissection (LCM). This technique was developed at the NIH. A transparent thermoplastic film (ethylene vinyl acetate polymer) is applied to the surface of the tissue section on a standard glass slide. Under direct light microscopical control, a carbon dioxide infrared laser pulse is used to specifically activate the film above the area of interest. At this spot, the film melts and bonds to the tissue which can then be lifted off, leaving the rest of the tissue behind8,9. The film is permanently bonded to the underside of a transparent vial cap, and this cap is placed directly onto a vial for molecular processing. The capture process does not damage DNA, RNA or protein because the laser energy is absorbed by the film (http://www.moleculardevices.com/ pages/instruments/microgenomics.html). The second technique is laser cutting microdissection (LMD), using a laser that cuts around the area of interest. A pulsed or solidstate UV laser is used for very precise cutting without heating the target structures (“cold ablation”). Therefore, there is no impact on DNA, RNA or proteins in the dissected cells. No mechanical contact is necessary to carry out the laser cut. However, various techniques are used to transfer cut tissue samples into a vial for further molecular processing (Fig. 1). This step is important, since contamination with
RNAse or a foreign mRNA or DNA is a significant risk when dissecting tissues. All systems that are commercially available protect the sample against environmental impurities, either by avoiding any mechanical contact or by covering the tissue with a clean glass slide. One technique to transfer cut tissue samples into a molecular vial is “pressure catapulting”. This technique allows contact-free sample extraction against gravity (http://www.palm-microlaser. com). Another system uses gravity to collect cut tissue samples that drop into the cap of a vial (http://www.leicamicrosystems.com). In yet another system, microdissected samples are removed from the surrounding tissue using vials with specifically coated caps that attach to the dissected specimen. (http://www.molecular-machines.com).
Computer-assisted microdissection Whereas previous microdissection systems required manual dissection under direct microscopical visual control, systems nowadays are equipped with motorized slide - and cap handling, CCD cameras and a sophisticated graphical user interface. Slides are scanned and displayed in a software that provides drawing tools for labeling of target cells. Different magnifications can be used and multiple groups of different target cells can usually be labeled (Fig. 2A). Some systems are even combined with image analysis software that allows automated detection of the selected areas. After identification of all target cells, these are microdissected automatically (Fig. 2B). Microdissection can be documented photographically, including images from the host tissue and images from the microdissected tissue sample (Fig. 2C). Some systems allow processing of multiple slides in one session whereby microdissected areas from several samples can be pooled. This facilitates sampling of similar regions of interest from serial sections of the same tissue and thus results in a higher yield of tissue for downstream molecular analysis. The success of downstream molecular analysis crucially depends on the number of cells that are sampled. Although under specific conditions molecular analysis of single cells is technically feasible, it is usually recommended to sample not less than 500 cells for mRNA extraction and not less than 1,000 to 5,000 cells (depending on the tissue) for subsequent gene expression profiling by chip hybridization. At least 50,000 cells should be sampled for protein analysis. Immediately after dissection, the excised tissue samples are lysed for further molecular analysis. Lysis buffer is chosen according to the intended downstream target (RNA, DNA or proteins). Commercial kits for extraction and purification can be used, and many suppliers provide kits that are specifically designed for small tissue volumes derived from microdissection.
Sample preparation for laser microdissection Inactivation of RNAse after microdissection: If mRNA is to be analyzed, it is crucially important to inactivate exogenous and endogenous RNAses. Therefore, all
Germann, Doelemeyer, Kohler et al.
209
Fig. 1. Schematic drawing of different techniques for laser microdissection and sample transfer. A) A membrane is melted by laser light, bound to the selected tissue area and pulls it out of its connection. B) A laser cuts around the area of interest. This is then catapulted into a vial, using a defocused laser light. C) A laser cuts around the area of interest which then falls into a vial. D) A laser cuts around the area of interest that is mounted on a membrane slide. A normal glass slide protects it from the other side. The membrane binds to a coated cap which lifts off the dissected tissue.
A
B
C
Fig. 2. Section of frozen mouse pancreas stained with cresyl violet (A). The endocrine pancreas was selected and microdissected (B), using the MMI SLµCut system. The dissected tissue is attached to the cap of a vial that is used for lysis and downstream molecular analysis (C).
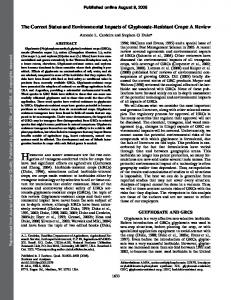
Fig. 3. Rat spleen (HE stained, scale bar=100 µm). (A) This is stained by one of the bath stainer that we used previously. (B) This is stained by the SYMPHONY. The fine structure of the spleen is displayed more clearly than in the Figure A.
Fig. 4. Confocal laser scan of a Rat cerebrum. Astrocytes (a) and capillary endothelial cells (*). Living tissue slices were stained with yellow-fluorescent protein (YFP) by DNA transfection using gene gun shelling with YFP-DNA coated gold beats. Thickness of the Z-stack is 65 µm in a total depth of 150 µm within a 300 µm tissue slice. Image stacks were collected with a Plan S Apo × 60 water immersion objective (NA 1.2) with 0.4 µm optical slices.
210
Automation in Toxicologic Pathology
materials should be rinsed first with RNAse decontamination solution (e.g. RNaseZap, Ambion, Austin, TX, USA) and second with 70% ethanol. Glassware should be heated at 180°C before use. RNAse-free buffers and reagents should be used wherever possible. All liquids and solutions (except for Tris-containing solutions) should be treated with 0.1% diethyl pyrocarbonate (DEPC). Fresh gloves should be worn at all times when handling samples. Fixation, processing and sectioning for microdissection: Both formalin-fixed / paraffin-embedded and frozen tissue samples can be used for microdissection. Techniques for formalin-fixation, paraffin-embedding and cryofixation do not differ from routine procedures employed in toxicologic pathology. Slides are cut according to routine procedures, but some systems require that sections are mounted on special slides. Staining for Microdissection: Sections can be used for microdissection directly. For better visualization of tissue architecture, a fluid cover medium can be used10. However, in most cases it is necessary and advisable to stain tissues in order to allow microscopic selection of the cells of interest. Different staining techniques are available, including immunohistochemistry or immunofluorescence 11 . The employed staining technique needs to allow the anticipated downstream molecular analysis and therefore should not interfere with RNA, DNA or proteins. For most purposes, a simple nuclear staining will be sufficient. The authors use cresyl violet-acetate staining for downstream mRNA analysis (Appendix 1). It is also possible to adapt hematoxylin and eosin (HE) - based stains.
Downstream Analysis of Microdissected Samples mRNA As mentioned above, analysis of mRNA in tissue samples requests stringent inactivation of exogenous RNAse and prevention of endogenous mRNAse activation. Tissues can be fixed in 4% freshly prepared paraformaldehyde, but precipitative fixatives such as ethanol usually yield higher amounts of RNA (see Ladanyi et al.6, and references therein). Best results are obtained from freshly frozen tissue samples. Extraction and pu r i f i c a t io n of m R NA s h o u ld be pe r f o r m e d w i t h commercially available kits that are specifically designed for mRNA extraction from small amounts of cells. RTPCR, either performed conventionally or in real-time, is a very sensitive technique and therefore in theory it can be applied on mRNA extracts from single cells. However, in most cases a minimal number of 500 cells is recommended for reliable downstream analysis. If mRNA expression is to be analyzed with cDNA-microarrays, a minimum of 1,000 to 5,000 cells is recommended. RNA extracted from these cells still needs to be amplified for microarray analysis. This is either achieved by linear amplification12, or by PCRbased exponential amplification13. The multitude of steps in microdissection and RNA extraction, purification and amplification poses a high risk for technical variability in
subsequent microarray analyses. However, several studies have demonstrated that once a protocol is established, the biological variability in gene expression among independent specimens and among histologically distinct samples within a specimen is greater than the technical variability associated with the procedure14.
DNA and proteins In toxicologic pathology, analysis of DNA and of proteins is much less important than analysis of RNA. Nevertheless, nowadays protocols have been established that allow DNA analysis or application of two-dimensional gel electrophoresis, immunoassay, or mass spectrometry based technologies (reviewed in Ladanyi et al.6).
Applications of laser microdissection in toxicologic pathology Situated between microscopic analysis of tissues from test item-treated laboratory animals on one hand and its molecular analysis on the other hand, laser microdissection is useful in the elucidation of toxicological mechanisms. Laser microdissection has been used to investigate mechanisms of toxicity in specific compartments of the liver 15 , lung 16–19 , brain 20 , eye 21 , uterus 22 , testis 23 , and prostate24. It also was applied to address mechanisms of carcinogenicity in toxicity studies25,26.
Staining Routine stainers In toxicologic pathology, HE is the most valuable general stain. Various stainers are commercially available which enable to perform standard quality stain on a large number of slides. User-defined protocols can be employed to achieve the optimal intensity of HE stain or to perform various special stains. Table 1 gives an overview of the most commonly used devices. The SYMPHONY (Ventana), is one of the most current stainers which completely automates every step of slide preparation with one touch operation from deparaffinization to the application of a glass coverslip. The slides are immediately available for pathologist’s evaluation. The SYMPHONY has the following advantages: (1) It is not a bath stainer so that it uses fresh reagents for every slide, and that means, there is no deterioration and cross contamination. (2) This device has independent functional modules for slide identification, drying, paraffin removal, staining and coverslipping, and in addition, a modular design for easy service and replacement, when needed. (3) SYMPHONY has its own integrated computer, equipped with a touch screen for operation. A remote support is available. (4) It is very easy to manage reagents and consumables because solutions are pre-packaged. (5) The slides are stained so clearly that resolution is essentially increased. For example, it is difficult to recognize the mast cells in some HE slides stained by a bath stainer, but they become more apparent owing to visibility of cytoplasmic
Germann, Doelemeyer, Kohler et al.
Table 1. Comparison of Several Commercially Available Routine Stainers Name SYMPHONY DRS-2000 ST5020 Manufacturer Ventana Sakura Finetek Leica Dimensions (W/D/H) 1245 mm / 712 mm / 1930 mm 1150 mm / 490 mm / 660 mm 1070 mm / 760 mm / 760 mm Weight 310 kg (dry weight) 101 kg 164 kg (dry weight) Power supply 230 V / 50/60 Hz 100 V / 50/60 Hz 100 V / 50/60 Hz Dyeing method Mounting reagent B a t h s t a i n ( D i p p i n g b y Bath stain (Dipping by robotic arm) robotic arm) Cover slipping Possible (built in) Impossible Possible (Combination with CV5030) Reagent Ventana made reagent only Everything Everything Loading capacity Max. 500 slides Max. 440 slides Max. 360 slides Operating environment Color touch panel (Windows Monochromatic touch panel Color touch panel based)
211
TST44C Medite 1210 mm / 670 mm / 640 mm 115 kg 100–230 V / 50/60 Hz Bath stain (Dipping by robotic arm) Possible (Combination with ACS720) Everything Max. 360 slides Monochromatic touch panel
CV5030 = Coverslipping system (Leica) ACS720 = Coverslipping system (Medite)
granules in the slides stained by the SYMPHONY. On the photograph in Fig. 3, the fine structure of spleen, such as red pulp, white pulp, marginal zone, is more clear than that stained by the bath stainer. In brief, one can recognize various structural features more precisely. Such improvements enable accurate diagnoses during short watching time. In our experience, SYMPHONY also has some disadvantages: (1) After coverslipping, the slides sometimes contain bubbles. (2) Because the sections are stained very clearly, and the tone of stain is sharply reflected by thickness of sections, the technicians need higher technical skills in sectioning. (3) One is dependant on the exclusive reagents only. Moreover, the reagents are expensive, and for some of them, the usage time is quite short. (4) It is not always feasible to use remote support, because of its limited availability especially in pharmaceutical companies. In addition, the maintenance of the device costs a great deal in comparison with other bath stainers. The other stainers listed in Table 1 are all bath stainers, using the traditional methodology. Still, their use enables to produce slides with standard quality required for successful microscopic evaluation.
Automation in immunohistochemistry Immunohistochemistry, by definition, is the identification of a tissue constituent in situ by means of a specific antigen-antibody interaction where the antibody has been tagged with a visible label27. Since its conception in 1940s28, immunochemistry has been used as a tool in all aspects of investigation of biological materials. In many fields it soon passed from an experimental approach to the method of choice and hence became routine29. Therefore, slide-based special techniques in toxicologic pathology such as immunohistochemistry remain the gold standard for the evaluation of toxicologic effects on animals following administration of test items in conjunction with microscopic examination of HE stained tissues.
To standardize the procedure of immunohistochemistry, all slides of tissues from different periods of fixation should be stained in the same run and processed in an identical manner. Various automated immunostainer systems are commercially available (Table 2). They offer combinations of speed and high throughput necessary to meet productivity requirements without compromising the flexibility and performances essential for today’s busy and cost-conscious laboratory of toxicologic pathology. Automatic systems in immunostaining require high degree of reproducibility and productivity in immunohistochemistry (IHC) and moreover in newer technologies such as in situ hybridization (ISH), fluorescent in situ hybridization (FISH), and microarray slide processing. To fulfill the needs of a modern IHC Laboratory, automated immunostainer should exhibit the following main features: – Providing both open - and closed - system flexibility – Offering the possibility to choose from different models depending on the amounts of slides – Possibility of a full bar-code control for slides and reagents – Flexible and user-friendly data management systems Most immunostainers have similar functions, recognizing the slides automatically by bar code and staining them according to specific protocols. Generally the immunostainers have some advantages compared to staining by hand: large numbers of slides can be uniformly stained during short staining time, and such slides are suitable for quantitative analysis. On the other hand, in automated immunostainers it is difficult to make fine adjustment in DAB staining, the reagents are expensive, and about double amounts of primary antibodies are needed compared to staining by hand.
Confocal Laser Scanning Microscopy Imaging in toxicopathology is mainly based on HE stained slides and special stains including histochemical and immunohistochemical stains, but in the last years there has been an increasing demand for advanced imaging
212
Automation in Toxicologic Pathology
Table 2. Comparison of Several Commercially Available Immunostainers Name Discovery XT™ i6000™ Autostainer plus™ Dako BioGenex Manufacturer / Ventana Denmark Address Medical Systems S.A. 4600 Norris Canyon Produktionsvej 42 Parc d’Innovation – BP Road San Ramon 2600 Glostrup CA 94583 USA 30144 Denmark Rue G. de Kaysersberg 67404 Illkirch CEDEX France Application Immunohistochemistry Immunohistochemistry Immunohistochemistry In Situ Hybridisation System Barcode-System Barcode-Version open Barcode-Version open (solutions and slides) version version
Software Easy-to-use Protocol administration Routine Staining Slide capacity Costs per slide (estimated) Staining at constant 37°C possible?
Bond-max™ A. Menarini Diagnostics Europadamm 4 41460 Neuss Germany
Immunohistochemistry Immunohistochemistry In Situ Hybridisation Barcode-Version open B a r c o d e - S y s t e m version (solutions) open version (slides and solutions) Windows XP – based, Windows XP – based, Windows XP – based, Windows XP – based, Windows XP – based, multilingual multilingual multilingual multilingual multilingual yes yes yes yes yes suboptimal ok ok ok ok
30 ~15
60 ~5
no ambient yes (every slide separate temperature temperature possible) inside Stainer outside Stainer
Pretreatment (dewaxing and epitope retrieval) Preparation-time short Reagent preparation low (Ak) Open or closed system
Autostainer 720™ Lab Vision Corporation 47790 Westinghouse Drive Fremont CA 94539 USA
closed
longer high (all reagents) open
techniques, including confocal laser scanning microscopy (CLSM). This demand is stimulated by the regulatory authorities, that require more data on toxicologic mechanisms. The principle of CLSM was already known about 60 years ago, but recent developments in computer technology, optical instruments and modern fluorochromes allow generating of information based on a superior quality optical data30,31. In contrast to broad field fluorescence microscopy, CLSM allows optical sectioning with a tremendous effect on contrast and resolution. Basically, all of the different system approaches are based on the same concept: The fluorophorelabeled probe is exited by an oscillating laser beam whose scanning spot is focused on a given plane within the specimen. Emitted light of a wavelength longer than the excitation light returns back through the objectives and the optic system, passing a dichroic mirror and the barrier filter. A pinhole aperture is located in front of the detection device, resulting in an elimination of out-of-focus light and an improvement of contrast. While a CCD camera is the common detector (beside the human eye) in broad-field microscopy, a fast and specific photomultiplier tube (PMT)
48 ~5
72 / 84 ~5
30 ~5
no ambient temperature
no ambient temperature
inside Stainer
inside Stainer
yes (every slide separate temperature possible) inside Stainer
short low or high (depends on the system) open
short low or high (depends on the system) open
short low or high (depends on the system) open (ready to usereagents also for sale)
is typically used in CLSM. In the past years, continuing development of new fluorophores and technical devices have lead to new applications that can be used on fixed or living cells32. Several commercial devices are in use today and the rapid development of technical specifications and laser sources enable new experimental approaches. Table 3 gives an overview of the most commonly used devices. Fig. 4 shows an example of confocal laser scan of a rat cerebrum.
Electron Microscopy Scanning electron microscopy The past decades have seen impressive new developments in the field of electron microscopy, w h i c h seemed to be out-dated with the advent of immunohistochemistry and the –omics technologies. Of utmost importance for life sciences are the introduction of field emission cathodes as well as the low-vacuum and extended low vacuum (Environmental SEM, ESEM) technologies in scanning electron microscopy, which enable
Germann, Doelemeyer, Kohler et al.
Table 3. Comparison of Several Commercially Available Confocal Laser Scanning Microscopes Name Fluoview 1000 TCS SP5 Manufacturer Olympus Leica Laser VIS (Ar 457, 488, 515 nm; HeNe VIS (Ar 458, 476, 488, 496, 514 nm; HeNe 543, 633 nm); UV (DPSS 405, 440 543, 594, 633 nm; DPSS 561 nm); UV nm); IR (Titan: Saffire 700 – 998 (DPSS 405 nm; pulsed Ar 351, 364 nm); IR (Titan: Saffire 720 – 1000 nm) nm); Scanner T w o g a l v a n o - m e t r i c m i r r o r s , Two galvano-metric mirrors, pixelsize 4 × 1 pixelsize 128 × 128 to 2048 × 2084 to 2048 × 2084 Scan Modes XYZ, t, wavelength (λ) XYZ, t, wavelength (λ) Spectral resolution 2 nm 5 nm Modularity high moderate Extension SIM ® scanner, TIRFM, FRET, FRET, FRAP, FLIP, FCS, SP-FLIM, fast FLIM, FRAP ROI spectrometer, AOBF® ® View Software solution Olympus Fluoview FV10-ASW1.5 Leica LAS AF® Multiphoton extension possible possible Cell/Tissue Culture possible possible Incubation chamber SIM® = second scan head for simultaneous excitation and detection. FCS = Fluorescence Correlation Spectroscopy. VIS = visible (light spectrum). FRET = Fluorescence resonance energy transfer. TIRFM = Total internal reflection fluorescence microscopy. FLIM = Fluorescence lifetime imaging microscopy.
scanning of un-sputtered surfaces without electrostatic artifacts. Field emission SEM (FESEM): Low acceleration voltages became possible by replacing the conventional tungsten cathodes by field emission cathodes, used in field emission SEM (FESEM). Low acceleration voltages means low kinetic energy electrons which penetrate less deeply into the sample compared to high energy electrons. The image generated is closer to the surface, resembling more the real surface. In addition, the electron beam can be better focused resulting in smaller area contamination so that electric charging of samples is markedly reduced. This reduces the need to coat insulating probes with a conductive. Environmental SEM (ESEM): Conventional SEM requires samples to be imaged under vacuum, which means that samples that would produce a significant amount of vapor, e.g. biological specimens, need to be either dried or cryogenically frozen. Samples, therefore, cannot be observed in the native, hydrogenated state. In addition, conventional SEM examination, and even FESEM examination, may lead to electric charging of insulating problems if not coated with a conductive material. Coating, however, may reduce the value of the results obtained as small details on the surface of the sample may be concealed, let alone that coating is done under vacuum, which drastically alters hydrated specimens. Several technical advances made possible the examination of non-coated and non-dehydrated specimens in a low vacuum. These were: – The use of pressure-limiting apertures with differential pumping in the path of the electron beam to separate the high vacuum regions around the gun and lenses from the low vacuum region of the sample chamber.
213
LSM 510 META Zeiss VIS (Ar 458, 477, 488, 514; HeNe 543, 594, 633 nm; DPSS 561 nm); UV (pulsed Ar 351, 364 nm); IR (optional) T w o ga l v an o - m e t r i c m ir r o r s , pixelsize 128 × 128 to 2048 × 2084 XYZ, t, wavelength (λ) 10 nm moderate FRET, FRAP, FLIP, FLIM LSM Image VisArt® New system possible
– The field emission cathodes which allow generation of high beam currencies necessary to penetrate the chamber gas. – The development of a secondary-electron detector capable of operating in the presence of water vapor. A SEM working at low chamber vacuum (e.g. 1 – 4000 Pa) is called Environmental SEM or ESEM. When comparing different vendors, slight differences in nomenclature become apparent. Pressure ranges between 1 – 50 Pa may be called “Low Vacuum – LV” or “Variable Pressure – VP”, up to 750 Pa “Extended Variable Pressure XVP” and up to 4000 Pa as “Extended Vacuum Mode – ESEM” or “Environmental Pressure – EP”. ESEM can be applied to a broad range of specimens. In contrast to conventional SEM techniques, preparatory steps are not required. Electrostatic charging of the specimens is drastically reduced by the chamber gas which allows neutralization of electric charges of the sample surface by ions in the gas phase. Therefore, the surface does not need to be sputtered. The largely non-destructive nature of ESEM means that specimens can be either re-used for further experiments or studied using complementary techniques such as TEM or confocal microscopy. The region of interest for TEM examination may be selected by the “scanning TEM - STEM” mode. The absence of a coating means that the native surface can be examined. Examples for the application of LV-SEM such as investigation of morphology, attachment and proliferation on biomaterial substrates, examination of bone-implant interfaces are given by Stokes33. Th e tab ul ated ov ervi ew o f sca nni ng ele ctron microscopes presented below (Tables 4 and 5) is in no way exhaustive and focuses on those technologies which may
214
Automation in Toxicologic Pathology
Table 4. Examples of Scanning Electron Microscopes with Field Emission Cathode and Variable Vacuum Name FEI Quanta 400 FEG TESCAN Mira LMU Cathode High-resolution field emission SEM High-resolution field emission SEM High-vacuum: Resolution High-vacuum: 1 nm @ 30 kV - 0.8 nm @ 30 kV (STEM) 3.5 nm @ 3 kV - 1.2 nm @ 30 kV (SE) Low-vacuum: - 2.5 nm @ 30 kV (BSE) 1.5 nm @ 30 kV - 1.0 nm @ 1 kV (SE) Low vacuum: - 1.5 nm @ 30 kV (SE) - 2.5 nm @ 30 kV (BSE) - 1.0 nm @ 1 kV (SE) Extended vacuum mode 1.5 nm @ 30 kV (SE) Acceleration voltage 0.2 – 30 kV 0.5 – 30 kV Probe current Up to 100 nA 2 pA – 40 nA Magnification 7 – 1 000 000 x 4 – 1 000 000 x x-ray analysis 10 mm analytical working distance and 35° take- yes off angle Chamber vacuum Low vacuum: 10 – 130 Pa Low vacuum: 7 – 150 Pa Extended vacuum mode: 10 – 4000 Pa Vacuum system 1 TMP, 2 IGP, 2 R R, TMP SE Detectors SE in all three vacuum modes IR-CCD Solid-state BSED Gaseous (analytical) BSED STEM (optional) Scintillator BSSED/CLD (optional) Chamber 284 mm left to right; 230 mm X = 80 mm 5-axe s mo t or iz ed X = 100 mm Y = 60 mm specimen stage Y = 100 mm Z = 47 mm Z = 60 mm T = –75° to +50° T = –5° to +70° (working distance dependent) R = 360° R = 360° (continuous) Maximum specimen No data available 60 mm height Image framestore Up to 4096 × 3536 pixel Up to 8192 × 8192 pixel Utility requirements 230 V (–6%, +10%), 50 or 60 Hz, power 230 V / 50 Hz or 120 V / 60 Hz, 1.3 consumption < 3.0 kVA for basic microscope, k V A , d r y n i t r o g e n 1 . 5 – 5 b a r, compressed air 4.5 – 6 bar environmental temperature 20°C (+/– 3); Stray AC magnetic fields < 40 nT asynchronous < 300 nT synchronous; Compressed air 4 – 6 bar, clean, dry and oil-free; Web page http://www.fei.com/ http://www.tescan-sa.com/
CamScan Apollo 300 High-resolution field emission SEM No data available
Up to 30 kV No data available 10 – 2 500 000 x No data available Low vacuum: 1 – 150 Pa No data available SE, BSE
415 × 315 mm, 315 mm height, X = 100 mm Y = 100 mm Z = 50 mm T = –20° to +90° R = 360° No data available No data available No data available
http://www.camscan.com/
STEM – Scanning Transmission Electron Microscope; SE – Secondary Electrons; BSE – Back Scattered Electrons; R – Rotation pump; IGP – Ion Getter Pump; TMP – Turbo Molecular Pump
have the highest impact on the examination of biological materials. It will only give a rough overview. It is strongly recommended to supplement this information by visiting the very informative homepages of the vendors as the next step. Technical superiority of one microscope above others does not necessarily mean that it would also be the best choice for every application. Magnification and resolution, for example, are usually only of theoretical interest. Their importance in toxicologic pathology may be limited to very specialized questions which require extremely well preserved samples. Simple features like chamber overview when manipulating the sample or orientating on the sample at low magnification may be of even more importance for the
day-to-day work.
Transmission electron microscopy Significant technical advances have been reached also in transmission electron microscopy. Field emission cathodes and aberration correction of the electron beam have extended the resolution far into sub-nanometer dimensions, combined with high beam currents as required for high resolution analysis. This is of importance for material sciences. For life sciences, however, the introduction of Energy Filtering Transmission Electron Microscopes (EFTEMs) is surely of much higher impact. The same holds true for tomographic imaging, which makes possible three
Germann, Doelemeyer, Kohler et al.
Table 5. Examples of Conventional Scanning Electron Microscopes and Variable Vacuum Name Zeiss EVO LS 25 Hitachi 3700 Ultra Large VP-SEM Cathode Conventional tungsten or LaB6 cathode Variable Quad Bias Circuity with SE accelerator plate High vacuum: Resolution 3.0 nm @ 30 kV (SE and W) 3.0 nm @ 30 kV 2.0 nm @ 30 kV (SE with LaB6 option) Low-vacuum: 4.5 nm @ 30 kV (VP with BSD) 4.0 nm Acceleration voltage 0.2 – 30 kV 0.3 – 30 kV Magnification 5 – 1 000 000 x 5 – 300 000 x Field of view 6 mm at the analytical working distance of No data available 8.5 mm x-ray analysis 8.5 mm analytical working distance and 10 mm analytical working distance 35° take-off angle Chamber vacuum Extended variable pressure: 1 – 750 Pa Low vacuum: Extended vacuum mode: 10 – 3000 Pa 6 – 270 Pa Vacuum system 1 x TMP, 2 IGP, 1 R TMP SE Detectors SE in all three vacuum modes BSE YAG-BSED STEM (optional) No data available Chamber 420 mm diameter, 330 mm height, 8.5 mm analytical working distance X = 150 mm 5-axes motorized specimen X = 125 mm Y = 150 mm stage Y = 125 mm Z = 110 mm Z = 50 mm T = –20° to +90° T = 0° to +90° R = 360° (continuous) Maximum specimen height 250 mm 110 mm Image framestore Up to 3072 × 2304 pixel, signal acquisition No data available by integrating and averaging Utility requirements 100 – 240 V, 50 or 60 Hz, single phase; no no water cooling requirement water cooling requirement Web page http://www.zeiss.com/ http://www.hitachi-hta.com/
215
Jeol JSM 6490 LV Conventional tungsten cathode High vacuum: 3.0 nm Low-vacuum: 4.0 nm 0.3 – 30 kV 5 – 300 000 x No data available 1 0 m m a n al y tic a l w o rk i ng distance and 35° take-off angle No data available No data available SE (signal mixing)
No data available
X = 125 mm Y = 100 mm
Up to 152 mm in diameter No data available No data available http://www.jeol.com/
STEM – Scanning Transmission Electron Microscope; SE – Secondary Electrons; BSE – Back Scattered Electrons; R – Rotation pump; IGP – Ion Getter Pump; TMP – Turbo Molecular Pump
dimensional reconstruction of subcellular structures. Energy filtering transmission electron microscopes (EFTEMs): In both the conventional transmission electron microscope (CTEM) and the EFTEM, the specimen is exposed to monoenergetic electron radiation. As a result of the scattering in the specimen, a polyenergetic electron beam is produced. In CTEM, electrons are selected from the electron beam via the lens aperture diaphragm according to their scatter angles. This angular selection results in scatter or diffraction contrast. The image is formed by all electrons passing the lens aperture diaphragm, in other words with a polyenergetic electron beam. In EFTEM, the transmitted electrons are subjected to an additional energy selection after the angle selection. A specific filter (e.g. OMEGA filter) acts as a spectrometer. This additional electron selection results in contrast enhancement for all imaging modes and also provides the possibility of selecting electrons with specific scattering effects for imaging, thereby generating object or chemical element specific contrasts. Contrary to the CTEM method, the image is formed exclusively by a “monoenergetic” electron beam. The filtering out according to energy and
energy bandwidth does not have an adverse effect on the resolution, unlike smaller lens aperture diaphragms. EFTEM has multiple advantages over CTEM: - Generating of high-contrast images, even from unstained, thin specimens. - Generating of new specimen information from structure and element sensitive contrast. - Reduction of preparatory steps if unstained specimens are used. - Element imaging and comprehensive element analysis with high lateral resolution. Table 6 compares two transmission electron microscopes with specific but different strengths for life science research.
Electronic Image Analysis In Histopathology, imaging techniques have been used for a long time. In early days, paper based photos or slides where utilized to document histological findings. But soon the request for quantitative measurements emerged. Stereological measurements, based on black and white
216
Automation in Toxicologic Pathology
Table 6. Examples of Transmission Electron Microscopes for Use in Life Sciences Name Zeiss LIBRA 120 FEI Tenaci BioTWIN Cathode Conventional LaB6 Illumination system Koehler system Four lenses; user-selectable intensity limit for specimen protection; user-selectable zoom for constant screen intensity Resolution point – point: 0.34 nm Resolution Resolution point – point: 0.34 nm Information limit: < 0.20 nm STEM: < 0.50 nm Acceleration voltage 80 – 120 kV 20 – 120 kV Spectrometer OMEGA No spectrometer Dispersion: 1.17 µm/eV @ 120 kV Energy resolution: