Professor and Extension Engineer. Biosystems and Agricultural Engineering Dept. University of Minnesota. St. Paul, Minnesota, USA. Written for presentation at ...
Paper No. 984053 An ASAE Meeting Presentation
COMPARISON OF BIOFILTER RESIDENCE TIME By R. E. Nicolai Research Fellow Biosystems and Agricultural Engineering Dept. University of Minnesota St. Paul, Minnesota, USA K.A. Janni Professor and Extension Engineer Biosystems and Agricultural Engineering Dept. University of Minnesota St. Paul, Minnesota, USA Written for presentation at the 1998 ASAE Annual International Meeting Sponsored by ASAE Disney’s Coronado Springs Resort Orlando, Florida July 12-16, 1998
Summary: Residence time is a critical factor in determining the size of an open face biofilter. Four test biofilters were constructed with media comprised of yard waste compost and brush chips to compare 8 s. and 4 s. residence time. Biofilter performance was monitored for ten months by measuring pressure drop, moisture content, odor threshold, hydrogen sulfide, and ammonia concentrations. Odor reduction efficiency for the 8 and 4 second residence time biofilters is 91% and 87% respectively. Hydrogen sulfide reduction efficiency is 97% and 96%. Ammonia reduction efficiency is 82% and 74%. There is no significant difference between an 8 s. and a 4 s. empty bed contact time for odor, hydrogen sulfide, and ammonia removal. Based on current information, the design residence time for biofilters on swine buildings is 4 to 5 seconds. Further research is needed to determine the minimum effective residence time for open face biofilters on livestock facilities. Keywords: Biofilters, Biofiltration, Swine, Odor, Hydrogen sulfide, Ammonia
The author(s) is solely responsible for the content of this technical presentation. The technical presentation does not necessarily reflect the official position of ASAE, and its printing and distribution does not constitute an endorsement of views which may be expressed. Technical presentations are not subject to the formal peer review process by ASAE editorial committees; therefore, they are not to be presented as refereed publications. Quotation from this work should state that it is from a presentation made by (name of author) at the (listed) ASAE meeting. EXAMPLE — From Author’s Last Name, Initials. “Title of Presentation." Presented at the Date and Title of meeting, Paper No X. ASAE, 2950 Niles Road, St. Joseph, MI 49085-9659 USA. For information about securing permission to reprint or reproduce a technical presentation, please address inquiries to ASAE. ASAE, 2950 Niles Rd., St. Joseph, MI 49085-9659 USA Voice: 616.429.0300 FAX: 616.429.3852 E-Mail:
1
COMPARISON OF BIOFILTER RETENTION TIME R. E. Nicolai and K. A. Janni Biosystems and Agricultural Engineering Department University of Minnesota, St. Paul, MN
INTRODUCTION Pork production facilities generate odors. Those odors can be a nuisance to rural and urban neighbors near facilities. In a growing number of cases, concerns about odors and potential odors have caused the pork industry to experience governmental restrictions on growth and negative relations between residential neighbors and producers. These restrictions on growth and potential conflicts with neighbors will limit the business opportunities for the pork industry. Most of the odor reduction research in the past has focused on emissions from outside manure storages. One alternative to outside storages is to store manure below slatted barn floors in deep pits. Odors from barns with deep pits as well as barns where the manure is removed are a major part of the total odors coming from a pork production site (Jacobson et al., 1997). Biofilters reduce odor emissions (Janni et al., 1996). Since many biofilter applications are in the industrial market, little information is available for designing low cost systems for agriculture use. Nicolai et al. (1997) developed a low cost biofilter for swine production facilities. Average odor and hydrogen sulfide removal for that design was between 75 and 90 percent. One critical factor in determining biofilter size is the residence time. An indicator of the residence time is empty bed contact time, which is determined by dividing the volume of the empty filter bed by the airflow rate. An 8.8 s. empty bed contact time was used to achieve the odor reduction levels with the Nicolai et al. (1997) design. Zeisig (1987) reported adequate odor reduction could be achieved with 5 s. empty bed contact time. The objectives of this research was to determine the effect different air contact times (4 s. and 8 s.) have on odor, hydrogen sulfide, and ammonia emission.
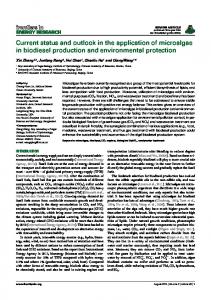
MATERIALS AND METHODS Figure 1 shows the layout of four 5ft. x 7ft. biofilters constructed in September, 1997 next to a 640 head capacity deep pitted nursery barn. An air mixing duct was constructed to receive exhaust air from three 1200 cfm pit fans. Four 250 cfm blowers mounted inside the air mixing duct moved air to each biofilter. Excess air from the pit fans was allowed to exit from one end of the mixing duct. Each biofilter consisted of a 6 in. deep plenum beneath a media support floor. This plenum received air from the blowers in the mixing duct. Two of the four biofilters had 12 in. deep media and two had 6 in. deep media. The empty bed contact time for these two depths is 8 and 4 s. 2
Nursery Barn Wall
Air Mixing Duct
Pit Fans
7'
Blowers inside air duct Air duct to biofilter
Biofilter 12" deep bed
Biofilter 12" deep bed
Biofilter 6" deep bed
5' Biofilter 6" deep bed
Figure 1 Layout of four-cell biofilter. The biofilter media was 50% by weight yard waste compost and 50% brush wood chips. Since these biofilters were the open face type and followed the type of construction developed by Nicolai et al. (1997), they were exposed to Minnesota weather conditions. Biofilter performance was monitored by comparing untreated air samples from each end of the air mixing duct to treated air samples which were collected from beneath a 1 m square flux hood on top of each biofilter. Air samples were analyzed using a dynamic olfactometer to determine odor detection threshold (Nicolai et al., 1997). Hydrogen Sulfide gas concentration was measured with a JeromeTM meter. Ammonia gas concentration was measured with NH3 detector tubes. Air pressure differential on one blower and temperatures of the bed, untreated air, and treated air were continuously recorded on a dataloger system. Moisture content was determined by drying media samples and reported as a percent of dry matter. 1400 1304
Detection Threshold (odor units)
1252 1193
1200
I n le t A ir - B e lo w F ilt e r s E x h a u s t A ir - A b o v e 1 2 " B e d
1147
E x h a u s t A ir - A b o v e 6 " B e d 1028
1000
800
761
727
600
400
336 285 246
2 1 02 2 7
200
155 103
77
49
86
120
106 40 30
27 41
J a n -9 8
M a r-9 8
98 55
41 46
M a y -9 8
J u n -9 8
0 S e p -9 7
O c t- 9 7
N o v -9 7
D e c -9 7
A p r-9 8
D a t e o f s a m p le s
Figure 2 Odor detection thresholds of inlet and exhaust air from 12" and 6" deep biofilters. 3
RESULTS AND DISCUSSION Odor threshold levels Figure 2 shows odor detection threshold levels of air samples from before and after biofilter treatment. Samples were taken over a ten month period from September 1997 until June 1998. Odor levels are reported in odor units, which is the maximum dilutions of the sample air in clean air that will still allow trained odor panelists to detect the presence of an odor. Odor was reduced an average of 91% for the 12 inch deep biofilter and 87% for the 6 inch deep biofilter. The probability of variation in depth was 0.3750 using the nova statistical analysis. Thus, there was no significant difference in odor reduction between the two depths at the 5% level. Odor reduction efficiency improved from 82% to 97% for both biofilter media depths from startup to January. This efficiency increase was expected as the microorganisms, which oxidize the VOC's, multiplied and adapted to their new environment. Odor reduction efficiency for April was less then average (reductions of 84% for the 12 in. biofilter and 68% for the 6 in. biofilter). Warmer and dryer weather conditions during this period caused the biofilter media moisture content to be reduced. Inlet odor values were lower during the summer months as additional wall fans operated, thereby increasing the nursery ventilation rates. Hydrogen Sulfide 2500 2250
E xh a u s t A ir - A b o v e 1 2 " B e d
2000
1875
1850
Hydrogen Sulfide (ppb)
In le t A ir - B e lo w F ilte rs
1875
E xh a u s t A ir - A b o v e 6 " B e d
1700
1500
1090 1025
1000
455
500 295 145 4
25
6
63
54 21
18 23
50 67
19 18
26 25
0 S e p -9 7
O c t-9 7
D e c -9 7
J a n -9 8
M a r-9 8
A p r-9 8
M a y-9 8
J u n -9 8
D a te o f S a m p le
Figure 3 Hydrogen sulfide concentrations of inlet and exhaust air from 12" and 6" deep biofilters. Figure 3 shows hydrogen sulfide concentration through the two different biofilter media depths. Hydrogen sulfide is reported in parts per billion. Hydrogen sulfide emissions were reduced an 4
average of 97% for the 12 in. deep biofilter and 96% for the 6 in. deep biofilter. . The probability of variation in depth was 0.3875 using the nova statistical analysis. Thus, there was no significant difference in hydrogen sulfide reduction between the two media depths at the 5% level. Since the biofilters had lower moisture contents during April the hydrogen sulfide removal efficiency was reduced. Ammonia 30.0
28.5 Inlet Air - Below Filters Exhaust Air - Above 12" Bed
25.0
Exhaust Air - Above 6" Bed
22.5
Ammonia (ppm)
20.0
16.0 15.0
13.5 12.0
10.0
9.0
9.5
9.0 8.0
5.0
5.0 2.8
2.5 1.5
1.0
0.5 0.5
1.0
0.5
0.0 Sep-97
Oct-97
Jan-98
Mar-98
May-98
Jun-98
Date of Sample
Figure 4 Ammonia concentrations of inlet and exhaust air from 12" and 6" deep biofilters. Figure 4 shows ammonia concentration of inlet and exhaust air from the 12 inch and the 6 inch deep biofilters. Ammonia is reported in parts per million. The average ammonia reduction for each biofilter type was 82% for 12 in. and 74% for 6 in.. The probability of variation in depth was 0.1041 using the nova statistical analysis. Thus, there was no significant difference in ammonia reduction between the two depths at the 5% level. Pressure Drop Average pressure drop across the 12 in. biofilters was .045 in. of water and across the 6 in. biofilter it was .025 in. of water. Laboratory pressure tests with this media at 250 cfm air flow rates show the pressure drop per foot of depth to be between .04 and .1 in.
5
Media Moisture Content Moisture content in all biofilters remained above 40% except during April when they were near 30%. No additional water sprinkling was provided for the biofilter. One 6 in. biofilter was covered to prevent moisture addition for one month during June 98. The media dried to 5.25% moisture. This reconfirms Medina et al. (1994) findings that beds with peat or compost media, which tend to hold moisture, will dry out due to high air flow rates. Odor, hydrogen sulfide, and ammonia removal percentages after drying were 75%, 71%, and 33% respectively.
CONCLUSION Significant odor, hydrogen sulfide, and ammonia reduction was achieved by the biofilters. There was no significant difference between an 8 s. and a 4 s. empty bed contact time for odor, hydrogen sulfide, and ammonia removal. Therefore, the recommended empty bed contact time for swine facilities is 4 to 5 s. Further research is needed to determine the minimum effective residence time for open face biofilters on livestock facilities.
REFERENCES Jacobson, L. D., C. Radman, D. R. Schmidt and R. E. Nicolai. 1997. Odor measurements from manure storages on Minnesota Pig Farms. In: Proceedings of the Fifth International Livestock Environment Symposium. ASAE, May 29-31, Bloomington, MN. Janni, K. A., W.J. Maier, E. Tam, T.H. Kuehn, C.H. Yang, D.Vesley, M.A. Nellis, B.B. Bridges. 1996. Evaluation of biofiltration of air, an innovative air pollution control technology, Draft final report. Biosystems and Agricultural engineering, University of Minnesota. Medina, V.F., T.S. Webster, J.S. Devinny. 1994. Biofiltration of gasoline vapors: effects of direct water addition. Submitted for publication. Nicolai, R.E., K.A. Janni. 1997. Development of a Low Cost Biofilter for Swine Production Facilities. Presented August 1997 at the ASAE Annual International Meeting, Paper No. 974040. ASAE, 2950 Niles Road, St. Joseph, MI 49085-9659 USA. Nicolai, R. E., C. J. Clanton, P. R. Goodrich, L. D. Jacobson, K. A. Janni, V.J. Johnson, and E. Lees. 1997. Development of a Dynamic Olfactometer Lab. Presented August 1997 at the ASAE Annual International Meeting, Paper No. 974019. ASAE, 2950 Niles Road, St. Joseph, MI 49085-9659 USA. Zeisig, H. D., and Munchen, T. U. 1987. Experiences with the use of Biofilters to Remove Odours from Piggeries and Hen Houses. In: Volatile Emissions from Livestock Farming and Sewage Operations. eds. V.C. Nielsen, J. H. Voorburg, and P. L’Hermite, pp. 209 216. Elsevier Applied Science Publishers, New York.
6