Curvelet Based Feature Extraction Method for Breast Cancer Diagnosis in Digital Mammogram Mohamed Meselhy Eltoukhy1,*, Ibrahima Faye2, Brahim Belhaouari Samir2 1
Electrical and Electronics Engineering Department, 2 Fundamental and Applied Sciences Department, Universiti Teknologi PETRONAS, Perak, Malaysia. *
[email protected]
Abstract- This paper proposes a method for breast cancer diagnosis in digital mammogram. The article focuses on using texture analysis based on curvelet transform for the classification of tissues. The most discriminative texture features of regions of interest are extracted. Then, a nearest neighbor classifier based on Euclidian distance is constructed. The obtained results calculated using 5-fold cross validation. The approach consists of two steps, detecting the abnormalities and then classifies the abnormalities into benign and malignant tumors.
I.
INTRODUCTION
Breast cancer is the most common cancer among women in Asia. In a few countries in South East Region, it is only second behind cancer of the uterine cervix [1]. More than 1.2 million women are diagnosed with breast cancer annually worldwide [2]. Early detection with extensive screening and modern therapy has great potential to reduce mortality from this disease. Digital Mammography is the gold standard for early detection of breast cancer. It can reduce the mortality of breast cancer by 45% in women above the age of 50 years who have been screened [1]. Digital mammography is a convenient and easy tool in classifying tumors, and many applications in the literature proved its effectiveness in breast cancer diagnosis [3]. Mammogram analysis is needed to identify specific descriptions of regions of interest (ROI). One way to achieve this is to develop features of the image which can be used to classify the image data. The greatest difficulty lies in finding some property of the image from which such features may be extracted. Texture is a commonly used feature in the analysis and interpretation of images. Texture is characterized by a set of statistical properties of pixel intensities. Texture features are calculated using a variety of statistical, structural and spectral techniques including co-occurrence matrices, fractal dimensions and multiresolution techniques such as wavelet and curvelet [4]. Multiresolution allows a preservation of an image according to a certain levels of resolution. It allows as well a zooming in and out on the underlying texture structure. Therefore, the texture extraction is not affected by the size of the pixel neighborhood. Multiresolution analysis has been useful in so many applications from image compression to image de-noising and classification [5, 6]. Several methods using wavelet have been proposed for feature extraction in mammograms. Liu et al. [7]
proved that multiresolution analysis of mammograms improve the effectiveness of the diagnosis system based on wavelets coefficients. In their mammogram analysis study, they use a set of statistical features with binary tree classifier in their diagnosis system to detect the spiculated mass. The achieved successful rate was 84.2%. Mousa et al. [6] proposed system based on wavelet analysis and used the Adaptive Neuro-Fuzzy Inference System (ANFIS) for building the classifier to distinguish between mass and microcalcification, the maximum classification rate obtained was 85.4%. Rashed et al. [8] studied the multiresolution analysis of digital mammogram using wavelet transform. They used Euclidean distance to classify between micro-calcification clusters, spiculated mass, circumscribed mass, ill-defined mass and normal mammogram. The maximum classification rate achieved was 87.06%. Ferreira and Borges [9] proposed system to classify the mammogram images by transforming the images into wavelet bases and then using a sets of coefficients from first level of decomposition as the feature vector toward separating micro-calcification clusters, spiculated mass, circumscribed mass, and normal classes of image. The maximum classification rate achieved was 94.85%. Curvelet was developed by Candes and Donoho [10], for providing efficient representation of smooth objects with discontinuities along curves. Detecting and enhancing the boundaries between different structures is very important in image processing, especially in medical imaging [11]. Some studies using curvelet transform in image processing have been done. Ali et al. [12] presented a curvelet approach for the fusion of Magnetic Resonance (MR) and Computed Tomography (CT) images. They found that curvelet transform achieved good results in their fusion. Bind and Tahan [13] presented a method for object detection of speckle image based on curvelet transform. They constructed a segmentation method which provides a sparse expansion for typical images having smooth contours. Murtagh and Stark [14] used second, third and fourth order moment of Multiresolution transform (wavelet and curvelet) coefficients as features, and K-nearest neighbors supervised classifier for image classification process. Moayedi et al. [15] presented a study of contourlet based mammography mass classification using support vector machine (SVM). In their study, a set of statistical properties of contourlet coefficients from 4 decomposition levels, cooccurrence matrix features and geometrical features is used as
feature vector of ROI. Genetic algorithm was used for feature selection based on neural network pattern classification. They concluded that the contourlet features offer an improvement of the classification process. Eltoukhy et al. [17] presented a study of mammogram classification based on curvelet transform. A fractional amount of the biggest coefficients from each decomposition level is used as feature vector. They proved that multiresolution based analysis achieved interesting results. In this paper we use seven texture features for each wedge in curvelet transform. 5-fold cross validation is used for generalization accuracy. Two main problems are considered: the first is to differentiate between normal and abnormal. The second problem is to distinguish between benign and malignant tumors. II. CURVELET TRANSFORM The discrete curvelet transform was proposed by Candes and Donoho [10], from the idea of representing a curve as superposition of functions of various length and width obeying the curvelet scaling law width ≈ length 2 [10]. Fig. 1 presents the curvelet analysis method. The second generation of curvelet transform is presented in 2
[15]. The work is done throughout in two dimensions, i.e. R with x as spatial variable, ω as frequency domain variable, r and θ as polar coordinates in the frequency domain. A pair of windows W (r ) and V (t ) are defined as the radial window and angular window respectively. These are smooth, nonnegative and real-valued, with W taking positive real arguments and is supported on r ∈ (1 2 ,2) and V taking real
arguments and is supported on t ∈ [− 1,1] . These windows will always obey the admissibility conditions: ∞
∑W
(2 j r ) = 1, r ∈ (3 4, 3 2)
(2.1)
∑V 2 (t − l ) = 1, t ∈ (− 1 2,1 2)
(2.2)
2
j = −∞
∞
l = −∞
For each
j ≥ j0 , a frequency window U j
is defined in the
Fourier domain by
2 ⎣ j 2⎦θ ) (2.3) 2π Where ⎣ j / 2⎦ is the integer part of j 2 . Thus the support of U j is a polar wedge defined by the support of W and V U j (r ,θ ) = 2
3 − j 4
W (2 − j r )V (
and is applied with scale dependent window widths in radial and angular directions. The symmetriezed version of (2.3), namely, U j (r , θ ) + U j (r , θ + π ) is used to obtain real valued curvelet. The waveform
ϕ j (x) is defined by means of its Fourier transform ϕˆ j (ω ) = U j (ω ) . Let U j (ω1, ω 2) be the window defined in the polar coordinate system by (2.3). ϕ j is the mother curvelet in the sense that all curvelet at scale
2 − j are obtained by rotations and translations of ϕ j . A
sequence of translation parameters k
θ l = 2π .2 − ⎣ j / 2 ⎦.l that 0 ≤ θ ≤ 2π
Rotation angles
l = 0,1,2... such consecutive
angles
is
= (k1 , k 2 ) ∈ Z 2 and are introduced, with
(the spacing between scale-dependent). The curvelet
functions are functions of x = ( x1 , x 2 ) defined at scale 2 orientation angle
x
( j ,l ) k
θl
,
and position
−1
= Rθl (k1 .2 − j , k 2 .2 − j 2 ) by
ϕ j ,l ,k ( x) = ϕ j ( Rθ ( x − x k( j ,l ) ))
(2.4)
l
where
−j
−1
Rθ is the rotation by θ radians and Rθ is its
inverse,
⎛ cos θ Rθ = ⎜⎜ ⎝ − sin θ
sin θ ⎞ ⎟, cos θ ⎟⎠
Rθ−1 = RθT = R−θ .
A curvelet coefficient is the inner product of an element
f ∈ L2 ( R 2 ) and a curvelet ϕ j ,l , k , c( j, l , k ) :=
∫ f ( x)ϕ
j ,l , k
( x)dx
(2.5)
R2
Curvelet transform obeys an anisotropy scaling relation,
length ≈ 2 − j 2 ,
width = 2 − j ,
such
that
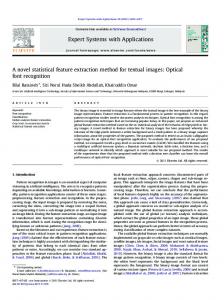
width ≈ length . Fast digital curvelet transform can be implemented via two methods, using unequispaced FFTs or using wrapping [15]. In this study, the method of unequispaced FFTs is used. 2
III. Figure 1. Curvelet tiling in the frequency domain, wedge samples are shaded.
EXPERIMENTAL WORK
In the present study, a set of images provided by the Mammographic Image Analysis Society (MIAS) dataset is used in applying the proposed method. The images were
previously investigated and labeled by expert radiologists. This dataset is selected according to the various cases it includes. It is also widely used in similar research work. This dataset is composed of 322 mammograms of right and left breast, from 161 patients, where 51 were diagnosed as malignant, 64 as benign and 207 as normal. The abnormalities are classified into microcalcification, circumscribed mass, ill defined mass, spiculated mass, architecture distortion, and asymmetry. This dataset is described in Table I. The original mammograms are 1024 x 1024 pixels, and almost 50% of the image comprised of the background with lot of noise. A manual cropping is applied to the images to cut off the unwanted portions. Thus, almost all the background information and most of the noise are eliminated. The ROI’s 128x128 are cropped, where the given centers of the abnormality areas were selected to be the centers of ROI’s. The dataset was divided into two groups. The first is used to calculate the extracted feature and construct the classifier. The second group is used to test the proposed method. Once the images are cropped as described, the curvelet transform is applied on ROI. Then seven statistical properties for each wedge are calculated. These properties are described in appendix A. In this study, curvelet is used with scale 4 and 16 angle, i.e. the ROI is decomposed into 81 wedges, and the features are calculated for each wedge, so that a total of 567 features are calculated to form a features vector. The most significant features are obtained by passing the features vectors to a feature selection method as in [18]. The method starts with calculating a mean features vector for each class. After that the standard deviation vector between the different means is calculated. A hard threshold is then applied on this standard deviation vector. The remaining feature will be the features vector for the corresponding ROI. These selected features are used to classify between different classes. The number of features obtained after applying the feature selection method is presented in Table II. In the classification level two main problems are covered, the first is to distinguish between normal and abnormal, the second is to classify the abnormalities into benign or malignant. The classification step is performed using a nearest neighbor classifier. The classifier uses the Euclidian distance as a measurement between the correspondent coefficients. For each class, a set m of images are used to build the class core vector and each entry of the class core vector is calculated using: i Vcore =
1 j =m i ∑V j m j =1
where i = 1, 2, . .., L .
TABLE I. THE DISTRIBUTION OF THE MIAS DATASET. Class
Benign
Malignant
Total
Microcalcification
12
13
25
Circumscribed mass
19
4
23
Ill-defined mass
7
7
14
Spiculated mass
11
8
19
Architectural
9
10
19
Asymmetry
6
9
15
Normal
-
-
207
64
51
322
Total
TABLE II: THE OBTAINED FEATURES BEFORE AND AFTER FEATURE SELECTION METHOD APPLIED Function
Total Features Before Feature Selection
Total Features After Feature Selection
Normal& Abnormal
567
220
Benign &Malignant
567
222
Mammogram Image
Feature Selection
Image Crop
Feature Vector
ROI
Curvelet Transform
Texture Features Texture Features … … Texture Features
Wedge 1 Wedge 1 … … … Wedge 81
Nearest Neighbor
(3.1)
Abnormal
Normal
Then the remaining images are classified by calculating the distance between the tested image and the class core vectors
Dist =
L
∑ (V i =1
i core
i − Vtest )2
(3.2)
The system automatically classifies the tested image in the class for which the distance obtained is the smallest. The description of the proposed method is presented in Fig. 2.
Benign
Malignant
Figure 2. The proposed method for mammogram classification
IV. RESULTS AND DISCUSSIONS
REFERENCES
Curvelet transform is used as a multi-scale level decomposition to represent mammogram images. The calculated texture features are used as feature vector of the corresponding mammogram. Table III shows the successful classification rate of mammogram images with the overall classification accuracy based on 5-fold cross validation. The average rate for each fold is calculated then the average for 5-folds is calculated. It shows that, the successful classification rate of mammogram images for normal and abnormal using nearest neighbor classifier reached to 99.03% in fold 4, while the average classification rate achieved for all folds is 97.03%. For the second step, the classification rates of the abnormalities of 5-fold cross validation are listed in Table IV. The average rate for each fold is calculated then the average for 5-folds is calculated is calculated. Table IV shows that, the average successful classification rate for both classes reaches to 95.10% in fold 4, while the average classification rate achieved for all folds is 91.68%. It can be concluded that the results show that the proposed method is able to find an appropriate feature set that lead to significant improvement in classification accuracy. We believe that the high successful classification rate achieved is a result of using curvelet transform. This supports the claim that curvelet transform provide stable, efficient and near-optimal representation of smooth objects having discontinuities along smooth curves.
[1] [2] [3]
V. CONCLUSION
[13]
[4]
[5]
[6]
[7]
[8]
[9]
[10]
[11] [12]
Breast cancer diagnosis using digital mammogram is a practical field of investigation. The positive results could affect the mortality ratio of human life. In this paper, a new model is proposed by using a curvelet transform as a per-process for feature extraction and classification of mammogram images. Curvelet based texture features yielded high accuracy rate to classify mammogram images. This was expected since the curvelet transform is able to capture the multi-dimensional features in wedges. The proposed system covers two problems: the first is abnormality detection. And the Second is to distinguish the abnormal tissues into between benign and malignant. The classification accuracy rate achieved to distinguish between normal and abnormal is 97.03%, while it is 91.68% to distinguish between benign and malignant. These results indicate that using curvelet based texture feature can improve the classification of mammogram.
[14]
[15] [16]
[17]
[18]
www.searo.who.int/LinkFiles/RD_Speech9Feb2008.pdf http://www.emro.who.int/ncd/cancer_breast.htm [May 2009] H.D. Cheng, X. Cia, X. Chen, L.H. Lou. Computer–aided detection and classification of microcalcification in mammogram: a survey. Pattern Recognition Letters 36, pp.2967-2991. 2003 L. Dettori, L. Semler. A comparison of wavelet, ridgelet and curvelet based texture classification algorithms in computed tomography. Computers in Biology and Medicine 37, pp. 486-498, 2007. S.G. Mallat, A theory for multiresolution signal decomposition: the wavelet representation. IEEE Transactions on Pattern Analysis and Machine Intelligence Vol. 7, No. 11: pp. 674–93, 1989. R. Mousa, Q. Munib, A. Moussa, Breast cancer diagnosis system based on wavelet analysis and fuzzy-neural, Expert Systems with Applications 28, pp. 713–723, 2005. S. Liu, C.F. Babbs, E.J. Delp, Multiresolution detection of spiculated lesions in digital mammograms, IEEE Transactions on Image Processing 10 (6),pp. 874–884, 2001. E.A. Rashed, I.A. Ismail, S.I. Zaki, Multiresolution mammogram analysis in multilevel decomposition, Pattern Recognition Letters 28, pp. 286–292, 2007. C.B.R. Ferreira, D.L. Borges. “Analyses of mammogram classification using a wavelet transform decomposition”. Pattern Recognition Letters 24, 2003, pp. 973–982. E.J. Candes, D.L. Donoho, Curvelets, multiresolution representation, and scaling laws, Wavelet Applications in Signal and Image Processing VIII, A. Aldroubi, A. F. Laine, M. A. Unser eds., Proc. SPIE 4119, 2000. K.P. Soman, K.I. Ramachandran ,”Insight into Wavelets: From Theory to Practice”, Second Edition, Prentice-Hall, 2006. F. E. Ali, I.M. El-Dokany, A.A. Saad, F.E. Abd El-Samie, Curvelet fusion of MR and CT images. Progress in Electromagnitics Research C, Vol. 3, pp. 215-224, 2008. N.T. Binh, N.C. Thanh, Object detection of speckle image base on curvelet transform, ARPN Journal of Engineering and Applied Sciences Vol. 2, No. 3, 14-16, (2007). F. Murtagh, J. Starck, Wavelet and curvelet moments for image classification: Application to aggregate mixture grading, Pattern Recognition Letters 29, pp. 1557 –1564, 2008. E. J. Candes, L. Demanet, D.L. Donoho, L. Ying, Fast discrete curvelet transforms. Multiscale Model. Simul., 5, pp. 861-899, 2006. F. Moayedi, ,Z. Azimifar, , R.Boostani, S. Katebi, Contourlet based mammography mass classification. Lecture Notes in Computer Science 4633, pp. 923–934, 2007. M.M. Eltoukhy, I. Faye, S.B. Belhaouari, Breast cancer diagnosis in digital mammogram using multiscale curvelet transform . Computerized Medical Imaging and Graphics, doi:10.1016/j.compmedimag.2009.11.002. In press. 2009. I. Faye, B.B, Samir, M.M, Eltoukhy, Digital mammograms classification using a wavelet based feature extraction method, Proceeding (ICCEE2009) Dubai,UAE, December 28-30, 2009. IEEE, Catalogue Number 09PR3925, CFP0949I-PRT, December 2009.
TABLE III. SUCCESSFUL CLASSIFICATION RATES FOR NORMAL AND ABNORMAL. Class
Fold 1
Fold 2
Fold 3
Fold 4
Fold 5
Average
Normal
100.00
100.00
97.10
98.07
86.47
96.33
Abnormal
95.65
93.04
100.00
100.00
100.00
97.74
Average
97.83
96.52
98.55
99.03
93.24
97.03
TABLE IV. SUCCESSFUL CLASSIFICATION RATES FOR BENIGN AND MALIGNANT. Class
Fold 1
Fold 2
Fold 3
Fold 4
Fold 5
Average
Benign
87.50
81.25
76.56
100.00
81.25
85.31
Malignant
100.00
100.00
100.00
90.20
100.00
98.04
Average
93.75
90.63
88.28
95.10
90.63
91.68
APPENDIX A
Energy
Entropy
Mean
STD
Max Probability
∑M ∑N P i, j
∑M ∑N P i, j log P i, j
∑M ∑N P i, j
∑ P i, j
P i, j
M, N MAX P i, j i, j
Inverse Difference Moment
∑M ∑N
Homogeneity
∑M ∑N
P , |
|
P ,
where i
j