The Journal of Molecular Diagnostics, Vol. 13, No. 2, March 2011 Copyright © 2011 American Society for Investigative Pathology and the Association for Molecular Pathology. Published by Elsevier Inc. All rights reserved. DOI: 10.1016/j.jmoldx.2010.10.001
Custom Design of a GeXP Multiplexed Assay Used to Assess Expression Profiles of Inflammatory Gene Targets in Normal Colon, Polyp, and Tumor Tissue
Janice E. Drew,* Claus-Dieter Mayer,† Andrew J. Farquharson,* Pauline Young,‡ and Lawrence N. Barrera* From the Division of Gut Health,* Biomathematics & Statistics Scotland, BioSS Office,† and the Genomics Unit,‡ Rowett Institute of Nutrition and Health, University of Aberdeen, Aberdeen, Scotland
Colon cancers are characterized by aberrant gene expression signatures associated with disease initiation and progression. Identification of aberrant gene expression associated with colon carcinogenesis has increased significantly with application of gene array technologies. Downstream processing of these data has been hindered by the lack of robust multiplexed gene quantitative technologies facilitating study of the identified multiple gene targets. The GenomeLab Genetic Analysis System presents a novel technology platform for quantitative multiplexed gene expression analysis. This report describes the custom design of a GeXP multiplexed assay used to assess expression profiles of 14 inflammatory gene targets in normal, polyp, and tumor tissue. Characteristic normal, polyp, and tumor tissue gene expression profiles were obtained. Statistical analysis confirmed comparable relative quantitation of gene expression using the GeXP, macroarray, and single-plex real-time polymerase chain reaction assays. GeXP assays may be usefully applied in clinical and regulatory studies of multiple gene targets. This system permits customdesign options for relative quantification of multiple gene target expression, simultaneously in a single reaction, using nanogram quantities of total RNA template. The system provides an approach to advance the study of multiple targets identified from gene array analysis with potential for characterizing gene expression signatures in clinical diagnostics. ( J Mol
human cancers.1– 4 Such studies have revealed novel gene targets and signaling pathways that are currently being investigated as markers of disease and as therapeutic and chemopreventive targets.3,4 It has become clear from these studies that the multifaceted aberrant gene expression in cancerous tissue will require parallel investigation of multiple gene targets to permit pathological characterization and to investigate and assess therapeutic and chemopreventive strategies. This presents a major stumbling block to progress. Verification of gene array–identified transcripts using quantitative real-time PCR is time consuming, laborious, and expensive. Real-time PCR is often used to validate each gene identified by array analysis in single-plex reactions.5 This may result in several gene targets of interest being validated for further study. However, the persistent technical difficulties presented by multiplexed, quantitative, real-time PCR limit further analysis of multiple gene targets.6,7 This presents a dilemma as to which validated gene targets should be selected as a priority for downstream analysis of gene regulation, characterization of gene signatures in diseased tissue, and responses to therapeutics. Restricting analysis to a selected individual gene target excludes the benefits of potentially instructive and insightful analysis by studying multiple targets in parallel. The GenomeLab GeXP Genetic Analysis System (Beckman Coulter, Brea, CA) provides an alternative technology for medium-throughput multiplexed quantitative gene expression.8 –11 Consequently, the GenomeLab GeXP technology was applied here to custom design an inflammatory cytokine multiplex of gene targets associated with early events in colon carcinogenesis. The selected targets were identified in our laboratory by a gene array study of inflammatory cytokine expression in human normal, polyp, and tumor tissue corroborated by singleplex, quantitative, real-time PCR.12 A number of the gene targets selected are associated with inflammation in the
Diagn 2011, 13:233–242; DOI: 10.1016/j.jmoldx.2010.10.001) This work was supported by the Scottish Government. Accepted for publication October 25, 2010.
Colon cancer is a multifactorial disease characterized by aberrant regulation of gene expression. Recent application of gene array technologies has facilitated highthroughput screening to investigate the aberrant gene expression implicated in the complex pathogenesis of
Supplemental material for this article can be found at http://jmd. amjpathol.org or at doi:10.1016/j.jmoldx.2010.10.001. Address reprint requests to Janice E. Drew, Ph.D., Gut Health, Rowett Institute of Nutrition and Health, University of Aberdeen, Greenburn Road, Bucksburn, Aberdeen, United Kingdom. E-mail:
[email protected].
233
234 Drew et al JMD March 2011, Vol. 13, No. 2
Table 1.
Colon Biopsy Specimens
Tissue ID
Age (years)
Sex
671N 671P 671T 685N 685P 685T 698N 698P 698T 705N 705P 705T 748N 748P 748T 798N 798P 798T 847N 847P 847T
73
M
65 55 79 71 75 70
Adenoma
Histology
Polyp size (cm)/cancer stage
Sigmoid Sigmoid
Adenoma confirmed Mod diff adenocarcinoma
1.0 Dukes C1
Rectal Rectal
Adenoma Mod diff adenocarcinoma
1.0 Dukes C1
Sigmoid Rectal
Adenoma Mod diff adenocarcinoma
2.0 Dukes C1
Asc colon Cecum
Adenoma Mod diff adenocarcinoma
0.9 Dukes B
Asc colon Cecum
Adenoma Mod diff adenocarcinoma
N/A Dukes C1
Sigmoid Rectum
Adenoma Mod diff adenocarcinoma
1.5 Dukes B
Asc colon Hepatic flexure
Adenoma Mod diff adenocarcinoma
0.6 Dukes A
M M F M F M
N, normal; P, polyp; T, tumor; M, male; F, female; Mod diff, moderately differentiated; Asc, ascending; N/A, not available.
gut and have been reported to show altered expression in colon tumor tissue.13–17 Inflammation is widely recognized as a component of cancer, with inflammatory bowel diseases known to lead to increased risk of colon carcinogenesis.18,19 Hence, gastrointestinal inflammatory signaling pathways and their regulation present key targets for prevention and therapeutic intervention. Consequently, 14 inflammatory cytokine signaling pathway targets were selected from these studies for further investigation using the GenomeLab GeXP Genetic Analysis System (Beckman Coulter). This report describes the development and evaluation of an in-house custom-designed GeXP assay of the identified inflammatory gene targets associated with colon carcinogenesis that can be applied to clinical and regulatory studies.
Materials and Methods Colon Biopsy Specimens and Total RNA Extraction Colectomy specimens were kindly donated by the Aberdeen colorectal tumor bank, described previously.20 Colectomy specimens were obtained from patients (n ⫽ 7) undergoing surgical colectomy as treatment for colorectal adenocarcinoma and examined histologically to confirm normal colonic mucosa, adenomatous polyp, and colonic adenocarcinoma (Table 1). Tissues were snap-frozen in liquid nitrogen and stored at ⫺80°C until use. Tissues representative of each stage of normal colonic mucosa, adenomatous polyp, and colonic adenocarcinoma were selected for gene expression analysis (Table 1). Approximately 10 mg of each colon specimen was RNA extracted using an RNeasy Mini Kit (Qiagen, Crawley, UK), incorporating a DNase digestion. All of the extracted RNA samples were analyzed using the Agilent
Bioanalyser (Agilent Technologies, Bracknell, UK). Quantitation for downstream processing was assessed using a Nanodrop spectrophotometer (Nanodrop Technologies, Wilmington, DE).
Custom Design of a Multiplex GeXP Assay of Inflammatory Gene Targets, the hInflamPlex Fourteen gene targets (Table 2) were selected for multiplexing from a study conducted previously to identify inflammatory gene targets associated with early events in colon carcinogenesis.12 The gene targets were identified using an inflammatory cytokine–targeted macroarray (Oligo-GEArray gene filter, Human Inflammatory Cytokines and Receptors, OHS-011, Superarray Bioscience, Frederick, MD), followed by single-plex SYBR real-time PCR assays using RNA extracted from human normal colon, polyp, and tumor biopsy samples12 (see Supplemental Tables S1–S3 at http://jmd.amjpathol.org/). The gene target accession numbers were loaded into the Genome Lab GeXP database, together with reference genes [glyceraldehyde-3-phosphate dehydrogenase (GAPDH) and beta-2-microglobulin (B2M)] to design suitable gene-specific primers for reverse transcription and PCR amplification (see Table 2) using GenomeLab eXpress Designer GeXP Software (Beckman Coulter). Subsequently, a custom-designed multiplex GeXP assay of the 14 gene targets, the hInflamPlex, was created. Reverse transcription and reverse PCR primers were designed with a 3= gene-specific sequence and a 5= end consisting of 19 bases of universal priming sequence. The forward PCR primers were designed with a 3= gene-specific sequence and a 5= end consisting of a different 18-nucleotide universal priming sequence. The gene-specific primers were designed to generate PCR amplicons that differ in size by 4 to 7 bp, ranging in size from 137 bp to 325 bp (Table 2). The 14 gene targets
Inflammatory Cancer Gene Multiplex Assay 235 JMD March 2011, Vol. 13, No. 2
Table 2.
Genes and Primers Used in the GeXP hInflamPlex Multiplex RT-PCR
Gene ID
Symbol
Forward primer
Reverse primer
NM_004591 NM_002090 NM_002046 NM_001065 NM_001511 NM_002985 NM_005409 NM_002989 NM_002089 NM_005064 NM_000628 NM_002619 NM_000577 NM_000584 NM_004048 NM_006274
CCL20 CXCL3 GAPDH TNFRSF1A CXCL1 CCL5 CXCL11 CCL21 CXCL2 CCL23 IL10RB CXCL4 IL1RN IL8 B2 mol/L CCL19 Kan(r)
5=GTGTGCGCAAATCCAAAAC-3= 5=CCCCATGGTTCAGAAAATCA-3= 5=CTCTCTGCTCCTCCTGTTCG-3= 5=GGGTTATTGGACTGGTCCCT-3= 5=ATTCACCCCAAGAACATCCA-3= 5=TCCTCATTGCTACTGCCCTC-3= 5=GCAAAGCTGAAGTAGCAGCA-3= 5=CAGAGCTATGTGCAGACCCA-3= 5=TCGCCCATGGTTAAGAAAAT-3= 5=ATGACCCTTTCTCATGCTGC-3= 5=GTCTGTGAGCAAACAACCCA-3= 5=GTGTGAAGACCACCTCCCAG-3= 5=GGAAGATGTGCCTGTCCTGT-3= 5=CTGCGCCAACACAGAAATTA-3= 5=AGGCTATCCAGCGTACTCCA-3= 5=AGGACCTCAGCCAAGATGAA-3= 5=ATCATCAGCATTGCATTCGATTCCTGTTTG-3=
5=TTCCATTCCAGAAAAGCCAC-3= 5=ACCCTGCAGGAAGTGTCAAT-3= 5=ACGACCAAATCCGTTGACTC-3= 5=GTTCCTTTGTGGCACTTGGT-3= 5=TTAACTATGGGGGATGCAGG-3= 5=GAGCACTTGCCACTGGTGTA-3= 5=ATGCAAAGACAGCGTCCTCT-3= 5=TCAGTCCTCTTGCAGCCTTT-3= 5=TCAAACACATTAGGCGCAAG-3= 5=CTTATCACTGGGGTTGGCAC-3= 5=TGGCCCAAAAACTCTTTCAG-3= 5=AAATGCACACACGTAGGCAG-3= 5=CCTTCGTCAGGCATATTGGT-3= 5=ATTGCATCTGGCAACCCTAC-3= 5=CGGCAGGCATACTCATCTTT-3= 5=GTAAACACCAGGCGGCTTTA-3= 5=ATTCCGACTCGTCCAACATC-3=
were incorporated, together with three reference genes that included GAPDH and B2M (both used previously as reference genes for normalization and calculation of fold changes in single-plex real-time PCR assay of the gene targets)12 (see Supplemental Tables S2 and S3 at http://jmd.amjpathol.org) and an external synthetic reference control transcript Kan (supplied with the GeXP assay kit, Beckman Coulter) used to spike each reaction. Two reference genes were selected for normalization as recommended for relative quantitative gene expression analysis.21,22 Primer sequences were evaluated using BLAST searches to ensure specific amplification of the designed PCR fragments. User-defined regions of the listed sequences were selected for primer design where targets were known to be members of a gene family to exclude homologous regions likely to cause mispriming and aberrant amplification. Reverse-phase purified primers with universal sequences were purchased from Sigma-Aldrich (Gillingham, Dorset, UK).
Optimization of the GeXP hInflamPlex Assay The hInflamPlex was initially optimized using a mixture of normal, polyp, and tumor biopsy total RNA (1:1:1) to test individual primer pairs in single-plex GeXP PCR to ensure a single amplicon of the correct size was generated for each of the designed primer pairs. Subsequent optimization of the hInflamPlex incorporating multiplexed primer pairs was conducted on the 1:1:1 total RNA mix and also using individual normal, polyp, and tumor templates to characterize primer products obtained in multiplex reactions. No template and no reverse-transcriptase controls were conducted to ensure the absence of nonspecific reaction products. Total RNA (100 ng) was reverse transcribed using the hInflamPlex primer mix and the Genome Lab GeXP Start Kit (Beckman Coulter) according to the manufacturer’s instructions. Briefly, a master mix of reagents was prepared for reverse-transcription reactions conducted in 96-well plate format as detailed in the GeXP Start Kit
Product Reverse size with primer universals (nM) 137 144 151 158 165 179 186 200 215 223 231 243 269 275 284 316 325
500 500 3.9 500 500 500 500 1000 1000 1000 500 500 500 500 3.9 1000 500
(Beckman Coulter) instructions using 100 ng total RNA per well. Reverse transcription was performed using a GStorm GS1 PCR cycler (Genetic Research Instrumentation, Braintree, Esses, UK) and the reaction program protocol as detailed in the GeXP Start Kit instructions: 48°C for 1 minute, 37°C for 5 minutes, 42°C for 60 minutes, 95°C for 5 minutes, and then 4°C hold. An aliquot (9.3 L) of each reversetranscription reaction was transferred to a new 96-well PCR plate (Abgene, Epsom, UK) and PCR amplified with addition of Genome Lab kit PCR master mix prepared according to the manufacturer’s instructions with addition of Abgene Thermo-Start TaqDNA polymerase (3.5 U/well). The master mix incorporates the gene-specific forward primers, together with a fluorescently labeled universal forward primer and unlabeled universal reverse primer. PCR was performed using a G-Storm GS1 PCR cycler and reaction program as detailed in Beckman Coulter’s GeXP Start Kit protocol: 95°C for 10 minutes, followed by 40 cycles of 94°C for 30 seconds, 55°C for 30 seconds, 68°C for 1 minute, and then 4°C hold. The PCR products then were prepared for fragment analysis using the Beckman Coulter CEQ 8000 GeXP Genetic Analysis system. An aliquot of PCR reaction (2 L) was diluted 1:1 with 2 L 10 mmol/L Tris pH 8.0 and 2 L of this mixture was added to 37.6 L of sample loading solution and 0.4 L CEQ DNA Size Standard 400 (Beckman Coulter), giving a final dilution of 1:40. The samples were mixed and placed in a 96-well CEQ electrophoresis plate and inserted into the GeXP Genetic Analysis System for capillary electrophoresis and fragment separation of amplicons using conditions as follows: capillary temperature of 50°C, denaturation at 90°C for 120 seconds, injection for 30 seconds at 2 kV, and separation at 6 kV for 40 minutes. Next, a size fragment analysis was conducted using the fragment analysis module of the GenomeLab GeXP system software to generate electropherograms representing the electrophoresed and separated fragments generated by GeXP eXpress Profiling. The raw data were filtered to quality check data using the exclusion filter criteria recommended by the manufacturers. A visual
236 Drew et al JMD March 2011, Vol. 13, No. 2
inspection of each sample was conducted to ensure absence of unexpected peaks and that all signal peaks were clearly defined. A size exclusion filter appropriate for the custom-designed hInflamPlex then was applied to detect signal peaks corresponding to the expected size fragments. The generated fragment data, peak heights, and peak areas then were assessed and imported into the eXpress Analysis module to associate the experimental fragment sizes of CEQ analyzed reactions with corresponding gene information associated with the customdesigned hInflamPlex. GeXP eXpress Analysis software was used to perform peak binning and normalize peak area values against the incorporated reference genes (B2M and GAPDH). Both B2M and GAPDH have been used in previous gene expression analysis studies because these transcripts previously were shown to have no significant variation of expression in a macroarray analysis of total RNA extracted from normal, polyp, or tumor colon specimens12 (see Supplemental Table S1 at http://jmd.amjpathol.org). Attenuation of signals beyond the linear range was achieved by reducing reverseprimer concentration according to the manufacturer’s instructions. Primer concentrations used in optimized multiplex are listed (Table 2).
hInflamPlex Quantitative Gene Expression Profiling of Colon Biopsy Tissues The hInflamPlex then was applied to total RNA (100 ng in triplicate) extracted from matched human normal colon, polyp, and tumor (n ⫽ 7) (Table 1) tissue used in the previous expression analysis studies using macroarray (see Supplemental Table S1 at http://jmd.amjpathol.org) and real-time PCR (see Supplemental Tables S2 and S3 at http://jmd.amjpathol.org). Reactions were conducted and analyzed as described earlier. Raw data were exported using the GenomeLab express analysis bygene export option and normalized to each of the reference genes, GAPDH and B2M, incorporated in the multiplex. The quantitative gene expression profiles generated by hInflamPlex assay were measured.
assay of total RNA extracted from the same normal colon and polyp biopsy samples (Table 1). To avoid unnecessary complexity, detailed statistical comparisons were focused on normal versus polyp for comparative study of the technologies. Because both real-time PCR and GeXP data are available normalized to two different reference genes (GAPDH and B2M) we have five different data sets (macroarray data, GAPDHnormalized real-time PCR data, B2M-normalized realtime data, GAPDH-normalized GeXP data, and B2M-normalized GeXP data) with 14 data points (a normal and polyp biopsy sample for each of seven patients for each of 14 genes). Comparable with the macroarray (see Supplemental Table S1 at http://jmd.amjpathol.org) and realtime PCR data (see Supplemental Tables S2 and S3 at http://jmd.amjpathol.org), gene expression intensities were log-transformed also for the GeXP data (see Supplemental Tables S4 and S5 at http://jmd.amjpathol.org). Two types of analyses were conducted. The first of these tested for differences between the biopsy sample types (normal and polyp) within each patient for each single gene separately. The free statistical programming language R was used for all analyses and a paired t-test was applied for each gene in each data set to obtain five sets of P values for the aforementioned five sets of gene expression data. These values then were compared across technologies and reference genes. The overall correlation (Pearson’s correlation coefficient) between the different types of gene expression measurement for all genes also was calculated. In addition to the univariate approach, a multivariate method was used to study the overall information obtained from GeXP data. Principal Component Analysis (PCA) was performed on all of the patients for both GAPDH and B2M normalized samples to study whether the observed GeXP assay expression patterns were as well suited to detect the differences between sample types as the previously studied real-time PCR technology.
Results
Statistical Analysis
Design and Optimization of the Multiplex GeXP hInflamPlex
Gene expression of normal, polyp, and tumor tissues was assayed using the hInflamPlex. Significantly altered gene expression in polyp or tumor samples compared to normal tissue measured then was calculated using a paired t-test. Validation of hInflamPlex data (see Supplemental Tables S4 and S5 at http://jmd.amjpathol.org) against other technology platforms was assessed by conducting statistical analysis of the corresponding relative quantitative gene expression data obtained by inflammatory cytokine– targeted macroarray (Oligo-GEArray gene filter, Human Inflammatory Cytokines and Receptors, OHS-011, Superarray Bioscience) (see Supplemental Table S1 at http:// jmd.amjpathol.org) and single-plex SYBR real-time PCR assays (see Supplemental Tables S2 and S3 at http:// jmd.amjpathol.org). All of the data were obtained from
Each gene-specific primer pair was initially tested in a single-plex reaction. This determined that a single peak of the expected size was generated, with no spurious fragments produced. A multiplex primer mix of selected gene-specific primers, the hInflamPlex (Table 2), then was prepared for multiplex analysis. Several gene targets yielded low signal peaks in the multiplexed GeXP assay. Hence, gene-specific reverse-primer concentrations were increased to improve detection in multiplex reactions (Table 2). Conversely, GAPDH and B2M approached the upper limits of linearity for accurate quantitation by the GeXP system. Consequently, attenuation was performed to reduce peak intensity by reducing gene-specific reverse-primer concentrations (Table 2). Selected primer concentrations giving optimal signal detection of the gene panel are listed in Table 2. Further attenuation
Inflammatory Cancer Gene Multiplex Assay 237 JMD March 2011, Vol. 13, No. 2
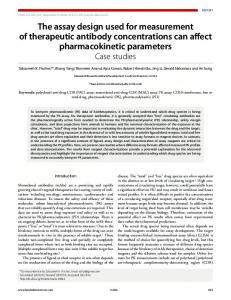
Figure 1. Electropherograms showing quantitative multiplex GeXP-PCR of human colon using custom designed hInflamPlex. The sizes of detected amplicons in hInflamPlex assay of normal (A), polyp (B), and tumor (C) are shown. See Table 1 for a comprehensive list of fragment sizes of amplicons in hInflamPlex.
was limited by the fact that high signal peaks in normal tissue are often low or undetectable in polyp and tumor tissues (Figure 1). Conversely, high signal peaks in polyp and tumor tissues are often low or undetectable in normal tissue. Other expected signal peaks occasionally absent from specific biopsy types corresponded to targets observed as down-regulated in that particular biopsy type. These targets also yielded low amplification levels using real-time PCR as typified by Ct values greater than 35 cycles.
hInflamPlex Gene Expression Profiling of Inflammatory Gene Targets in Normal, Polyp, and Tumor Tissue The GeXP hInflamPlex custom-designed assay was performed on total RNA extracted from human normal colon, polyp, and tumor biopsy samples (Figure 1). GeXP hInflamPlex data were normalized to two reference genes, GAPDH (Figure 2A) and B2M (Figure 2B), as advocated for relative quantitation of gene expression to calculate relative fold changes.21,22 Normalized
data are provided in Supplemental Tables S4 and S5 (http://jmd.amjpathol.org). GAPDH normalized GeXP hInflamPlex assay revealed significantly altered (P ⬍ 0.05) gene expression of 12 targets in polyp compared to normal tissue, chemokine (C-C) motif ligand (CCL) 5, CCL19, CCL21, CCL23, IL10RB, tumor necrosis factor superfamily 1A (TNFRSF1A), chemokine (C-X-C) motif ligand (CXCL1), CXCL2, CXCL3, CXCL4, IL8, and CXCL11 (Figure 2A). GAPDH normalized hInflamPlex data indicate up-regulation of ILRN and CCL20 in polyp compared to normal tissue, but this was not significant (P ⬎ 0.05) (Table 3). GAPDH normalized GeXP hInflamPlex assay revealed significantly altered (P ⬍ 0.05) gene expression of eight targets in tumor compared to normal tissue, CCL5, CCL23, IL10RB, TNFRSF1A, CXCL1, CXCL2, CXCL3, and IL8 (Figure 2A). CCL20, CXCL11, and CXCL4 were not altered significantly. B2M-normalized hInflamPlex gene expression data indicated fewer gene targets were altered significantly in comparison with GAPDH normalized data. B2M-normalized GeXP hInflamPlex assay revealed significantly altered (P ⬍ 0.05) gene expression of 10 targets in polyps compared to normal tissue, CCL21, CCL23, IL10RB, CCL20, CXCL1, CXCL2, CXCL3, CXCL4, IL8, and CXCL11 (Figure 2B). CCL5, CCL19, and TNFRSF1A were down-regulated in polyps, but this was not significant. The hInflamPlex assay indicated an up-regulation of ILRN gene expression in polyps, but this was not significant. B2M-normalized GeXP hInflamPlex assay revealed significantly altered (P ⬍ 0.05) gene expression of five targets in tumor compared to normal tissue, CCL23, CXCL1, CXCL2, CXCL3, and IL8 (Figure 2B). CCL21, CCL5, IL10RB, CXCL4, and TNFRSF1A were not altered significantly.
Statistical Validation Analysis of Gene Expression Profiling Using the hInflamPlex Gene expression profiles obtained using the hInflamPlex data (see Supplemental Tables S4 and S5 at http://jmd. amjpathol.org) were validated further by conducting statistical analysis with corresponding gene expression data generated by Inflammatory Cytokines and Receptors Oligo-GEArray (Superarray) (see Supplemental Table S1 at http://jmd.amjpathol.org) and real-time PCR (see Supplemental Tables S2 and S3 at http://jmd.amjpathol.org). Comparative analysis was confined to gene expression data from normal and polyp tissues because greater significant gene changes were observed between these two tissue types. The gene expression profile patterns obtained using the hInflamPlex GeXP assay were generally comparable with data obtained by both the Oligo-GEArray macroarray and single-plex SYBR realtime PCR assay. Gene expression changes in polyp tissue compared to normal tissue using macroarray and GAPDH- and B2M-normalized real-time PCR (see Supplemental Tables S2 and S3, respectively, at http:// jmd.amjpathol.org) and GeXP hInflamPlex (see Supple-
238 Drew et al JMD March 2011, Vol. 13, No. 2
Figure 2. Relative gene expression levels in human normal, polyp, and tumor tissue generated using the GeXP hInflamPlex assay. Gene expression is normalized to internal reference genes in the hInflamPlex GAPDH (A) and B2M (B). The solid and dotted lines indicate significant differences in expression between normal and polyp and normal and tumor tissue, respectively. *P ⬍ 0.05.
mental Table S1 at http://jmd.amjpathol.org) data were compared (Table 3). All three technologies are in accord with respect to genes that are either up- or down-regulated in polyp compared to normal tissue. Gene expression changes
Table 3.
measured were not always significant at the level of P ⬍ 0.05 with respect to both reference genes or with all three technologies. GeXP expression data identified significantly up- or down-regulated genes (CCL21, CCL23, IL10RB, CXCL1, CXCL2, CXCL3, and CXCL11) in agree-
Gene Expression Changes in Polyp Tissue Compared to Normal Tissue Using Macroarray and GAPDH- and B2 mol/L–Normalized Real-Time PCR and GeXP hInflamPlex Data
Gene
Macroarray PCR
Real-time PCR (GAPDH)
Real-time PCR (B2 mol/L)
GeXP (GAPDH)
GeXP (B2 mol/L)
CCL5 CCL19 CCL21 CCL23 IL10RB TNFRSF1A CCL20 CXCL1 CXCL2 CXCL3 CXCL4 IL8 CXCL11 IL1RN
2* 2* 2* 2* 2* 2trend 1* 1* 1* 1* 1* 1* 1* 1trend
2* 2* 2* 2* 2* 2* 1* 1* 1* 1* 1trend 1 1* 1
2* 2* 2* 2* 2* 2 1* 1* 1* 1* 1* 1* 1* 1*
2* 2* 2* 2* 2* 2* 1 1* 1* 1* 1* 1* 1* 1
2 2 2* 2* 2* 2 1* 1* 1* 1* 1* 1* 1* 1
Data normalized to GAPDH and 2-microglobulin (B2 mol/L). trend P ⬍ 0.1. *P ⬍ 0.05.
Inflammatory Cancer Gene Multiplex Assay 239 JMD March 2011, Vol. 13, No. 2
ment with both macroarray and real-time, single-plex assay GAPDH- and B2M-normalized data (Table 3). CCL5 and CCL19 were both down-regulated in polyp compared to normal tissue, but this was not significant using B2M-normalized hInflamPlex data (Table 3). Likewise, TNFRSF1A was down-regulated, but not significantly, in polyp compared to normal tissue in either B2M-normalized hInflamPlex or real-time PCR data (Table 3). TNFRSF1A showed a trend (P ⬍ 0.1) toward down-regulation in macroarray data (Table 3). CXCL4 up-regulation in polyp compared to normal tissue was significant in all of the data sets except GAPDH-normalized real-time PCR data, which indicated only a trend toward up-regulation (Table 3). Likewise, IL-8 up-regulation was not significant in GAPDH-normalized real-time PCR data (Table 3). ILRN was up-regulated, but this did not reach significance in hInflamPlex data or B2M-normalized real-time PCR data. However, macroarray analysis only showed an upward trend in ILRN gene expression in polyp compared to normal tissue (Table 3). Positive correlations were observed between hInflamPlex data and macroarray (Table 4) and real-time PCR (Table 5) data. The majority vary between 0.5 and 0.9, indicating that there is some technical variability and that this variability changes from gene to gene. It should be noted that using identical technology on the same samples twice will not result in a correlation of 1 because of the inherent technical variability of these assays. Also note that most studies correlating gene expression measurements between different technologies (eg, microarrays and RT-PCR) state correlations of average fold changes across genes. This averaging process will reduce variability and the overall correlation given in these studies and also masks the gene-specific differences that we observe here. PCA was used to further explore the data generated from the two PCR-based technologies to establish whether biopsy types (normal and polyp) can be characterized by variation in gene expression. Principal component analysis is widely used23 in gene expression analysis and other high-throughput studies to give a two-dimensional representation of high-dimensional data in which the dimensions of the original data are given by the number of Table 4.
Correlation of GAPDH- and B2 mol/L–Normalized GeXP hInflamPlex Data With Macroarray Data From Human Normal Colon and Polyp Tissue
Gene
GAPDH
B2 mol/L
CCL5 CCL19 CCL21 CCL23 IL10RB TNFRSF1A CCL20 CXCL1 CXCL2 CXCL3 CXCL4 IL8 CXCL11 IL1RN
0.81 0.76 0.63 0.64 0.48 0.51 0.79 0.84 0.92 0.60 0.47 0.84 0.52 0.65
0.61 0.71 0.60 0.65 0.11 0.30 0.88 0.94 0.94 0.70 0.81 0.86 0.50 0.62
Table 5. Correlation of GAPDH- and B2 mol/L–Normalized GeXP hInflamPlex Data With Real-Time PCR Data From Human Normal Colon and Polyp Tissue Gene
GAPDH
B2 mol/L
CCL5 CCL19 CCL21 CCL23 IL10RB TNFRSF1A CCL20 CXCL1 CXCL2 CXCL3 CXCL4 IL8 CXCL11 IL1RN
0.92 0.65 0.72 0.72 0.90 0.87 0.87 0.80 0.81 0.94 0.61 0.45 0.88 0.62
0.77 0.67 0.73 0.63 0.40 0.78 0.87 0.87 0.89 0.96 0.68 0.66 0.87 0.61
genes, 14 in this case. The principal components (PCs) in such an analysis are weighted sums of the original variables (genes) that explain most of the variability in the data. Figure 3 shows the plots of the first two PCs for the four datasets (2 technologies ⫻ 2 housekeeping genes). Note that the units of the PCs have no direct biological interpretation. The relevant information is in the relative position of the points/samples to each other. The arrows in these plots indicate the contribution of the genes to the PCs (eg, a long arrow pointing right in a horizontal direction indicates a large contribution of the corresponding gene to PC 1, whereas a long arrow pointing down in a vertical direction shows a large negative contribution of the gene to PC2). The principal component plots (Figure 3) are based on a PCA of all 14 genes and reveal a global picture of how using either of the two PCR-based technologies allows us to separate between normal and polyp samples. Comparison of PCA plots on GeXP assay data and real-time PCR data were compared to determine whether both technologies yielded comparable plots. PCA was conducted using data normalized to either GAPDH (Figure 3, A and B) or B2M (Figure 3, C and D). For both technologies and both housekeeping genes the first principal component is able to completely separate the two types of samples and we also see other similar features (eg, in both plots with GAPDH as housekeeper the polyp sample of subject 748 appears as an outlier on PC2).
Discussion Recent studies have reported application of the novel GenomeLab GeXP Genetic Analysis System (Beckman Coulter) to characterize gene expression profiles.8 –11 The technology has been applied successfully in this report to produce an in-house custom-designed assay used to characterize expression profiles of inflammatory cytokines in normal, polyp, and tumor tissues. Further validation of the use of GeXP profiling then was assessed by conducting a correlation analysis of gene expression data obtained from corresponding normal and polyp tissue by macroarray (see Supplemental Table S1 at http://
240 Drew et al JMD March 2011, Vol. 13, No. 2
Figure 3. PCA of GAPDH- and B2M-normalized GeXP hInflamPlex and real-time data from seven human normal colon (N) and polyp (P) tissues. The tissue IDs shown on the PCA plots are listed in Table 1. GeXP hInflamPlex data normalized to GAPDH (A), real-time PCR data normalized to GAPDH (B), GeXP hInflamPlex data normalized to B2M (C), and real-time PCR data normalized to B2M (D).
jmd.amjpathol.org) and real-time single-plex SYBR PCR assays (see Supplemental Tables S2 and S3 at http:// jmd.amjpathol.org). GeXP profiling uses multiplex gene-specific reverse transcription of total RNA (50 to 100 ng) with gene-specific primers incorporating a 5= universal adaptor sequence. PCR using a limiting amount of gene-specific forward primer with a 5= universal adaptor sequence and addition of universal dye-labeled forward and unlabeled reverse primer pairs applies well-characterized principles and procedures. The adoption of universal primers for the latter stage of PCR results in maintenance of the gene ratios of multiplexed targets in the RNA extracts. PCR reaction products then are subject to capillary electrophoresis using a Beckman CEQ 8800 and fragment sizes assessed by means of the dye-labeled forward primer used in the PCR reaction. Fragment analysis to obtain peak areas and normalization using internal reference genes are assessed using the Althea Technologies eXpression Profiling Analysis software (Beckman). The ratios thus obtained are used to determine gene expression changes in the experimental samples. The GeXP assay facilitates incorporation of several reference genes, permitting validation of relative gene expression data using multiple reference genes as advocated.22,23 GeXP expression data thus were normalized to two different reference genes, GAPDH (see Supple-
mental Table S4 at http://jmd.amjpathol.org) and B2M (see Supplemental Table S5 at http://jmd.amjpathol.org). Both reference genes selected generate broadly similar results, providing added confidence in those gene expression changes that are altered significantly relative to both reference genes. The exceptions were TNFRSF1A and CCL20. TNFRSF1A expression was reduced in polyp and tumor tissue compared to normal tissue, but this was not significant in B2M-normalized data. CCL20 expression was increased in polyp and tumor tissue compared to normal, but this was not significant in GAPDH-normalized data. This study lends further support to reports advocating the importance of reference gene selection and the use of more than one reference gene in normalizing relative quantitative gene expression data.21,22,24 –26 Those gene targets showing variation thus can be identified and subjected to further interrogation to ascertain significantly altered regulation. Alternatively, gene targets showing variable profiles can be identified and eliminated from multiplex assays that are used to characterize gene expression profiles in biopsy samples. The GeXP expression profiles reveal increased expression of a number of inflammatory cytokines in polyp tissue as well as tumor tissue (see Figure 2). A number of these previously have been reported to be increased in gut inflammation and or colon tumors.13–17 They also have been reported to be involved in angiogenesis27 and metastasis.28,29 Notably,
Inflammatory Cancer Gene Multiplex Assay 241 JMD March 2011, Vol. 13, No. 2
some of the gene targets that exhibit reduced expression in polyp and tumor tissue (Figure 2) have been linked to antitumor activity.30 In this report gene expression data obtained by macroarray (see Supplemental Table S1 at http://jmd.amjpathol. org) and real-time PCR (see Supplemental Tables S2 and S3 at http://jmd.amjpathol.org) of normal and polyp tissues were used to further validate the in-house custom-designed GeXP hInflamPlex data (see Supplemental Tables S4 and S5 at http://jmd.amjpathol.org). The gene expression profile patterns obtained using the hInflamPlex GeXP assay were generally comparable with previous results obtained by macroarray (see Supplemental Table S1 at http://jmd.amjpathol.org) and real-time PCR (see Supplemental Tables S2 and S3 at http://jmd. amjpathol.org) and are summarized in Table 3. GeXP expression data identified significantly up- or down-regulated genes (CCL21, CCL23, IL10RB, CXCL1, CXCL2, CXCL3, and CXCL11) in agreement with both macroarray and real-time, single-plex assay GAPDH- and B2M-normalized data (Table 3). Notably, all three technologies are in accord with respect to genes that are either up- or down-regulated in polyp compared to normal tissue (Table 3). However, the changes measured are not always significant at the level of P ⬍ 0.05 with respect to both reference genes or with all three technologies (Table 3). Overall, the correlations tend to be slightly higher with the real-time PCR data (Tables 4 and 5). This is plausible because the GeXP and real-time PCR technologies are related more closely to each other than to the macroarray approach. Disparities in significant gene changes may be attributed to a combination of factors relating to the sometimes highly variable gene expression levels of individual targets in the biological samples tested and the technology platform applied. First, some of the gene targets exhibited markedly different expression in polyp compared to normal colon tissue. Low expression levels can result in markedly different values obtained from analysis of the data. Very low and extremely high signal intensity on macroarrays, associated with genes expressed at low and high levels, respectively, will be at the extreme ends of the linear range and consequently provide less accurate data. Conversely, real-time PCR technologies can reduce this effect as low expressed gene targets are amplified. However, the primer assays and PCR platforms used can have a significant impact on the efficiency of amplification of gene targets. Notably, less consistent gene expression levels are obtained by all three technologies when gene targets exhibit a high degree of interindividual variation or expression levels are low in the biological samples being tested. Second, macroarray and PCR-based technologies markedly differ in the principles applied to assess relative quantitation of gene expression. Thus, slight differences in relative quantitation levels are not unexpected and studies have been conducted to assess differences in relative gene expression data obtained using different technology platforms.5,31,32 Macroarray analysis relies on hybridization of labeled cDNA to probe regions on a
nylon filter, whereas real-time PCR and GeXP assays involve PCR amplification procedures using primer assays. The preparation of labeled cDNA required for macroarray analysis thus is significantly different from production of reverse-transcribed cDNA for use as a template for PCR amplification. This can result in changes in the profile of the cDNA generated from the starting total RNA template. Both real-time PCR and GeXP assays measure relative quantitation of amplified transcripts. This increases sensitivity and produces more robust data of genes with low expression. However, amplification procedures may alter relative expression profiles compared to those generated for macroarray analysis. It also should be noted that the choice of data analysis method (eg, pre-processing methods, data transformation) applied also can influence the final results of a study.22,25,26,33 Thus, it is not unexpected that the three technology platforms yield slight variations in significantly altered genes. In conclusion, GeXP expression profiling assays generate quantitative gene expression data that are comparable to macroarray and real-time PCR analysis. Notably, GeXP assay has considerable advantages compared to other relative quantitative gene expression assays. Gene expression data can be gathered from multiple targets simultaneously, permitting more rapid analysis at reduced costs when compared to real-time PCR assays. Relative quantitation of gene expression is feasible using very small amounts of total RNA, facilitating gene expression analysis of small and/or scarce biopsy samples. GeXP custom-design options permit applications for validation of multiple gene targets identified from micro/ macroarray studies. Importantly, more than one reference gene can be incorporated to increase confidence of significant relative quantitative gene expression data obtained, in line with current recommendations.24 The flexibility to multiplex gene targets using GeXP assays contributes a considerable advantage in downstream studies of multiple gene targets to investigate studies of gene function and regulation and assess gene profiles in clinical diagnostics.
Acknowledgments We thank Graeme Murray and Mairi McLean (University of Aberdeen) for total RNA from colon biopsy specimens.
References 1. Takemasa I, Higuchi H, Yamamoto H, Sekimoto M, Tomita N, Nakamori S, Matoba R, Monden M, Matsubara K: Construction of preferential cDNA microarray specialized for human colorectal carcinoma: molecular sketch of colorectal cancer. Biochem Biophys Res Commun 2001, 285:1244 –1249 2. Ma Y, Feng Q, Pitha-Rowe I, Kittareewan S, Dmitrovsky E: Gene profiling uncovers retinoid target genes. Methods Mol Biol 2007, 383:101–121 3. Pitha-Rowe I, Petty WJ, Feng Q, Koza-Taylor PH, DiMattia DA, Pinder L, Dragnev KH, Memoli N, Memoli V, Turi T, Beebe J, Kitareewan S, Dmitrovsky E: Microarray analyses uncover UBE1L as a candidate target gene for lung cancer chemoprevention. Cancer Res 2004, 64:8109 – 8115
242 Drew et al JMD March 2011, Vol. 13, No. 2
4. Yu GR, Kim SH, Park SH, Cui XD, Xu DY, Yu HC, Cho BH, Yeom YI, Kim SS, Kim SB, Chu IS, Kim DG: Identification of molecular markers for the oncogenic differentiation of hepatocellular carcinoma. Exp Mol Med 2007, 39:641– 652 5. Wang Y, Barbacioru C, Hyland F, Xiao W, Hunkapiller KL, Blake J, Chan F, Gonzalez C, Zhang L, Samaha RR. Large scale real-time PCR validation on gene expression measurements from two commercial long-oligonucleotide microarrays. BMC Genomics 2006, 7:59 6. Azzari C, Moriondo M, Indolfi G, Cortimiglia M, Canessa C, Becciolini L, Lippi F, de Martino M, Resti M: Realtime PCR is more sensitive than multiplex PCR for diagnosis and serotyping in children with culture negative pneumococcal invasive disease. PLoS One 2010, 5:e9282 7. Henegariu O, Heerema NA, Dlouhy SR, Vance GH, Vogt PH: Multiplex PCR: critical parameters and step-by-step protocol. Biotechniques 1997, 21:504 –511 8. Vansant G, Pezzoli P, Saiz R, Birch A, Duffy C: Gene expression analysis of troglitazone reveals its impact on multiple pathways in cell culture: a case for in vitro platforms combined with gene expression analysis for early (idiosyncratic) toxicity screening. Int J Toxicol 2006, 25:85–94 9. Chen Q-R, Vasant G, Oades K, Pickering M, Wei JS, Song YK, Monforte J, Khan J: Diagnosis of the small round blue cell tumors using multiplex polymerase chain reaction. J Mol Diagn 2007, 9:80 – 88 10. Rai AJ, Kamath RM, Gerald W, Fleisher M: Analytical validation of the GeXP analyzer and design of a workflow for cancer-biomarker discovery using multiplexed gene-expression profiling. Anal Bioanal Chem 2009, 393:1505–1511 11. Ismail M, Al-Naqeeb G, Mamat AA, Ahmad Z: Gamma-oryzanol rich fraction regulates the expression of antioxidant and oxidative stress related genes in stressed rat’s liver. Nutr Metab (Lond) 2010, 7:23 12. McLean MH, Murray GI, Stewart KN, Norrie G, Mayer C-D, Hold GL, Thomson J, Fyfe N, Hope M, Mowat AG, Drew JE, El-Omar EM (2011). The inflammatory microenvironment in colorectal neoplasia. PLoS ONE 6:e15366. ` acˇev T, Radoševic´ S, Križanac S, Kapitanovic´ S: Influence of inter13. C leukin-8 and interleukin-10 on sporadic colon cancer development and progression. Carcinogenesis 2008, 29:1572–1580 14. Brand S, Olszak T, Beigel F, Diebold J, Otte JM, Eichhorst ST, Göke B, Dambacher J: Cell differentiation dependent expressed CCR6 mediates ERK-1/2. SAPK/JNK, and Akt signaling resulting in proliferation and migration of colorectal cancer cells. J Cell Biochem 2006, 97:709 –723 15. Wang D, Wang H, Brown J, Daikoku T, Ning W, Shi Q, Richmond A, Strieter R, Dey SK, DuBois RN: CXCL1 induced by prostaglandin E2 promotes angiogenesis in colorectal cancer. J Mol Med 2006, 203: 941–951 16. Wen Y, Giardina SF, Hamming D, Greenman J, Zachariah E, Bacolod MD, Liu H, Shia J, Amenta PS, Barany F, Paty P, Gerald W, Notterman D: GROalpha is highly expressed in adenocarcinoma of the colon and down-regulates fibulin-1. Clin Cancer Res 2006, 12:5951–5959 17. Fredrick MJ, Clayman GL: Chemokines in cancer. Expert Rev Mol Med 2001, 3:1–18 18. Karlen P, Löfberg R, Broström O, Leijonmarck C, Hellers G, Persson P: Increased risk of cancer in ulcerative colitis: a population-based study. Am J Gastroenterol 1999, 94:1047–1052 19. Friedman S, Rubin PH, Bodian C, Harpaz N, Present DH: Screening and surveillance colonoscopy in chronic Crohn’s colitis: results of a
20.
21.
22.
23.
24. 25.
26.
27.
28.
29.
30.
31.
32.
33.
surveillance program spanning 25 years. Clin Gastroenterol Hepatol 2008, 6:993–998 Duncan R, Carpenter B, Main LC, Telfer C, Murray GI: Characterisation and protein expression profiling of annexins in colorectal cancer. Br J Cancer 2008, 98:426 – 433 Ropenga A, Chapel A, Vandamme M, Griffiths NM: Use of reference gene expression in rat distal colon after radiation exposure: a caveat. Radiat Res 2004, 161:597– 602 Vandesompele J, De Preter K, Pattyn F, Poppe B, Van Roy N, De Paepe A, Speleman F: Accurate normalization of real-time quantitative RT-PCR data by geometric averaging of multiple internal control genes. Genome Biol 2002, 3:0034.1– 0034.11 Wall ME, Rechtsteiner A, Rocha LM: Singular value decomposition and principal component analysis. A Practical Approach to Microarray Data Analysis. Edited by DP Berrar, W Dubitzky, M Granzow. Norwell, MA, Kluwer, 2003, pp 91–109 Bustin SA: Why the need for qPCR publication guidelines? The case for MIQE. Methods 2010, 50:217–226 Murphy J, Bustin SA: Reliability of real-time reverse-transcription PCR in clinical diagnostics: gold standard or substandard? Expert Rev Mol Diagn 2009, 9:187–197 Anderson CL, Jensen JL, Orntoft TF: Normalization of real-time quantitative reverse transcription-PCR data: a model-based variance estimation approach to identify genes suited for normalization, applied to bladder and colon cancer data sets. Cancer Res 2004, 64:5245– 5250 Strieter RM, Burdick MD, Mestas J, Gomperts B, Keane MP, Belpiero JA: Cancer CXC chemokine networks and tumor angiogenesis. Eur J Cancer 2006, 42:768 –778 Doll D, Keller L, Maak M, Boulesteix AL, Siewert JR, Holzmann B, Janssen KP: Differential expression of the chemokines GRO-2, GRO-3, and interleukin-8 in colon cancer and their impact on metastatic disease and survival. Int J Colorectal Dis 2010, 25:573–581 Li A, Varney ML, Singh RK: Constitutive expression of growth regulated oncogene (gro) in human colon carcinoma cells with different metastatic potential and its role in regulating their metastatic phenotype. Clin Exp Metastasis 2004, 21:571–579 Gao JQ, Sugita T, Kanagawa N, Iida K, Okada N, Mizuguchi H, Nakayama T, Hayakawa T, Yoshie O, Tsutsumi Y, Mayumi T, Nakagawa S: Anti-tumor responses induced by chemokine CCL19 transfected into an ovarian carcinoma model via fiber-mutant adenovirus vector. Biol Pharm Bull 2005, 28:1066 –1070 Arikawa E, Sun Y, Wang J, Zhou Q, Ning B, Dial SL, Guo L, Yang J: Cross-platform comparison of SYBR® green real-time PCR with TaqMan PCR, microarrays and other gene expression measurement technologies evaluated in the MicroArray Quality Control (MAQC) study. BMC Genomics 2008, 9:328 Canales RD, Luo Y, Willey JC, Austermiller B, Barbacioru CC, Boysen C, Hunkapiller K, Jensen RV, Knight CR, Lee KY, Ma Y, Maqsodi B, Papallo A, Peters EH, Poulter K, Ruppel PL, Samaha RR, Shi L, Yang W, Zhang L, Goodsaid FM: Evaluation of DNA microarray results with quantitative gene expression platforms. Nat Biotechnol 2006, 24: 1115–1122 Pfaffl MW, Horgan GW, Dempfle L: Relative expression software tool (REST) for group-wise comparison and statistical analysis of relative expression results in real-time PCR. Nucleic Acids Res 2002, 30:e36