Journal of Theoretical and Applied Information Technology 31st March 2016. Vol.85. No.3 © 2005 - 2016 JATIT & LLS. All rights reserved.
ISSN: 1992-8645
www.jatit.org
E-ISSN: 1817-3195
CUSTOMIZED INSTRUCTIONAL PEDAGOGY IN LEARNING PROGRAMMING – PROPOSED MODEL 1
1 2
MUHAMMED YOUSOOF, 2MOHD SAPIYAN Dhofar University, Department of MIS, Salalah, OMAN
GUST, Department of Computer Science, Kuwait, KUWAIT E-mail:
[email protected],
[email protected]
ABSTRACT Computer programming is a highly cognitive skill. It requires mastery of many domains. But in reality many learners are not able to cope with the mental demands required in learning programming. Thus it leads to rote learning and memorization. There are many reasons for this situation. However one of the main reasons is the nature of the novice learners who experience high cognitive load while learning programming. Given the fact that the novice learners lack well defined schema and the limitation of the working memory, the students could not assimilate the knowledge required for learning. It is to be noted that some learning support in the form of visualization may help in learning programming, as teachers are always reminded that use of visual aids could enhance learning in students. The effect of visualization in learning is not clearly tangible. This paper address this issue by employing NASA TLX rating scale to measure the cognitive load in learning programming using visualizations. The measurement of cognitive load could help to understand the difficulty level of the learners. The learners vary one another in terms of their learning style and capabilities and hence the load experienced during learning programming may differ significantly from one another in a same homogenous group. This paper will propose a model to optimize the instruction to learners based on their background profile and will employ neural network to optimize the instruction by suggesting the best visualization tool for each learner. Keywords: Programming, Visualization, Cognitive Load, NASA TLX scale, Neural Network 1.
INTRODUCTION
As discussed in the abstract this paper addresses to resolve the cognitive load in learning programming. The study also aims at concluding the effectiveness of the visualizations in reducing the cognitive load. There are two methods to measure the load namely physiological measures and non physiological measures. We decided to measure the cognitive load using non-physiological measures. Non-physiological measures are mostly based on the rating scale. These measures are developed using the foundations of psychology whereby the chances of stereotyping and biasness are eliminated. The study is carried out in such a way that it includes the factors that impacts the learning process of novice programmers. The study is based on the Cognitive Load Theory (CLT) which involves the two aspects of memory namely Long Term Memory (LTM) and Working Memory (WM). The factors considered for the LTM included the grades secured in Pre University Mathematics, Matriculation Mathematics, prior
computer knowledge, Matriculation English score, Pre University English score and the grades of the IELTS type examination. The Cognitive load is measured using the rating scale NASA TLX. The students have rated the difficulty on the six different dimensions of the difficulties faced. They also gave weight-age for the difficulty. The cognitive load is calculated using the standard procedure of cognitive load calculation for NASA TLX scale which is discussed in the later sections. The subjects are well organized in terms of their prior knowledge background which relates to LTM and also the cognitive load is measured by the NASA TLX rating scale which corresponds to the WM. 2.
SAMPLE DISTRIBUTION
The experiment was carried out with 40 students in Chennai, India. These students were in the first year of Bachelor of Computer science studying introductory programming. The student’s profile comprised of various s demographical areas such as
309
Journal of Theoretical and Applied Information Technology 31st March 2016. Vol.85. No.3 © 2005 - 2016 JATIT & LLS. All rights reserved.
ISSN: 1992-8645
www.jatit.org
Rural, Urban and Semi Urban. The samples were equally distributed by gender. The first step in conducting the experiment was to collect the basic information of the samples. The basic data included the gender of candidate, area of origin namely Rural, Urban and Semi Urban. In addition to the above basic data, the English and Mathematics knowledge measures were also collected. The scores secured by the samples in the High school and Pre University courses for English and Mathematics was collected. The samples were given a comprehensive English language proficiency test to measure their reading, listening, speaking and writing skills. The English test is similar to IELTS test. It is observed in the selected sample that girls make up 60% of the sample. The samples are also profiled equally based on the demographics of the students, some hail from the city as well as those who are from the rural area who stay in the college hostel. The students are classified according to the demographic locality of their schools prior to entering the tertiary education as urban, semi-urban and rural. The distribution is as follows,37.5% from rural,35% from semi urban and 27.5 % from urban The students were given a choice to choose the programming language to learn for the experiments. There were three groups based on the choice namely the first group to learn Java, the second group to learn C++ and yet another group with C++ to learn Java as there are some students who had some knowledge of C++ in Pre University course. So the third group opted to learn Java. The distribution of the sample was that 15 Students took Java course about 37.5%. Another 14 students about 35% opted for the C++ language. The remaining 11 students nearly 27.5% opted to study Java, as they had studied the C++ computer programming language in their Pre University level. English language skills play a major role in the computer language learning, as computer programming. Programming involves complicated terminologies and jargons which relate to the English skills of the learners. The level of English is determined by administering an IELTS type of examination. If the student’s overall performance is less than Grade 5, then those students are not considered for our study. The examination consists of the reading, listening, speaking and writing skills. According to the observation of the language skill test performance, the student’s overall average was 7.46.
3.
E-ISSN: 1817-3195
EXPERIMENTAL DESIGN
The students used the two visualization tools to learn either C++ or Java programming. A control group learnt the same programming without any visualization tool. They learnt the concepts using class room teaching methods. This control group could help to study the impact of using the visualization tools in reducing the cognitive load. In the total of forty students, fifteen students selected Java programming language and fourteen students selected C++ language. It is to be noted that eleven students had already completed C++ language in their Pre University and they selected Java language. These three groups as mentioned had to learn the various programming concepts using the visualization tools or traditionally. The learning consists comprises of 48 hours for all groups including the introductory session. The introductory session gave an overview of the experiment and orientation of the visualization tools to be used in the experiment. The students were tested for their understanding of the concepts learnt by a short test at the end of learning for each concept. The scores in the short test in each concept is the measure of performance of the learners. 4. COGNITIVE LOAD CALCULATION NASA TLX workload evaluation procedure is a two-part procedure requiring the collection of both weights and ratings from the students and the manipulation of the collected data to provide weighted subscale ratings and an Overall Workload score. There are fifteen possible pair-wise comparisons of the six scale elements that contribute to cognitive load. The subjects are given a flip book which has the pairs of two elements that constitute the load. The subject chooses the element which he feels and has contributed to the load and that element is calculated as a factor for cognitive load measurement. The element that constitutes the cognitive load is selected the load which presents each pair to the subject one pair at a time. The order in which the pairs are presented and the position of the two elements (left or right) are completely randomized and different. When all fifteen possible pairs have been presented, the second part will be continued. The second requirement is to obtain numerical ratings for each difficulty attribute that reflects the magnitude of that factor. The subject rates between 0 to 20. This is termed as raw rating for each
310
Journal of Theoretical and Applied Information Technology 31st March 2016. Vol.85. No.3 © 2005 - 2016 JATIT & LLS. All rights reserved.
ISSN: 1992-8645
www.jatit.org
element of the cognitive load. The weighted workload rating for each element in a task is simply the Weight (tally) for that element a number between zero and five, multiplied by the Magnitude of load, a number between zero and one hundred. Therefore, if the subject had expressed four times for the weight of Temporal Demand and indicated a magnitude of Temporal Demand in a particular task to be 45, then the weighted workload due to Temporal Demand for that particular task would be 90. The overall workload for a particular task is determined by summing all of the weighted workload ratings for an individual subject for the particular task and dividing by 15.The above mentioned procedure is adopted for measuring cognitive for each concept learnt in the case of all the learners.
NASA TLX and learning performance in each category was calculated for each concept learnt by students. The results are tabulated in Table 1.The measures mentioned in the table for both cognitive load and performance is the average score for all the students in each category. Table 1 Analysis Of The Results Based On Programming Language And Visualizations Cognitive Work Load Perfo Lea rne rman Av Tools Ma rs Min era ce x ge
Jav a
5. LTM(LONG TERM MEMORY CALCULATION) C+ +
As mentioned earlier in this paper, we calculated the numerical value for the LTM from the basic information about each student. The parameters considered for calculating the value for LTM is Pre University Mathematics marks, Matriculation Mathematics marks, Pre University English marks, Matriculation English marks and the score got in the English language competency test. The calculation is done by assigning a fixed weight-age for each of the aspects considered for the LTM. The language weight of the LTM includes the grades secured in the Pre University English, Matriculation English and IELTS test score. The other aspect of the LTM is representing the analytical weight of the Long Term Memory which includes the grades of Matriculation Mathematics, Pre University Mathematics and weight-age of Pre University Computer Science grades. The input for the language weight is calculated by assigning 50% weight-age for the English Language skill test which was administered to them prior to learning programming, 25% weight-age for the English language grade in Matriculation and another 25% is considered from the Pre University English language grade. The sum of these weights is hundred. The calculated values of LTM are shown in the subsequent sections. 6. RESULTS AND ANLSYSIS The experiment was carried out as stated in the preceding section. During the experiment, the cognitive load experienced was measured using
E-ISSN: 1817-3195
C+ + to Jav a
Tool 1
5
40
70
53
12
Tool 2 Class room Tool 1
5
38
75
57
12
5
42
77
57
13
5
39
69
56
12
5
43
68
54
11
4
44
77
56
11
4
41
72
54
11
4
37
78
53
12
3
44
69
57
11
Tool 2 Class room Tool 1 Tool 2 Class room teaching
It is observed from Table 1 that while learning Java the average cognitive load was 57% and an average performance of 13 over 20 while using class room method. The same situation applies to C++ and C++ to Java group where the average cognitive load is 56% and 57% respectively. The cognitive load for class room was higher than the groups using visualization tools. So it can be concluded that visualization tools do help in reducing the load. The minimum cognitive load for learning Java is got while using the teaching machine tool with a score of 38% and the highest score of 77% while using the class room method. However, when taking the average load experienced for all the fifteen learners of the Java group, Tool1 has less mean cognitive load of 53. So it can be concluded that Tool1 is more appropriate to learn Java programming language. On the other hand, it is difficult to generalize this conclusion, as the load varies for each student by using the same visualizations. The learning performance is determined by the grades of the students for each concept. In case of learning Java, the learning performance was very high for class room method when compared to Tool 1 and Tool 2. This is
311
Journal of Theoretical and Applied Information Technology 31st March 2016. Vol.85. No.3 © 2005 - 2016 JATIT & LLS. All rights reserved.
ISSN: 1992-8645
www.jatit.org
contradictory to the cognitive load experienced by the group. In these experiments we have considered the cognitive load experienced as the main factor to measure the cognitive load. It is due to the fact that the measurement of cognitive load is done by a standard procedure. The learning performance is used as a control parameter. It is used to cross check the relation between the cognitive load experienced and performance. The mismatch between the performance and cognitive load is due to the fact it is average of all the learners. Thus, it is clear that there is an individual difference between the learners in terms of the cognitive load experienced. The minimum cognitive load of 39% while learning C++ is by using the Tool1 tool and the highest score of 77% is observed while using the class room method. However, when taking the average load experienced for all the fourteen learners of the C++ group, Teaching Machine had less mean cognitive load of 54%. So it can be concluded that tool 2 is more appropriate to learn C++ programming language. However, it is difficult to generalize this conclusion as the load differs for each student. In case of learning C++, the learning performance was very high for Tool1 when compared to other learning methods which are contrary to the higher cognitive load experienced by the group. Table 2 gives the results of the experiments by concept. The table contains the information about performance, Cognitive Load (CL) and Long Term Memory (LTM) for Tool1, Teaching Machine(TM) and Classroom. Table 2 Summary Of The Results –Concept Wise Per
Tool1 CL
73
54.9
LT M 61.2
54
54.6
61.2
54.6
55.1
61.2
70.7
52.1
61.2
73.2
54.4
61.2
68.9
55.3
61.2
Per 63 54. 2 56. 3 73. 2 68. 2 70
Tool2 CL 56. 3 53. 1 55. 9 54. 2 53 56. 2
LT M 60.3 60.3 60.3 60.3 60.3 60.3
Classroom CL LT M 67.5 61. 57.6 9 51.2 55. 57.6 3 48.7 54. 57.6 7 75.4 54. 57.6 8 73.7 56. 57.6 1 78.3 58. 57.6 4 Per
E-ISSN: 1817-3195
It is observed from the results in Table 2 that
•
•
•
•
•
•
The minimum average cognitive load for the first concept was 54.9% while using Tool1. The average performance was also high while using Tool1. The lowest cognitive average cognitive load for the second concept is with the tool 2 which is 53.1. Moreover, the average performance is also higher for TM. In the case of third concept, the lowest average cognitive load while learning using classroom method. In the case of the fourth concept, the average cognitive load is less while using Tool1 and the highest performance average while using class room method. For the fifth concept, the average cognitive load is less while using Tool 2 and the average performance is high with the class room method. The sixth concept while using the Tool1 and the highest average for performance is while using the class room method.
It is also observed from the above facts that there is a variation between the cognitive load experienced and the performance level of each individual student. This is due to the above analysis done as a group study of all the learners learning a particular concept. Individually they are unique by the background knowledge, demographics and gender. The cognitive load varies from learner to learner due to factors which are intrinsic to the learners themselves. It is noted that the cognitive load varies according to the concepts learnt for the same student while using the same visualization tools. The difficulty level of the concepts also alters the cognitive load of the learners. So we have analyzed the data individually in the following paragraphs. Table 3 shows the cognitive load experienced and the performance by the individual learners while using Tool1. There were 3 learners each from Urban and Semi Urban area and there were 4 learners from rural area. There were 6 females and 4 males who learnt using Tool1
312
Journal of Theoretical and Applied Information Technology 31st March 2016. Vol.85. No.3 © 2005 - 2016 JATIT & LLS. All rights reserved.
ISSN: 1992-8645
www.jatit.org
E-ISSN: 1817-3195
Table 3: Summary Of The Results –Tool1
St Id
7
Progra mming Langu age Java
15
Java
18
C++
3
Java
24
C++
27
C++
9
Java
10
Java
25
C++
28
C++
Area
Urban
S.Urb an
Rural
Gen der
LT M
CL
Fe mal e Mal e Fe mal e Fe mal e Fe mal e
62. 7
55. 83
53.3
59. 9 76. 1
56. 4 61. 61
52.5
54. 9
54. 11
71.6
69. 6
51. 2
56.66
62. 8
57
58.3
62. 3 65. 2
49. 89 49. 4
63.3
58. 4
56. 94
61.66
56. 2
53. 06
61.6
Mal e Fe mal e Fe mal e Mal e
Perform ance
It is observed from the table 3a that • The lowest cognitive load was 55.83% and the highest cognitive load was 61.61%. LTM also varies from 76.1% to 59.9% for the urban learners • The lowest cognitive load was 51.2% and the highest cognitive load was 57%.LTM also varied from 54.9% to 62.8% for the semi urban learners • The lowest cognitive load was 49.4% and the highest cognitive load was 56.94%. LTM also varied from 56.2% to 65.2% for the rural learners.
64.16
The following conclusions can be made from the observations • The cognitive load experienced by the individual student, while learning using the same tool and the same concepts, varies even though they belong to the same homogenous group based on their demographics. • These variations are due to the level of the LTM of each individual learner. • These variations in the LTM also affect the level of cognitive load experienced. Thus the performance of the students also alters accordingly.
68.3
Table 3b: Cognitive Load While Using Tool1 - Gender Wise
We decided analyze the results in three aspects while using Tool1. The three aspects include demographics, gender and programming language which are shown in tables 3a, 3b and 3c respectively.
Female
Table 3a: Cognitive while using Tool1- Demographic wise Urban
Semi Urban
Rural
LT M
CL
Pe r
LT M
CL
Per
LT M
C L
Per
62.7
55.8
76.1
61.6
71. 6 56. 6 58. 3
62.3
56.4
54. 9 69. 6 62. 8
54.1
59.9
53 .3 52 .5 64 .1
49 .8 49 .4 56 .9 53
63. 3 68. 3 61. 6 61. 6
51.2 57
65.2 58.4 56.2
Male
LTM
CL
Perf
LTM
CL
Per
62.7
55.83
53.3
59.9
56.4
52.5
76.1
61.61
64.16
62.8
57
58.3
54.9
54.11
71.6
62.3
49.89
63.3
69.6
51.2
56.66
56.2
53.06
61.6
65.2
49.4
68.3
58.4
56.94
61.66
It is observed from the table 3b that • The lowest cognitive load was 49.4% and the highest cognitive load was 61.61%. LTM also varies from 54.9 % to 76.1% for the female learners. • The lowest cognitive load was 49.89 % and the highest cognitive load was 57%. LTM also 313
Journal of Theoretical and Applied Information Technology 31st March 2016. Vol.85. No.3 © 2005 - 2016 JATIT & LLS. All rights reserved.
ISSN: 1992-8645
•
www.jatit.org
varied from 56.2% to 62.8% for the male learners.
The following conclusions can be made from the observations • The cognitive load experienced by the individual students, while learning using the same tool and the same concepts, varies even though they belong to the same homogenous group based on gender. • These variations are due to the level of the LTM of each individual learner. • These variations in the LTM also affect the level of cognitive load experienced. Thus the performance of the students also changes accordingly.
•
These variations in the LTM also affect the level of cognitive load experienced. Thus the performance of the students also changes accordingly.
Table 4 shows the cognitive load experienced and the performance by the individual learners while using tool. There are ten students who learnt using tool1 l as shown in the following table 6.8. There were 3 learners each from Semi Urban and Rural area and there were 4 learners from urban area. There were 7 females and 3 males who learnt using tool1. Table 4: Summary Of The Results Using The Tool2
Table 3c: Cognitive Load while using Tool1 – Programming Language wise Java
E-ISSN: 1817-3195
C++
Prog Language
Area
Urban
LTM
CL
Per
LTM
CL
Per
Java
54.9
54.11
71.6
76.1
61.61
64.16
Java
62.7
55.83
53.3
69.6
51.2
56.66
Java
Urban
62.3
49.89
63.3
58.4
56.94
61.66
C++
Urban
59.9
56.4
52.5
62.8
57
58.3
Java
65.2
49.4
68.3
56.2
53.06
61.6
C++
Gender
Urban
Per
69.4
52.67
57.5
71.3
56.78
59.1
65.2
54.5
61.6
56.2
51.44
45.83
58.5
57.2
69.1
52
53.33
60.83
73.6
60.4
59.16
51.3
61.39
61.66
70.7
56.11
54.16
57.5
49.94
62.5
Female Female Female S.Urban Male S.Urban
Female
C++ S.Urban Rural
Java
Female Male
C++ C++
Rural
Female
Rural
Female
We decided to analyze the results in three aspects while using TM tool. The three aspects include demographics, gender and programming language which are shown in the table 4a, 4b and 4c respectively.
The following conclusions can be made from the observations
•
CL
Male
It is observed from the table 3c that • The lowest cognitive load was 49.4% and the highest cognitive load was 55.83%. LTM also varies from 54.9 % to 65.2% for the Java learners. • The lowest cognitive load was 51.2 % and the highest cognitive load was 61.61%. LTM also varied from 56.2% to 76.1% for the C++ learners.
•
LTM
The cognitive load experienced by the individual students,, while learning using the same visualization tool and the same concepts, varies even though they belong to the same homogenous group based on the programming language. These variations are due to the level of the LTM of each individual learner.
314
Table 4a: Cognitive Load While Using Tool 2Demographic Wise Urban
Semi Urban
Rural
LTM
CL
Per
LTM
CL
Per
LTM
CL
Per
69.4
52.6
57.5
58.5
57.2
69.1
51.3
61.3
61.6
71.3
56.7
59.1
52
53.3
60.8
70.7
56.1
54.1
65.2
54.5
61.6
73.6
60.4
59.1
57.5
49.9
62.5
56.2
51.4
45.8
Journal of Theoretical and Applied Information Technology 31st March 2016. Vol.85. No.3 © 2005 - 2016 JATIT & LLS. All rights reserved.
ISSN: 1992-8645
www.jatit.org
Table 4c: Cognitive Load While Using Tool 2Gender Wise
It is observed from the table 8.a that • The lowest cognitive load was 51.44% and the highest cognitive load was 56.78%. LTM also varies from 56.2% to 71.3% for the urban learners • The lowest cognitive load was 53.3% and the highest cognitive load was 60.4%. LTM also varied from 52% to 73.6% for the semi urban learners • The lowest cognitive load was 49.4% and the highest cognitive load was 61.39 %. LTM also varied from 51.3% to 70.7% for the rural learners. The following conclusions can be made from the observations • The cognitive load experienced by the individual students, while learning using the same tool and the same concepts, varies even though they belong to the same homogenous group based on their demographics. • These variations are due to the level of the LTM of each individual learner since the other parameters like concepts learnt and visualization used are same. • These variations in the LTM also affect the level of cognitive load experienced. Thus the performance of the students also alters accordingly. Table 4b: Cognitive Load while using Tool 2Programming Language wise
Java
C++
LTM
CL
Perf
LTM
CL
Perf
69.4
52.67
57.5
56.2
51.44
45.83
71.3
56.78
59.1
52
53.33
60.83
65.2
54.5
61.6
73.6
60.4
59.16
58.5
57.2
69.1
70.7
56.11
54.16
51.3
61.39
61.6
57.5
49.94
62.5
E-ISSN: 1817-3195
Female
Male
LTM
CL
Per
LTM
CL
Per
71.3
56.78
59.1
69.4
52.67
57.5
65.2
54.5
61.6
58.5
57.2
69.1
56.2
51.44
45.83
51.3
61.39
61.66
52
53.33
60.83
73.6
60.4
59.16
70.7
56.11
54.16
57.5
49.94
62.5
From Table 4b and 4c, we can observe that the highest cognitive load was 61.4 and the lowest load was 52.6 while learning Java. On observation of these two cases, we could see that the LTM is high for the learner who experienced lesser cognitive load and vice versa. The same is the case with learning C++ language. The highest cognitive load is 60.4 and the lowest cognitive load is 49.4. When observing these two cases, it is found that the LTM value is the lowest for the student who has higher value for cognitive load and vice versa. The same applies for the values based on gender. So it can be concluded that the LTM level affects the level of the cognitive load experienced. It is clear from the above examples that the cognitive load varies from student to student even though they belong to a homogenous group. These differences are due to LTM and other control factors such as gender, demographics and programming language. Table 5 gives the Cognitive load experienced by the student and the performance while using Class Room method.
315
Journal of Theoretical and Applied Information Technology 31st March 2016. Vol.85. No.3 © 2005 - 2016 JATIT & LLS. All rights reserved.
ISSN: 1992-8645
www.jatit.org
Table 5: Summary Of The Results Using Class Room Method Prog. Lang C++ Java
Area
Gender
Urban S.Urban
Female
LTM
CL
Per
61.5
52.33
60.83
64.7
52.56
64.16
55.7
57.5
60.8
60.6
58.7
78.3
55.8
55.83
53.33
41.2
54.11
53.33
58.3
56.67
60
64.6
61.39
52.5
59.2
63.5
57.5
7. DISCUSSION ON RESULTS
Male Java
S.Urban
Java
S.Urban
Female Male
C++ C++ Java
S.Urban S.Urban Rural
Male Female Female
Java
Rural Female
C++
Rural
Male
Table 5 shows the LTM, CL and performance of learners while learning with the classroom method. It is observed that as in the case of the Tool1 and Tool 2, the cognitive load varies from individual to individual even though they belong to a homogenous group. In the class room method, it is observed that the higher cognitive load is experienced by learners who have higher value of LTM. This is quite contrary to the other two groups where the students learnt through visualizations. Table 5a: Cognitive Load Using Classroom- Program Wise Java
C++
LTM
CL
Per
LTM
CL
Per
64.7
52.56
64.16
61.5
52.33
60.83
55.7
57.5
60.8
55.8
55.83
53.33
60.6
58.7
78.3
41.2
54.11
53.33
58.3
56.67
60
59.2
63.5
57.5
64.6
61.39
52.5
E-ISSN: 1817-3195
In this study, the cognitive load is measured by the learners’ expression of cognitive load using the NASA TLX scale system. The learning achievement is measured by means of performance on the basis of grades secured for each module. The observation provides multidimensional facets of the cognitive load experienced by the learner during the process of learning which includes mental load, performance, frustration, temporal load and the effort which correlate to the working memory. The LTM schema is also considered in the study by collecting the basic background of the learners in Mathematics and English language and prior programming knowledge. It is clear from the analysis that the cognitive load experienced by the learners differs from individual to individual even though they belong to a homogenous group. This fact is clear from our discussion of the results of cognitive load while using different visualization tools are analyzed on the basis of gender, demographics and programming language. Cognitive load varies for the same learner while learning different concepts in spite of using the same visualization. This shows that the cognitive load is also affected by the level of difficulty of the concept. So, we cannot generalize the effectiveness of all the visualization tools for all the concepts. Some concepts are made easy by using certain visualization and whereas the same tool is not effective for some other concepts. This could be due to varying levels of difficulty of concepts. This is also clear from the study that it would be appropriate to visualize different concepts with different levels of user’s interaction in the visualization tool. The level of difficulty for each concept also determines the effectiveness of various visualization tools. From the analysis of the experimental data, we decided to devise a mechanism to select the appropriate type of visualization tool for students on the basis of cognitive load experienced and performance and taking into the consideration the factors that contribute to the LTM. So this approach will help in providing the appropriate tool for learning suitable for individual learners.
As an example, let us consider the highest cognitive load in Table 5a while learning Java which is 61.39. The lowest cognitive load is 52.5. The corresponding LTM values are 64.6 and 64.7. 8. FRAMEWORK FOR OPTIMIZING In spite of the same level of LTM, there is a INSTRUCTION difference in the cognitive load. It is clear that visualizations do help learners in reducing the load. This variation of the load is due to many It is observed that the learners who had good LTM factors which include demographics of the student value, experienced higher cognitive load due to the and the schemata of the Long Term Memory which learning method adopted. is based on the prior knowledge of the English 316
Journal of Theoretical and Applied Information Technology 31st March 2016. Vol.85. No.3 © 2005 - 2016 JATIT & LLS. All rights reserved.
ISSN: 1992-8645
www.jatit.org
E-ISSN: 1817-3195
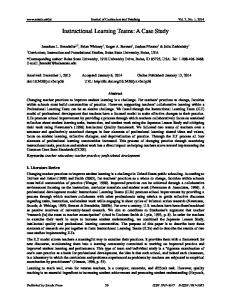
language, Mathematical background and programming knowledge. It is difficult to determine the best tool for learning for every individual student as it depends on various factors mentioned before. The next step is to devise a suitable mechanism to predict the best tool for learning for each student considering many factors that affect learning. So, using the data from the experiments done in the previous chapter we construct a tool that would be able to recommend the best tool for learning programming for every individual user. We started to explore on how such a tool could be implemented. A problem whose output is associated with many factors can be easily represented using the Neural Network. There are many prior works available in the literature where neural network is used in real time examples such Figure 1: Proposed Model Of NN Implementation as sales price predication, stock price prediction ,forecasting financial economical series) and real The above diagram shows the framework estate price prediction. Artificial Neural networks of the tool for optimizing learning is built. But at have been used in many applications related to the present the integration of the visualization education fields like Intelligent Tutoring System. model with the neural network model is not Artificial Neural network is highly successful in accomplished. Both the models work as separate arriving at predictions where there is a high chance entities. Prediction of the tool is done by the neural of uncertainty. Also in our study higher element of network model and on the basis of the uncertainty exists, as the cognitive load is complex recommendation the appropriate visualization tool and varies according to learning levels and ability is recommended to the learners for learning the of the learner. So we decided to develop a tool concepts. using neural network model to solve the learning difficulty of the students based on the cognitive 9. NEURAL NETWORK MODEL FOR load and other related factors. The students’ COMPUTER PROGRAM LEARNING feedback using NASA TLX scale is considered as one of the inputs to the system in order to select the The Neural Network (NN) model based is best tool for their optimized learning. The other composed of different layers. The input layer factors such prior knowledge of English, parameters include the various cognitive factors Mathematics and Computer will also be considered calculated using NASA TLX scale, Mathematical as input for the system. background, analytical background and test We decided to use the supervised learning method in our neural network model to determine performance .The output layer of the network the best visualization tool as an output. The includes the recommendation of the tool for network can be trained using input of cognitive optimized learning. The predictions are based on load from the NASA TLX scale and also the Long the cognitive load of the learners as well as their Term Memory (LTM) which is based on the prior performance in a particular task. The input to the knowledge of Mathematics, English and neural network is chosen so that it accounts for both programming. The weights for each of these inputs the working memory and long term memory. These are simplified and discussed in the subsequent two memories play an important role in learning as per the Cognitive Load Theory (CLT). The major sections. inputs given for the neural network model are based on the prior knowledge of mathematics and computer programming, prior English knowledge and in addition to the load expressed using NASA TLX scale. The first two inputs represent the Long Term Memory (LTM) and the last input represents the working memory. The inputs to the neural network are simplified which will be discussed in the subsequent sections. This system has adopted 317
Journal of Theoretical and Applied Information Technology 31st March 2016. Vol.85. No.3 © 2005 - 2016 JATIT & LLS. All rights reserved.
ISSN: 1992-8645
www.jatit.org
the feed forward loop whereby successive iterations make the system more efficient in predictions. The network is as shown in Figure 7.2
E-ISSN: 1817-3195
2
where
Figure 2: Neural Network Model For The Selection Of The Visualization Tool
9.1 Long Term Memory (LTM) Schemata Input calculation Among the inputs for the neural network are value associated with the LTM, the language weight and the analytical weight of the LTM. The language weight includes the grades secured in the Pre University English, Matriculation English and IELTS test score. The analytical weight includes the grades of Matriculation Mathematics, Pre University Mathematics and weight-age of Pre University Computer Science grades. The input for the language weight is calculated by assigning 50% weight for the English Language skill test which was administered to them prior to learning programming, 25% weight-age for the English language grade in Matriculation and another 25% is considered from the Pre University English language grade. The sum of these weights is one hundred. It represents the input to a maximum of 1 which is the case of normal input to any neural network. We have assigned more weight for the IELTS type examination as it reflects the current state of the student’s English knowledge. The maximum grades for English language skills test is 10 Points. The maximum marks for matriculation English and Pre University English are 100 and 200 respectively. The English language is 50 % of the load of the LTM. The language weight of the LTM is calculated using the formula given below.
4 2
8
a = IELTS marks b = Matriculation English marks. c = Pre University English marks. The analytical weight of the LTM is also calculated in the same manner as the language weight by considering the Matriculation Mathematical marks Pre University Mathematical grade and Computer Science marks in the weightage as mentioned. The 50 % of weight is assigned to the matriculation mathematics marks remaining 50% is assigned equally to the analytical skill which is based on the Pre University Mathematics marks and Pre University Computer Science marks. The maximum marks for Matriculation Mathematics is 100 and Pre University Mathematics and computer science is 200.We have assigned more weight for Matriculation Mathematics marks as this mathematics forms the fundamental knowledge related to Mathematical concepts. Analytical weight of Long Term Memory is calculated as shown in the following formula.
2
8 2
8
where d = Matriculation Mathematics marks. e = Pre university Mathematics marks. f = Pre university Computer science marks. 9.2 Cognitive Load Input Calculation Another input to the neural network is the cognitive load experienced during the task. The training data for the inputs of this neural network is based on the experimental data done in chapter 6.The cognitive load has two dimensions based on NASA TLX scale namely demands imposed on the subject (Mental, Physical and Temporal Demands) and the reaction of the subject with the task (Effort, Frustration and Performance).The demand imposed on the subject has to be minimal and the reaction of the subject must be positive (low scores) for the effective learning processes. The weight is the value determined based on the frequency of the particular attribute of the cognitive load reported to be challenging using the standard procedure of flip book. There are 15 possible combinations available in the flip book. Every occurrence of the particular
318
Journal of Theoretical and Applied Information Technology 31st March 2016. Vol.85. No.3 © 2005 - 2016 JATIT & LLS. All rights reserved.
ISSN: 1992-8645
www.jatit.org
attribute is rated as one. The total weight is the sum of occurrences of that particular aspect of cognitive load. The total weight is converted to percentage as shown below in the formula.
where
15
∗ 100
WCLI = Weight of cognitive load item OW = Frequency of the cognitive load item The rating scale for each of the six aspect of the cognitive load is measured using the scale of 20 in NASA TLX. The rating scale value is converted to percentage by the following formula.
where
20
∗ 100
RP = Rating percentage OR = Observed rating 10. CONCLUSION AND FUTURE WORK The above proposed model can address the individual differences of students. Thus it caters to optimize the instruction according to the background profile and the schemata formation of each individual student. The proposed model has to be validated by conducting a study on the appropriateness and accuracy of the model in selecting the best instructional tool for each student considering the various parameters such as background mathematical knowledge, English language skills and exposure to IT skills etc.If the model is validated then it could be extended to other domains of study to address the difficulties of learners. REFERENCES [1] Alkinani, M. (2009). Software VisualizationExamination of its present status and its future applications. [2] Amy B,W, Tracy C,G, Tai-Lung ,C, Sherri, S. (2000). Personality as a predictor for student success in programming principles I.Paper presented at the 7th Annual conference of Southern Association for Information system. [3] Anderson E, W, Potter K, C, Matzen L, E, Shepherd J, F & Preston G, A, Silva C, T. (2011). A user study of visualization Effectiveness using EEG and Cognitive Load. Paper presented at the IEEE symposium on Visualization.
E-ISSN: 1817-3195
[4] Antonenko, P, Pass,F,Grabner,R. (2010). Using Electroencephalography to Measure CognitiveLoad. Educational Psychol Rev, 22, 425-438. [5] Baddeley, A,Della,S. (1996). Working Memory and Executive control. Philosophical [6] Transactions: Biological Sciences., 351, 1397-1404. [7] Carter, J, Jenkins, T,. (2002). Gender differences in programming? Paper presented at the 7th Annual conference on innovation and technology in computer scienced education. [8] Curtis S.Ikehara, & E.Crosby, Martha. (2005). Assesing Cogntive Load with Physiologica Sensors. Paper presented at the 38th Hawaii International Conference on System Sciences,Hawai,USA. [9] du Boulay, B. (Ed.). (1989). Some difficulties of learning programming. Hillsdale,NJ: Lawerence Erlbaum. [10] E.Tuovinen, Juhani. (2000). Optimising Student Cognitive Load in Computer Education.Melbourne: ACM. [11] E.Winslow, Leon. (1996). Programming PedagogyA Psychological Overview. SIGCSE [12] BULLETIN, 28(3). [13] Essi, L, Kirsti,A,M,Hannu,M,J. (2005). A study of the Difficulties of Novice Programmers. Paper presented at the ITiCSE 2005, Monte de Caparica,Portugal. [14] Garner.S. (2009). A quantitative study of software tool that supports a Part complete solutionMethod on Learning Outcomes. Journal of Information Technology Education, 8, 285-310. [15] Gomes, Anabela, & Mendes, A.J. (2007). Learning to program-difficulties and solutions. Paper presented at the International conference on Engineering Education ICEE 2007,Coimbra,Portugal. [16] Hart, S.G., Battiste. V., Chesney. M. A., Ward. M. M., and McElroy, M. (1986).Comparison of workload, performance and cardiovascular measures:Type A personalities vs Type B.Working paper.Moffett Field,CA:NASA Ames Research Center. [17] Hart, S.G. (2006). NASA TLX Load Index(NASA TLX):20 years later. Paper presented at the Ergonomic factors society 50th Meeting, Santa Monica. [18] Iain M, & R, Gleen. (2002). Difficulties in Learning and Teaching Programming- Views of Students and Tutors. Education and Information Technologies, 7(1), 55-66. [19] Ikehara,S, Curtis, & Crosby.E, Martha. (2005). Assessing Cognitive Load with Physiological sensor.Paper Presented at the 38th Hawaii International Conference on System Sciences 2005,Hawaii USA. [20] Kaastra, I, Boyd,M. (1996). Designing a neural network for forecasting financial and economic time series. Neuro computing, 10, 215-236.
319
Journal of Theoretical and Applied Information Technology 31st March 2016. Vol.85. No.3 © 2005 - 2016 JATIT & LLS. All rights reserved.
ISSN: 1992-8645
www.jatit.org
[21] Kolb, D, A (Ed.). (1985). Learning Style Inventory: Technical Manual. Boston: McBer and company. [22] Mutka, Kirsti Al. (2007). Problems in Learning and Teaching Programming. Institute of Software systems, 13. http://www.cs.tut.fi/~edge/literature_study.pdf [23] P.Bruce-Lockhart, Michael, & S.Norvell, Theodre. (2000). Lifting the Hood of the computer:Program Animation with the Teaching Machine. Paper presented in Electrical and Computer Engineering, 2000 Canadian Conference. [24] Paas, F, Juhani E.T, & Huib, T. (2003). Cognitive Load Measurement as a means to Advance Cognitive Load Theory. Educational Psyhchologist, 38(1), 63-71. [25] Pennington.N. (1987). Comprehension strategies in programming S. S. E. S. GM Olson (Ed.) Emperical studies in programming (pp. 100-112). [26] Rajala T¸ Laakso M J, Kaila E, Salakoski T. (2007). ViLLE – Muti language Tool for Teaching Novice Programming TUCS Technical report. Helsinki: Tampere University,Finland. [27] Rajala T¸ Laakso M J, Kaila E, Salakoski T (2008). Effectiveness of program visualization – A case study with ViLLE Tool. Journal of Information Technology Education, 7, 15-32. [28] Robins, A, Rountree,J,Rountree,N. (2003). Learning and Teaching Programming: A Review andDiscussion. Computer Science Education, 13(2). [29] Schoneburg, E. (1990). Stock Price Prediction Using Neural Networks :A Project Report. Neuro computing, 2, 17-27. [30] Shaffer, Dale, Doube, Wendy, & Tuovinen, Juhani. (2003). Applying Cognitive Load Theory to Computer Science Education. Paper presented at the Joint Conference EASE&PPIG 2003. [31] Soloway, E (Ed.). (1983). What do novices know about programming ? . Ablex: Norwood,NJ. [32] Soloway, E. (1986). Learning to Program = Learning to construct mechanism and explanations.Communications of ACM, 29(9). [33] Soloway, E, Spohrer,J, (Ed.). (1989). Studying the Novice programmers, L. Erlbaum Associates.New Jersey.. [34] Sweller, J. (1988). Cognitive load during problem solving : Effects on learning. Cognitive Science,12, 257-285. [35] Wiedenbeck , S, Ramalingam, V, Sarasamma, S, Corritore, C. (1999). A comparison of the [36] comprehension of Object Oriented and procedural programs by novice programmers. Interaction with computers, 11(3), 255-282. [37] Wilkowski, W, Budzynski,T. (2006). Application of Artificial Neural Networks for Real Estate Valuation. Paper presented at the XXXIII FIG Congress, Munich,Germany
E-ISSN: 1817-3195
[38] Winslow, L.E. (1996). Programming pedagogy- A psychological overview. SIGCSE BULLETIN, 28(3), 17-22. [39] Yu Shi, & H.C.Choi, Eric. (2007). Galvanic Skin Response (GSR) - as an index of Cognitive Load.Paper presented at the CHI 2007, San Jose, CA, USA.
320