250
Int. J. Manufacturing Research, Vol. 8, No. 3, 2013
Cutting temperature in rotary ultrasonic machining of titanium: experimental study using novel Fabry-Perot fibre optic sensors Xiaotian Zou Department of Biomedical Engineering and Biotechnology, University of Massachusetts, One University Ave., Lowell, MA, 01854 USA
Weilong Cong Department of Industrial and Manufacturing Systems Engineering, Kansas State University, 2037 Durland Hall, Manhattan, KS, 66506 USA
Nan Wu and Ye Tian Department of Electrical and Computer Engineering, University of Massachusetts, One University Ave., Lowell, MA, 01854 USA
Z.J. Pei Department of Industrial and Manufacturing Systems Engineering, Kansas State University, 2037 Durland Hall, Manhattan, KS, 66506 USA
Xingwei Wang* Department of Biomedical Engineering and Biotechnology, University of Massachusetts, One University Ave., Lowell, MA, 01854 USA E-mail:
[email protected] *Corresponding author Abstract: Titanium has a wide variety of applications, particularly in the aerospace industry. However, because of its low thermal conductivity and high strength, machining of titanium is very difficult. The heat generated in machining can dramatically shorten the tool life. Rotary ultrasonic machining (RUM) is a non-traditional machining process, and has been used to machine various difficult-to-machine materials. Investigations have been reported regarding effects of machining variables (including ultrasonic power, tool rotation speed, and feedrate) on several output variables in RUM, such as cutting force, torque, surface roughness, edge chipping, material removal rate, and tool wear. However, there have been few studies on cutting temperatures in RUM. This paper presents an experimental study on cutting temperature in Copyright © 2013 Inderscience Enterprises Ltd.
Cutting temperature in rotary ultrasonic machining of titanium RUM of titanium. It is the first study to utilise fibre optic temperature sensors to measure the cutting temperature in RUM. The results revealed effects of machining variables on cutting temperature in RUM, and demonstrated that Fabry-Perot (FP) fibre optic sensors offer more accurate localised measurement of temperature in RUM than thermocouples. [Received 30 January 2012; Revised 4 August 2012; Accepted 22 September 2012] Keywords: rotary ultrasonic machining; RUM; cutting temperature; titanium; Fabry-Perot; FP; fibre optic sensor. Reference to this paper should be made as follows: Zou, X.,Cong, W., Wu, N., Tian, Y., Pei, Z.J. and Wang, X. (2013) ‘Cutting temperature in rotary ultrasonic machining of titanium: experimental study using novel Fabry-Perot fibre optic sensors’, Int. J. Manufacturing Research, Vol. 8, No. 3, pp.250–261. Biographical notes: Xiaotian Zou received his MS in Mechanical Engineering from the University of Connecticut in 2010. He is a PhD candidate at the Department of Biomedical Engineering and Biotechnology, UMass Lowell. His research interests are fibre optical sensors, control and data analysis algorithms, and structural health monitoring. Weilong Cong is a doctoral student in the Department of Industrial and Manufacturing Systems Engineering, Kansas State University. His research interests include grinding and rotary ultrasonic machining. Nan Wu completed his PhD from the Department of Electrical and Computer Engineering, University of Massachusetts Lowell (2012). He is now working as a Postdoctoral Researcher at UMass Lowell. His research interests include fibre optic pressure sensors, fibre optic photoacoustic generators and photoacoustic imaging. Ye Tian received his Master degree from Institute of Modern Optics of Nankai University in 2008 and his Bachelor in Communication Engineering from Nankai University of China in 2005. He is a PhD student in Department of Electrical and Computer Engineering, UMass Lowell. His research interests include optical biosensors, optical fibre sensors, MEMS and nano/micro fabrication. Z.J. Pei is a Professor in the Department of Industrial and Manufacturing Systems Engineering at Kansas State University. His research interests include grinding, lapping, polishing, rotary ultrasonic machining and sub-surface damage measurement. He received his PhD in Mechanical Engineering from the University of Illinois-Urbana. Xingwei Wang is an Assistant Professor in the Electrical and Computer Engineering Department of the Francis College of Engineering at the University of Massachusetts Lowell. Her research interests include optical fibre sensors and nanoprobe design and fabrication. She received her PhD from Virginia Tech.
251
252
1
X. Zou et al.
Introduction
Titanium has a variety of applications, particularly in the aerospace industry (Peacock, 1988; Hale, 2006; Boyer, 1996). Because of its low thermal conductivity and high strength, machining of titanium usually results in high cutting temperatures which shorten the tool life. Rotary ultrasonic machining (RUM) is a hybrid machining process that combines the material removal mechanisms of diamond grinding and ultrasonic machining (Cong et al., 2010). The RUM cutting tool is a core drill with metalbonded diamond abrasives. During the machining process, the rotating tool vibrates axially at an ultrasonic frequency and cuts through the workpiece. Coolant is pumped through the core of the drill, washes away the swarf and prevents the tool from jamming and overheating. There are several reported investigations on the effects of machining variables (for example, ultrasonic power, tool rotation speed, and feedrate) and tool variables (for example, diamond grit size, diamond concentration, and metal bond type) on output variables (such as cutting force, material removal rate, tool wear, and surface roughness) during RUM of titanium (Churi et al., 2006, 2007; Kumar and Khamba, 2010). To date, there have been few studies in the literature that specifically investigate the cutting temperatures in RUM of titanium. In RUM (and other machining processes), high cutting temperatures strongly influence tool life and quality of machined parts (O’Sullivan and Cotterell, 2002; Katz and Sonnekus, 2009). Currently there are different kinds of temperature measurement techniques. Several authors (Shiraishi, 1988; Komanduri and Hou, 2001) have reviewed temperature measurement techniques used in machining processes, including thermocouples (Rittel, 1998), infrared photography (Shaik, 1981), infrared pyrometers (Jehnming and Chang-Yi, 2001), and thermal paints (Batako et al., 2005). Thermocouples are the most common method of temperature measurement in machining because of their availability, cost, and ease of installation. However, thermocouples can often be too large to measure point temperature, and can be disruptive of heat flow, insensitive to small or transient temperature changes, and susceptible to noise (Cong et al., 2011; Shiraishi, 1988). Non-invasive, non-contact methods of temperature measurement, such as pyrometers (Jehnming and Chang-Yi, 2001) and infrared cameras (Shaik, 1981), are dependent on the amount of infrared radiation emitted by an object, can be expensive, and require repeated calibration (Komanduri and Hou, 2001). Such disadvantages limit their applications in RUM. This paper reports an experimental investigation on cutting temperature in RUM of titanium by utilising self designed and fabricated Fabry-Perot (FP) fibre optic sensors. Compared with thermocouples and infrared pyrometers, fibre optic sensors offer more stable performance and durability against harsh environments, high accuracy and resolution measurement with low cost. Moreover, compared with most widely used grating-based (Quintela, 2002; Bhatia et al., 1997) and tubing-based (Kesavan et al., 2010; Li and Peng, 2008) fibre optic temperature sensors, the FP fiber optic temperature sensors are notable for point temperature measurement because of their miniature sensing element on the tip. Other advantages of the FP fibre optic sensors include their simple fabrication process and flexible FP cavity length control. Experiments were designed and conducted to study the effects of three machining variables: ultrasonic power, tool rotation speed, and tool feedrate.
Cutting temperature in rotary ultrasonic machining of titanium
2
253
FP fibre optic sensors
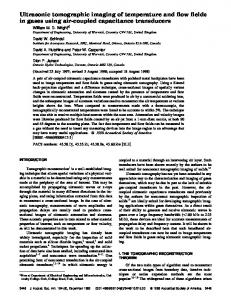
2.1 Sensor structure and principle The self designed fibre optic sensor is based on the FP principle (Tian et al., 2011; Zou et al., 2012). A schematic diagram of the sensor is shown in Figure 1. The temperature sensor consists of a piece of single mode fibre (SMF) with 125 µm outside diameter (OD), a multimode fibre (MMF) with 125 µm OD, and a piece of borosilicate glass. The SMF is used to propagate the light and to illuminate the MMF and the borosilicate glass. Due to differential etching rate between the pure silica of the fibre cladding and the germanium-doped silica of fibre core, an FP cavity with 40 µm length is fabricated along the axial of the MMF by wet etching (Wu et al., 2012). The etching solution is hydrofluoric acid (HF 49% in weight concentration). A piece of borosilicate glass is thermally deposited in the cavity of the wet etched MMF. After polishing the surface of borosilicate glass, an FP interferometer was formed due to the different refractive indexes between the fused silica and the borosilicate glass. According to the thermal expansion of the borosilicate glass, the structure can work as a temperature sensor in multiple engineering applications by monitoring the changes in the reflection spectra. Borosilicate glass was chosen as the sensing material due to its high thermal expansion coefficient. Figure 1
The structure of the FP fibre optic temperature sensor (see online version for colours)
When an incident light is illuminated on the FP structure, the light reflects on two interfaces: one is between the SMF core and the borosilicate glass; the other one is formed by polishing another side of the borosilicate glass. The two reflected lights will interfere with each other and generate an interference pattern. The interference pattern will shift according to the change of the optical path difference between the two interfaces, which depends on the FP cavity length. The FP cavity length will change due to the thermal expansion of borosilicate glass caused by the outside temperature change. By interrogating the interference pattern shift, the temperature can be measured.
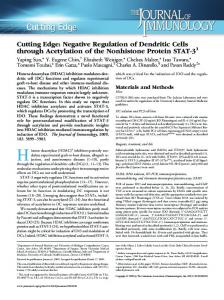
2.2 The interrogation system and sensor calibration Prior to measuring the cutting temperature during RUM of titanium, the fibre optic temperature sensors need to be calibrated in order to obtain the relation between the temperature and shift of spectrum and the sensitivity as well as the hysteresis information (Wu et al., 2011). Figure 2 shows the interrogation system setup for sensor calibration. The fibre optic temperature sensor was placed in a temperature calibrator chamber (T400, E Instruments, Langhorne, Pennsylvania, USA). An optical sensing analyser (Si720, Micron Optics, Atlanta, Georgia, USA) was introduced to excite the laser signal (scan wavelength from 1,520 nm to 1,570 nm with a 2.5 pm resolution) into the fibre optic sensor, while the spectrum response from the reflected light was also collected by
254
X. Zou et al.
the optical sensing analyser through an optical circulator. The temperature calibrator was set to increase the temperature from 40°C to 150°C. The spectrum of sensor’s reflection interference pattern shifted with the environment temperature. The sensor’s sensitivity can be determined by recording the interference pattern’s valley position change in the term of wavelength corresponding to the temperature change inside the calibrator chamber. The calibration results for one FP fibre optic sensor are shown in Figure 3. The procedure was repeated for three cycles in order to determine the sensor’s linearity, hysteresis, and repeatability (Wu et al., 2011). The sensitivity for this sensor was 0.01 nm/°C. The linearity was good with a correlation coefficient of 0.99. The hysteresis is 0.13%. The reaction time is less than 1 second. Figure 2
The interrogation scheme for sensor calibration
Circulator Fibre optic temperature sensor
PC OSA
Temperature calibrator Figure 3
Linearity and sensitivity of the sensor (see online version for colours) Increase 1 Decrease 1 Increase 2 Decrease 2 Increase 3 Decrease 3
1551.8
Wavelength (nm)
1551.6 1551.4 1551.2 1551.0 1550.8 1550.6 1550.4 1550.2
40
60
80
100
120
140
160
Temperature (°C)
3
Experimental setup and conditions
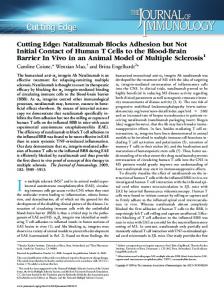
3.1 Experimental setup A rotary ultrasonic machine (Series 10, Sonic-Mill, Albuquerque, New Mexico, USA) was used to perform the experiment. The experimental setup is schematically illustrated in Figure 4. The system mainly consists of three systems: the ultrasonic spindle system, the fibre optic sensing and data acquisition system, and the coolant system.
Cutting temperature in rotary ultrasonic machining of titanium Figure 4
255
Experimental setup schema (see online version for colours)
Electric motor
Ultrasonic spindle system 3000
Ultrasonic spindle Control panel
Pressure gauge Valve
Motor speed controller Power supply
Workpiece
Fiber optic
Tool
sensor
Fiber optic sensing and data acquisition system
Fixture Optical Machine table
Pressure regula tor
circulator
Flow ra te gauge
Coolant system
Optical sensing analyzer
Valve
Computer
Pump Coolant tank
The ultrasonic spindle system is comprised of an ultrasonic spindle, a power supply, an electric motor, a control panel, and a motor speed controller. The power supply converts 60 Hz electrical supply to high-frequency (20 kHz) AC output. This high frequency electrical energy is provided to a piezoelectric converter (located in the ultrasonic spindle) that converts electrical energy into mechanical vibration. The ultrasonic vibration is amplified and transmitted to the tool. The amplitude of ultrasonic vibration can be adjusted by changing the setting on the power supply. The motor attached atop the ultrasonic spindle supplies the rotational motion of the tool and different speeds can be obtained by adjusting the motor speed controller. The fibre optic sensing and data acquisition system includes an optical sensing analyser (OSA si 720), and an optical circulator. Similar to the interrogation system for sensor calibration, the OSA excited the laser signal into fibre optic temperature sensor, while the spectrum response from the reflected light was also collected by OSA through the optical circulator. Then the data were further demodulated into temperature information in the computer. The tool used to drill the workpiece was a metal-bonded diamond core drill (NBR Diamond tool corp., LaGrangeville, NY, USA). The outside and inside diameters (OD and ID) of the tool were 0.375” (9.54 mm) and 0.305” (7.75 mm), respectively, and
256
X. Zou et al.
the tuning length was 1.75” (44.45 mm). The metal bond was of B type. The size of diamond grains was mesh 80/100 and the diamond concentration was 100.
3.2 Experiment conditions Based on past experiences with RUM of titanium and due to the limitations of the experiment setup (Cong et al., 2011), the experiments were focused on the study of the following three machining variables: ultrasonic power, tool rotation speed, and feedrate. The machining variables and their values are shown in Table 1. The same drill tool has been applied for all tests. Table 1
Values of machining variables.
Experiment no.
Ultrasonic power %
Tool rotation speed (RPM)
Feedrate (mm/s)
1
0
3,000
0.02
2
20
3,000
0.02
3
40
3,000
0.02
4
60
3,000
0.03
5
20
3,000
0.03
6
0
3,000
0.04
7
20
3,000
0.04
8
40
3,000
0.04
9
60
3,000
0.04
10
20
2,000
0.02
11
20
4,000
0.02
Figure 5
Fibre optic temperature sensor layout, (a) The sensor layout scheme (b) Photomicrograph of sensor layout (see online version for colours)
Rotation
Feed direction Workpiece
Vibration
Drill
Coolant flow in Drill
Fibre optic sensor
Coolant flow out
(a)
Blind hole
Plasticene
Fibre optic temperature sensor (b)
(b)
Cutting temperature in rotary ultrasonic machining of titanium
257
The temperature sensor layout used in this study is illustrated in Figure 5. A blind hole perpendicular to the tool feeding direction and along the radius direction of the hole was drilled into the workpiece. The distance between the end of this blind hole and the cylindrical surface of machined hole was 0.5 mm and the distance between the blind hole and the upper surface of the workpiese was 6 mm. A fibre optic temperature sensor was positioned inside the blind hole. To mount the temperature sensor in place, the blind hole was sealed with plasticene. The signals from the temperature sensor were demodulated through the OSA. Then the measured data were recorded and displayed on a computer.
4
Experimental results
4.1 Effects of ultrasonic power Ultrasonic power has significant effects on cutting temperature. Effects of ultrasonic power on cutting temperature are shown in Figure 6 and Figure 7. Specifically, shown in Figure 6(b) and Figure 7(b) are maximum cutting temperature readings. It can be found that the maximum cutting temperatures when ultrasonic vibration was on (ultrasonic power = 20%, 40%, and 60%) were lower than those when ultrasonic vibration was off (ultrasonic power = 0). This is due to the different contact modes between the tool end face and the workpiece. The friction between the tool end face and the workpiece in the continuous contact mode when ultrasonic vibration was off generated more heat than that in the intermittent contact mode when ultrasonic vibration was on. As shown in Figure 6(b) and Figure 7(b), when ultrasonic power increased from 20% to 60%, the maximum cutting temperatures increased proportionally. This is because when ultrasonic power increased, ultrasonic vibration amplitude increased correspondingly. According to Cong et al.’s (2011) study, an increased ultrasonic vibration amplitude will increase both the penetration depth of diamond grains into the workpiece material and the interaction force between the diamond grain and the workpiece material. Effects of ultrasonic power on cutting temperature with feedrate of 0.02 mm/s and tool rotation speed at 3,000 RPM, (a) Curves of temperature versus machining time (b) Maximum temperature readings (see online version for colours)
120
Temperature (°C)
120
Ultrasonic power: 20% Ultrasonic power: 40% Ultrasonic power: 60% Ultrasonic power: 0%
110 100
Temperature (°C)
Figure 6
90 80 70 60 50 40 30
Tool rotation speed: 3000 RPM Feedrate: 0.02 mm/s
110
100
90
20 Tool rotation speed: 3000 RPM 10
Feedrate: 0.02 mm/s
0
200
400
600
Time (s) (a)
800
1000
80
0
20
40
Ultrasonic power (%) (b)
60
258
X. Zou et al. Effects of ultrasonic power on cutting temperature with feedrate of 0.04 mm/s and tool rotation speed at 3000 RPM, (a) Curves of temperature versus machining time (b) Maximum temperature readings (see online version for colours)
140 Ultrasonic power: 20% 130 Ultrasonic power: 40% 120 Ultrasonic power: 60% 110 Ultrasonic power: 0% 100 90 80 70 60 50 40 30 20 Tool rotation speed: 3000 RPM 10 Feedrate: 0.04 mm/s 0
100
200
140 Tool rotation speed: 3000 RPM Feedrate: 0.04 mm/s
Temperature (°C)
Temperature (°C)
Figure 7
120
100
80 300
400
500
0
20
40
60
Ultrasonic power (%)
Time (s) (a)
(b)
4.2 Effects of tool rotation speed Effects of tool rotation speed on cutting temperature are shown in Figure 8. From the figure, one can see that the maximum cutting temperature decreased sharply when tool rotation speed changed from 2,000 to 3,000 RPM. However, the maximum cutting temperature gradually increased as tool rotation speed increased from 3,000 to 4,000 RPM. The measured temperature was the lowest when tool rotation speed was 3,000 RPM. One reason can be found in Cong et al.’s (2011) paper. A lower tool rotation speed led to a higher depth of cut for the individual diamond grain on the tool end face, producing a higher cutting force. Figure 8
Effects of tool rotation speed on cutting temperature, (a) Curves of temperature versus machining time (b) Maximum temperature readings (see online version for colours)
120
Temperature (°C)
100
Temperature (°C)
105
Tool rotation speed: 2000 RPM Tool rotation speed: 3000 RPM Tool rotation speed: 4000 RPM
110 90 80 70 60 50 40 30
20 Feedrate: 0.02 mm/s 10
200
100 95 90 85 80
Ultrasonic power: 20%
0
Feedrate: 0.02 mm/s Ultrasonic power: 20%
400
600
Time (s) (a)
800
1000
2000
3000
4000
Tool rotation speed (RPM) (b)
Cutting temperature in rotary ultrasonic machining of titanium
259
4.3 Effects of feedrate Effects of feedrate on cutting temperature are shown in Figure 9. It can be seen that when feedrate increased from 0.02 to 0.03 mm/s, there was slight rising in the maximum cutting temperature. However, when feedrate increased from 0.03 to 0.04 mm/s, the maximum cutting temperature was increased dramatically. Figure 9
Effects of feedrate on cutting temperature, (a) Curves of temperature versus machining time (b) Maximum temperature readings (see online version for colours)
100
Feedrate: 0.02 mm/s Feedrate: 0.03 mm/s Feedrate: 0.04 mm/s
80
88
Temperature (°C)
Temperature (°C)
90
70 60 50 40 30
Tool rotation speed: 3000 RPM Ultrasonic power: 20%
86
84
20 Tool rotation speed: 3000 RPM 10
Ultrasonic power: 20%
0
200
400
600
Time (s) (a)
800
1000
0.02
0.03
0.04
Feedrate (mm/s) (b)
According to Cong et al.’s (2011) study, as feedrate increased, the penetration depth of individual diamond grains into workpiece material and their interaction force increased. Furthermore, when feedrate increased to beyond some critical value, the contact mode between diamond grains and workpiece material may be changed from intermittent to continuous, which further increased the cutting temperature.
4.4 Discussions By investigating effects of three machining variables (ultrasonic power, tool rotation speed, and feedrate) on cutting temperature, the observed trends in this paper were consistent with those previously reported by Cong et al. (2011). In Cong et al.’s paper, the temperatures measured from A K-type thermocouple (Model SC-GG-K-30-36, OMEGA Engineering, Inc. Stamford, CT, USA) in RUM for each machining variables were lower than those reported in this paper. This difference was likely due to the limitations of the thermocouple measurement (Shiraishi, 1988). In Cong et al.’s experiment, the thermocouple sensed the average temperatures inside the blind hole, and subjected to heat flow disturbances. In this paper, the fibre optic sensor offers more accuracy local point measurement, good durability against harsh environments.
260
5
X. Zou et al.
Conclusions
This paper presents using fibre optic temperature sensors for measuring cutting temperature in RUM of titanium. Effects of three machining variables (ultrasonic power, tool rotation speed, and feedrate) on the cutting temperature have been investigated. The results are consistent with the assertion that FP fibre optic sensors provide more accurate localised measurement in RUM than thermocouples. Furthermore, experimentally obtained results can provide foundations for attempts to develop simulation models to predict cutting temperatures at the tool-workpiece interface.
Acknowledgements The work was supported by the National Science Foundation through Grants No. CMMI-0856204 and CMMI-0970112. The authors gratefully extend their acknowledgements to Mr. Bruno Renzi at N.B.R. Diamond tool Corp. for supplying the diamond core drill.
References Batako, A.D., Rowe, W.B. and Morgan, M.N. (2005) ‘Temperature measurement in high efficiency deep grinding’, International Journal of Machine Tools and Manufacture, Vol. 45, No. 11, pp.1231–1245. Bhatia, V., Campbell, D., Claus, R.O. and Vengsarkar, A.M. (1997) ‘Simultaneous strain and temperature measurement with long-period gratings’, Opt. Lett., Vol. 22, No. 9, pp.648–650. Boyer, R. (1996) ‘An overview on the use of titanium in the aerospace industry’, Materials Science and Engineering: A, Vol. 213, Nos. 1–2, pp.103–114. Churi, N.J., Pei, Z.J. and Treadwell, C. (2006) ‘Rotary ultrasonic machining of titanium alloy: effects of machining variables’, Machining Science and Technology, Vol. 10, No. 3, pp.301–321. Churi, N.J., Pei, Z.J. and Treadwell, C. (2007) ‘Rotary ultrasonic machining of titanium alloy (Ti-6Al-4V): effects of tool variables’, Int. J. Precision Technology, Vol. 1, No. 1, pp.85–96. Cong, W.L., Feng, F., Pei, Z.J., Deines, T.W. and Treadwell, C. (2011) ‘Experimental study on cutting temperature in rotary ultrasonic machining’, Proceedings of NAMRI/SME, Vol. 39. Cong, W.L., Pei, Z.J., Deines, T., Wang, Q.G. and Treadwell, C. (2010) ‘Rotary ultrasonic machining of stainless steels: empirical study of machining variables’, International Journal of Manufacturing Research, Vol. 5, No. 3, pp.370–386. Hale, J. (2006) ‘Boeing 787 from the ground up’, AERO, Vol. 24, No. 4, pp.17–23. Jehnming, L. and Chang-Yi, L. (2001) ‘Measurement of cutting tool temperature by an infrared pyrometer’, Measurement Science and Technology, Vol. 12, No. 8, pp.1243–1255. Katz, Z. and Sonnekus, R. (2009) ‘On temperature modelling and validation for high-speed machining of titanium alloys’, International Journal of Manufacturing Research, Vol. 4, No. 3, pp.324–342. Kesavan, K., Ravisankar, K., Parivallal, S., Sreeshylam, P. and Sridhar, S. (2010) ‘Experimental studies on fiber optic sensors embedded in concrete’, Measurement, Vol. 43, No. 2, pp.157–163. Komanduri, R. and Hou, Z.B. (2001) ‘A review of the experimental techniques for the measurement of heat and temperatures generated in some manufacturing processes and tribology’, Tribology International, Vol. 34, No. 10, pp.653–682.
Cutting temperature in rotary ultrasonic machining of titanium
261
Kumar, J. and Khamba, J.S. (2010) ‘Multi-response optimisation in ultrasonic machining of titanium using Taguchi’s approach and utility concept’, International Journal of Manufacturing Research, Vol. 5, No. 2, pp.139–160. Li, E. and Peng, G-D. (2008) ‘Wavelength-encoded fiber-optic temperature sensor with ultra-high sensitivity’, Optics Communications, Vol. 281, No. 23, pp.5768–5770. O’Sullivan, D. and Cotterell, M. (2002) ‘Workpiece temperature measurement in machining’, Proceedings of the Institution of Mechanical Engineers – Part B – Engineering Manufacture, Professional Engineering Publishing, Vol. 216, No. 1, pp.135–139. Peacock, D. (1988) ‘Aerospace applications for titanium’, Sheet Metal Industries, Vol. 65, No. 8, pp.406–408. Quintela, A. (2002) ‘Embedded temperature-strain fibre Bragg grating sensor system validation for concrete structures’, Journal of Optics A: Pure and Applied Optics, Vol. 4, No. 6, p.S387. Rittel, D. (1998) ‘Transient temperature measurement using embedded thermocouples’, Experimental Mechanics, Vol. 38, No. 2, pp.73–78. Shaik, J. (1981) ‘Measurement of temperature distribution in machining using IR photography’, Wear, Vol. 68, No. 2, pp.191–202. Shiraishi, M. (1988) ‘Scope of in-process measurement, monitoring and control techniques in machining processes – Part 1: in-process techniques for tools’, Precision Engineering, Vol. 10, No. 4, pp.179–189. Tian, Y., Wang, W., Wu, N., Zou, X., Guthy, C. and Wang, X. (2011) ‘A miniature fiber optic refractive index sensor built in a MEMS-based microchannel’, Sensors, Vol. 11, No. 1, pp.1078–1087. Wu, N., Wang, W., Tian, Y., Zou, X., Maffeo, M., Niezrecki, C., Chen, J. and Wang, X. (2011) ‘Low-cost rapid miniature optical pressure sensors for blast wave measurements’, Opt. Express, Vol. 19, No. 11, pp.10797–10804. Wu, N., Zou, X., Tian, Y., Fitek, J., Maffeo, M., Niezrecki, C., Chen, J. and Wang, X. (2012) ‘An ultra-fast fiber optic pressure sensor for blast event measurements’, Measurement Science and Technology, Vol. 23, No. 5, p.055102. Zou, X., Chao, A., Tian, Y., Wu, N., Zhang, H., Yu, T-Y. and Wang, X. (2012) ‘An experimental study on the concrete hydration process using Fabry-Perot fiber optic temperature sensors’, Measurement, Vol. 45, No. 5, pp.1077–1082.