open access
www.bioinformation.net
Database
Volume 8(13)
CyanoEXpress: A web database for exploration and visualisation of the integrated transcriptome of cyanobacterium Synechocystis sp. PCC6803 Miguel A Hernandez-Prieto & Matthias E Futschik* Institute for Biotechnology and Bioengineering (Laboratório Associado), Centre for Molecular and Structural Biomedicine, University of Algarve, Campus de Gambelas, 8005-139 Faro, Portugal; Matthias E Futschik – Email:
[email protected]; Phone: + 351 289 244 403; Fax: +351 289 818 419; *Corresponding author
Received June 08, 2012; Accepted June 09, 2012; Published July 06, 2012
Abstract: Synechocystis sp. PCC6803 is one of the best studied cyanobacteria and an important model organism for our understanding of photosynthesis. The early availability of its complete genome sequence initiated numerous transcriptome studies, which have generated a wealth of expression data. Analysis of the accumulated data can be a powerful tool to study transcription in a comprehensive manner and to reveal underlying regulatory mechanisms, as well as to annotate genes whose functions are yet unknown. However, use of divergent microarray platforms, as well as distributed data storage make meta-analyses of Synechocystis expression data highly challenging, especially for researchers with limited bioinformatic expertise and resources. To facilitate utilisation of the accumulated expression data for a wider research community, we have developed CyanoEXpress, a web database for interactive exploration and visualisation of transcriptional response patterns in Synechocystis. CyanoEXpress currently comprises expression data for 3073 genes and 178 environmental and genetic perturbations obtained in 31 independent studies. At present, CyanoEXpress constitutes the most comprehensive collection of expression data available for Synechocystis and can be freely accessed.
Availability: http://cyanoexpress.sysbiolab.eu
Key words: Cyanobacteria, Synechocystis sp. PCC6803, Gene expression, Meta-analysis, Cluster, Microarray, Transcriptome, Database
Background: Photosynthetic organisms have the fascinating capacity to harvest energy from sun light, and thereby provide for the majority of other life forms on earth. Cyanobacteria are believed to have been the first organisms which carried out photosynthesis and crucially contributed to the accumulation of oxygen in the atmosphere. Today, cyanobacteria are the main contributors to global biomass production and are responsible for up to 50% of the CO2 fixation in oceans. Besides their ecological importance for the environment, cyanobacteria ISSN 0973-2063 (online) 0973-8894 (print) Bioinformation 8(13): 639-643 (2012)
639
promise to be key instruments in the generation of renewable biofuels [1]. Among the various cyanobacteria, Synechocystis sp. PCC 6803 has been most intensively studied. Synechocystis can be easily genetically manipulated and can grow under both photohetero- and photoautotrophic conditions, making it a model organism for scientists around the world. Importantly, it was the first photosynthetic organism to be sequenced [2]. The complete sequence served as a basis for the development of several microarray platforms that can monitor expression changes for the full set of Synechocystis genes. Examination of © 2012 Biomedical Informatics
BIOINFORMATION
open access
generated microarray data has helped to decipher transcriptional regulation and has provided important clues to the functional relevance of specific genes. Unfortunately, the small number of samples and conditions tested in a typical microarray study limits the capacity to dissect interrelated regulatory mechanisms. Here, the integration of additional expression data from other studies can be helpful. Although public repositories offer ample expression data nowadays, utilization of these data for meta-analysis is by no means an easy task. Data needs to be collect from various repositories, that employ different query systems and data formats. Furthermore, care must be taken in their integration, as the different microarray platforms and analysis programs used in the original studies can cause additional heterogeneity in expression data. This is especially relevant in the case for Synechocystis. Plenty of genome-wide expression data sets have been generated over the last decades but they are dispersed at different locations and derived by different microarray technologies, hindering their direct use in meta-analyses.
examination of expression changes occurring in the Synechocystis wild-type, whereas the latter subsets allow a more focused inspection of the regulation of particular processes. Functional annotation of genes was obtained from Cyanobase [3]. The clustered expression matrices can be visualized and queried through a Common Gateway Interface (CGI)-based application, which is a modified version of the GeneXplorer software [11]. CyanoEXpress is currently running on an Apache web server under an Ubuntu Linux operating system.
Scope of CyanoEXpress: To facilitate the use of amassed Synechocystis expression data, we have collected publicly available raw microarray data, processed them in standardised manner and made the integrated data set accessible on our CyanoEXpress web-server. At present, 645 genome-wide (partially replicated) microarray measurements carried out in 31 independent studies have been evaluated and incorporated into CyanoEXpress Table 1 (see supplementary material) The integrated data set includes expression changes due to various environmental and genetic perturbations. In total, CyanoEXpress provides over 178 expression entries for 3073 Synechocystis genes, which accounts for 82.5% of the genes annotated in the Cyanobase [3]. A detailed meta-analysis of the data presented in CyanoEXpress will be published elsewhere.
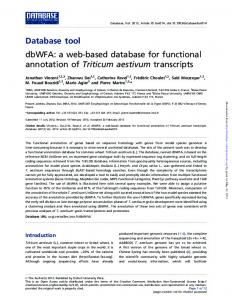
To visualize the clustered expression data, the user chooses one of the integrated datasets available on the Gene Expression page (Figure 1C). Here, the user can select whether they access the full set of microarrays measurements (with all perturbations included) or only measurements with environmental perturbations. Alternatively, expression data sub-sets for genes associated with specific functions can be selected (i.e., Photosynthesis and Respiration, Amino Acid Biosynthesis, Regulatory function, Transcription and Translation). Upon selection, a miniature heat map of the expression data is displayed on the left side of the page. Using the miniature map, a range of genes can be selected (Figure 1E) red square, and their expression pattern will be enlarged in a separated HTML frame (Zoom). The names and identifiers of the genes are given on the right side of the enlarged expression heat map. Gene identifiers are linked to the Cyanobase for following up study of the corresponding genes. The user can also query the database for specific genes, whose expression changes will be displayed. This can be done by entering a unique gene identifier or name in the Search for text field (Figure 1G), red circle. Expression changes are colour-coded by a green to red colour gradient, corresponding to decreased (green) or increased (red) expression with respect to the control sample. No differences in expression are represented by black squares, while grey squares indicate no available data. The overall graphical view is provided as a matrix formed by rows representing genes, and columns representing the environmental conditions or genetic perturbations. Finally, a simple mouse-click on a specific row generates a display of genes, which show a high correlation with the gene corresponding to that particular row (Figure 1F).
Data collection and implementation of web-server: Raw expression data were collected from the NCBI Gene Expression Omnibus [4], EBI ArrayExpress [5] and KEGG Expression database [6]. Data processing was carried out using the R/Bioconductor platform [7]. Datasets were individually processed and normalized by OIN (Optimised Intensitydependent Normalisation) [8, 9]. This method performs an optimized local regression of logged fold changes across the intensity range to correct for potential dye bias. Log2 fold changes were calculated with respect to the controls used in individual experiments (which were primarily Synechocystis wild-type cultures grown under standard conditions). Processed expression data were filtered to eliminate genes for which less than 80% of the measurements were available. To support identification of co-expression and potential coregulation, hierarchical clustering of genes was carried out on the filtered data set using the software Cluster 3.0 [10]. Clustering was based on complete linkage, with the Spearman correlation as similarity measure. Additionally, clustered expression matrices were generated for sub-sets of the microarrays and genes: (i) Expression data for all genes, but only for perturbations of environmental conditions, excluding data from genetic manipulation of Synechocystis; and (ii) expression data from all measurements, but only for a sub-set of functionally related genes (e.g., genes associated with photosynthesis and respiration). The former sub-set can aid ISSN 0973-2063 (online) 0973-8894 (print) Bioinformation 8(13): 639-643 (2012)
640
Usage of CyanoEXpress: The CyanoEXpress web-site (http://cyanoexpress.sysbiolab.eu) has a simple structure: from the Home page (Figure 1A) the user can easily navigate through the different sections. A Help page provides instructions for CyanoEXpress (Figure 1B). Information about the integrated microarray data sets is given on the Sample Information page (Figure 1D). Links are provided to the repositories from where the data sets were obtained, and to the publications in which the experiments are described.
Potential applications: CyanoEXpress enables examination and visualisation of gene expression changes for various experimental or genetic manipulations. The clustering of genes facilitates identification of coherent expression patterns, which can indicate coregulation across different conditions. For example, we found that transcripts of several subunits of NADH dehydrogenase complexes tend to be tightly clustered and display specific differential regulation upon environmental perturbations, despite originating from different operons. This observation suggests the existence of common regulatory mechanisms. © 2012 Biomedical Informatics
BIOINFORMATION
open access
Furthermore, CyanoEXpress can be used to assign unannotated genes to functions based on their co-expression with genes of known functions. This feature is advantageous given that numerous Synechocystis genes are yet to be assigned functions. For instance, we found that the expression of sll1735 (cupS), for which no functional annotation has been given in
Cyanobase, is correlated with genes encoding for NADH dehydrogenase subunits 4 and 5, and is similarly strongly upregulated under CO2 limitation. Such co-expression indicates a potential functional association of sll1735 with NADH dehydrogenase.
Figure 1: CyanoEXpress website. An introduction to CyanoEXpress is provided on its Home page (A) and instructions for its use are given on the Help page (B). Data sets can be selected on the Gene Expression page (C) and information regarding the integrated microarray studies can be found on the Samples information page (D). After selection of the data set, the CyanoEXpress can display the expression changes across different perturbations for a set of clustered genes (E), the co-expression and correlation with a selected gene (F) or the expression data for single gene upon query (G). Future development: CyanoEXpress will be routinely updated and expanded as new datasets become available. An option for the direct download of expression data for selected gene sets will be implement in the ISSN 0973-2063 (online) 0973-8894 (print) Bioinformation 8(13): 639-643 (2012)
641
near future. Finally, upcoming versions of CyanoEXpress will include a wider range of biological processes, for which specific expression matrices will be provided.
© 2012 Biomedical Informatics
BIOINFORMATION
open access
Acknowledgement: We thank Ravi Kiran Reddy Kalathur and Trudi Semeniuk for critically reading the manuscript. The work presented was supported by the Portuguese Fundação para a Ciência e a Tecnologia (PEst-OE/EQB/LA0023/2012; PTDC/BIAMIC/101036/2008). References: [1] Parmar A et al. Bioresource Technology. 2011 102: 10163 [PMID: 21924898] [2] Kaneko T et al. DNA Res. 1996 3: 185 [PMID: 8905238] [3] Nakamura Y et al. Nucleic Acids Res. 1998 26: 63 [PMID: 9399802]
http://www.ncbi.nlm.nih.gov/geo/ http://www.ebi.ac.uk/arrayexpress/ http://www.genome.jp/kegg/expression/ http://www.bioconductor.org/ Futschik M & Crompton T, Genome Biol. 2004 5: R60 [PMID: 15287982] [9] Futschik ME & Crompton T, Bioinformatics. 2005 21: 1724 [PMID: 15585527] [10] de Hoon MJ et al. Bioinformatics. 2004 20: 1453 [PMID: 14871861] [11] Rees CA et al. BMC Bioinformatics. 2004 5: 141 [PMID: 15458579] [4] [5] [6] [7] [8]
Edited by P Kangueane Citation: Hernandez-Prieto & Futschik, Bioinformation 8(13): 639-643 (2012) License statement: This is an open-access article, which permits unrestricted use, distribution, and reproduction in any medium, for non-commercial purposes, provided the original author and source are credited
ISSN 0973-2063 (online) 0973-8894 (print) Bioinformation 8(13): 639-643 (2012)
642
© 2012 Biomedical Informatics
BIOINFORMATION
open access
Supplementary material: Table 1: Overview of data included in CyanoEXpress Number of studies 31 Number of microarrays 645 Number of genes 3073 Number of conditions 178 Number of genetic mutations 69 Number of environmental conditions 109
A
B
C
F
G
ISSN 0973-2063 (online) 0973-8894 (print) Bioinformation 8(13): 639-643 (2012)
643
© 2012 Biomedical Informatics